Save 23% ($351) & Get a Free 1-1 Call with our Team ⏰ : 0d 2h 59m 43s

The market has been retracing for the past couple of months, and sentiment has flipped to a new bear. But bear markets don’t begin with Bitcoin dominance falling, a rolling over dominance is usually the start of outperformance for the wider market. A falling dominance alongside an elevated stablecoin dominance and big alts sitting on higher-timeframe demand is the setup that tends to precede rotation.
We are not calling a bottom, but we are conveying what the market is trying to show us. If dominance keeps trending lower while stablecoin dominance starts falling from the supply zone, and the key ratios against BTC stop making new lows and begin turning higher, the next leg typically starts from here.
Here’s what we’ll be looking at in today's report:
- Fear & Greed Index
- Bitcoin Dominance & Stablecoin Dominance
- Total3 Excluding-Stables
- Rotation Ratios
- Mapping ratio bottoms to market returns
- Total Crypto Market Cap
- ETH/BTC (weekly & daily)
- Bitfinex Margin Longs
- Cryptonary’s Outlook (Important)
Disclaimer: This is not financial or investment advice. You are responsible for any capital-related decisions you make, and only you are accountable for the results.
Fear & Greed Index: We Are at Extreme Fear 👀
Let’s start with market sentiment. Everyone is talking about the 4-year cycle theory and how it supposedly marked a cycle top back in October. People are expecting a bear market, and sentiment has turned deeply negative.Looking at the Fear and Greed Index, we can see that we are currently sitting in Extreme Fear. The last time this happened was back in April, when Trump announced tariffs, and that moment marked a bottom, not the start of a bear market.
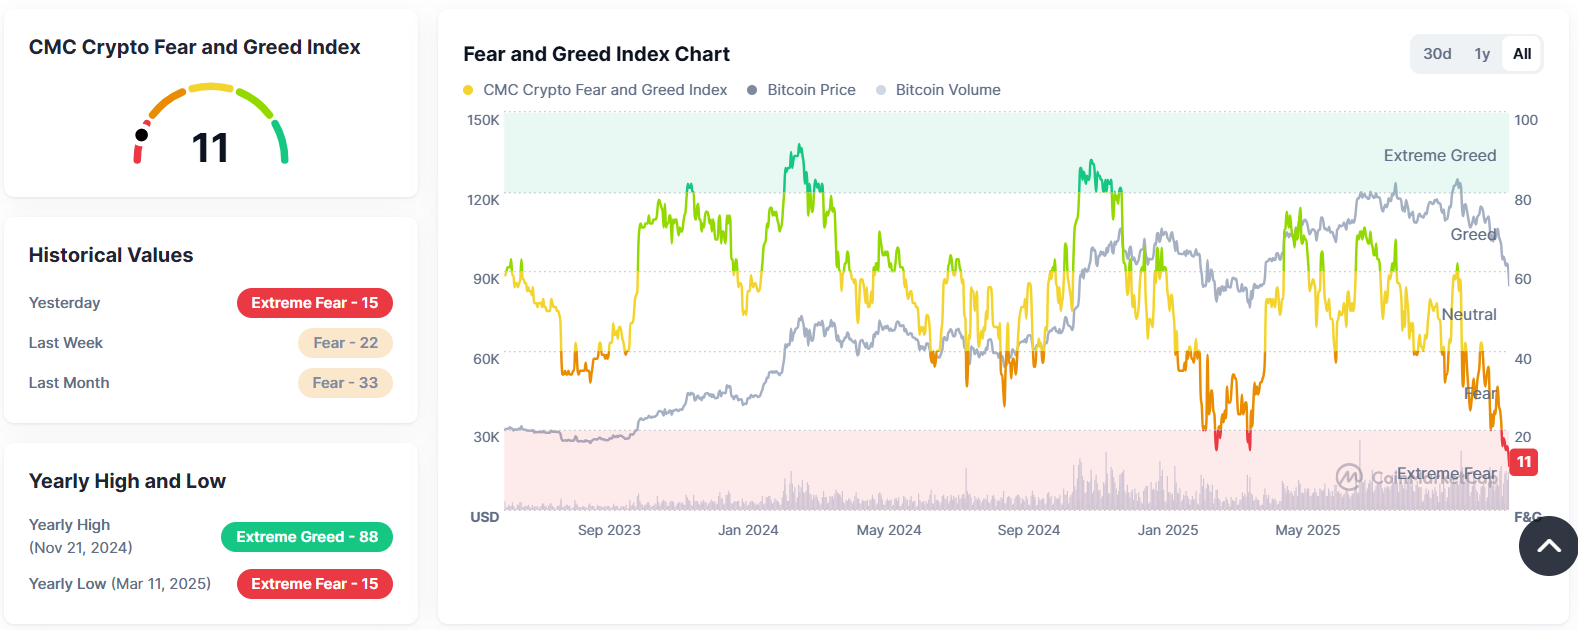
CMC Fear and Greed Index
Obviously, the context this time around is slightly different; however, even though Extreme Fear rarely marks the exact bottom, it consistently marks the bottoming zone. This is where sentiment is at its weakest and the risk-reward skews heavily in favour of accumulation rather than capitulation.We are not saying that we have bottomed already, but based on Fear & Greed, this is not a bad place to add to long-term high-conviction bags… and then simply log off and let the market do the heavy lifting.
Now, let’s look at some charts to see a more comprehensive picture of the market
Bitcoin Dominance (BTC.D)
We start where rotations generally begin: BTC.D has flipped into a clean lower-high, lower-low (bearish) structure after breaking down from the long rising wedge that ran through 2023 - mid 2025.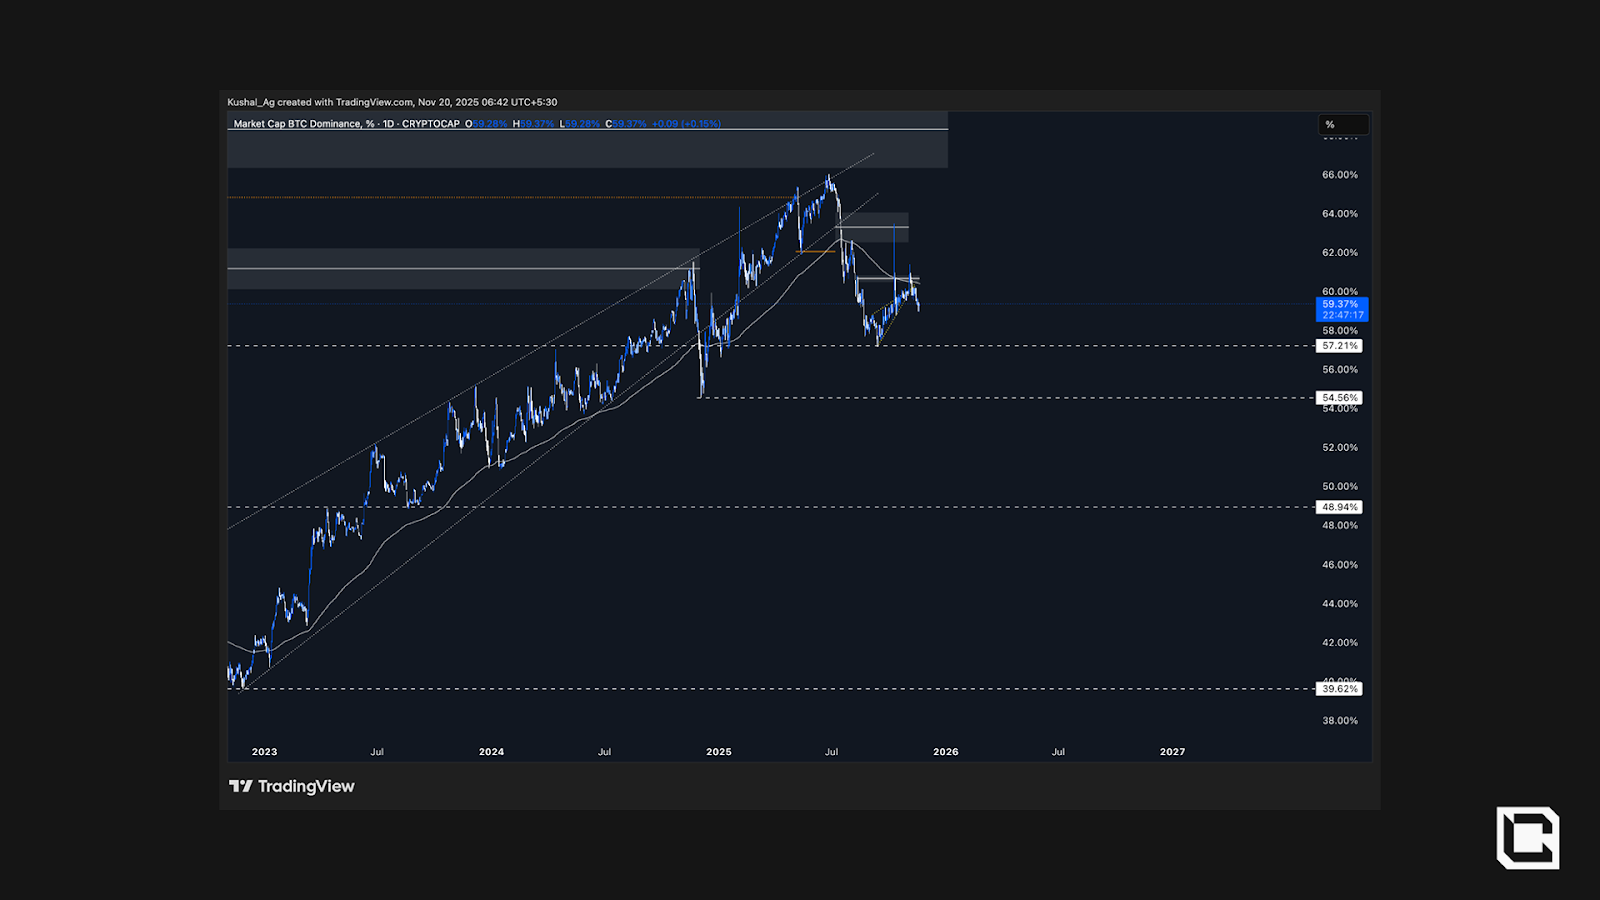
Bitcoin Dominance Chart
The October 10th liquidation spike was a quick retest wick on the upside. Since then, a smaller Sep-Nov wedge has also broken lower, confirming trend continuation. The 200 EMA near 60.4% capped every bounce; it’s the “line in the sand” that keeps rejecting.Invalidation for the bearish structure would be a decisive reclaim and hold above 60.85% on a weekly close.
BTC.D trending down from the 200 EMA and failing at supply tells you the market is setting up for the altcoin share to expand, if sidelined liquidity cooperates.
For that, we need to pair BTC.D with stablecoin dominance. If the combined dominance for both also starts slipping from supply, it confirms that the speculative capital is rotating back into risk, not just out of BTC.
Let’s look at that next…
Bitcoin + Stablecoin Dominance
This combined stablecoin index has started printing lower highs/lows, but the decisive shift hasn’t triggered yet because it’s still hovering just above the 200 EMA. Overhead, supply is stacked in layers, 68% first, 69% next, and the key 70.8–71% zone that was rejected on 10 Oct.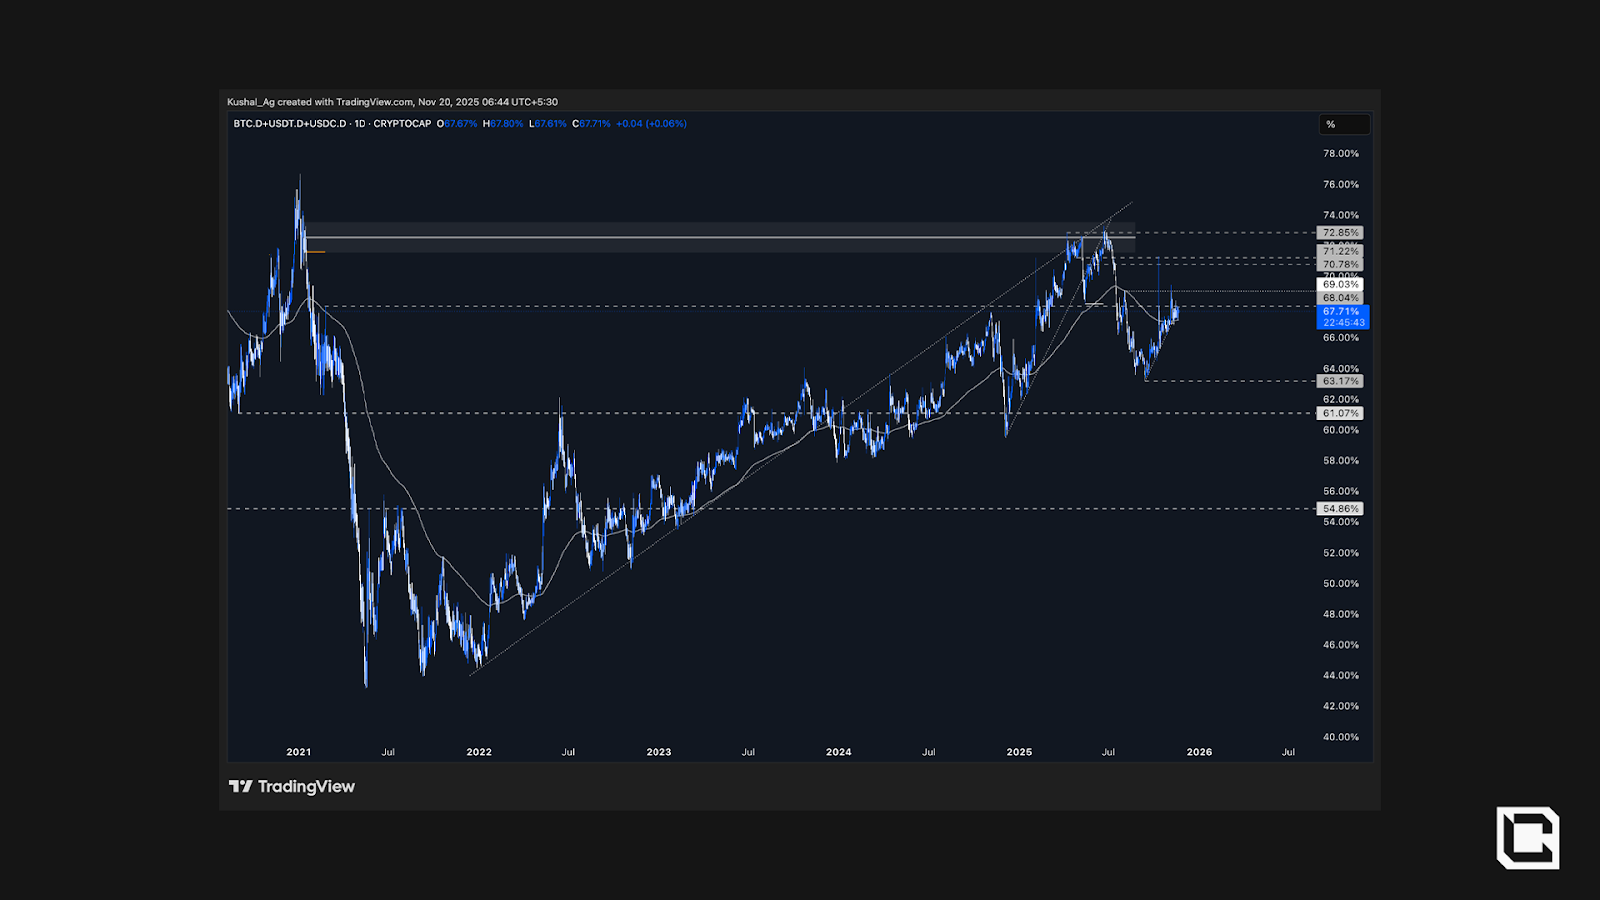
Bitcoin+Stablecoin Dominance Chart
What triggers the move here? A clean break and weekly close below 66-67% would simultaneously lose the 200 EMA and that short up-trend, signalling that the speculative capital is now rotating from BTC + stables now back into risk. Invalidation for the rotation signal would be a sustained reclaim above 69% and especially 70.8–71% with follow-through.The altcoin market also needs a strong base to start its next move. We will try to look at Total3, excluding stable,s using a 3-day timeframe chart for a higher timeframe view for the alt market.
Total3 Excluding-Stables (3 day TF)
Total3 (ex-stables) is hovering right on its higher-timeframe 3D demand and the 3D 200 EMA, the same confluence that has anchored every meaningful reset this cycle. Hold here, and the path of least resistance is a grind back into the mid-range; fail here, and the market likely clears the October liquidity below before it can rebuild.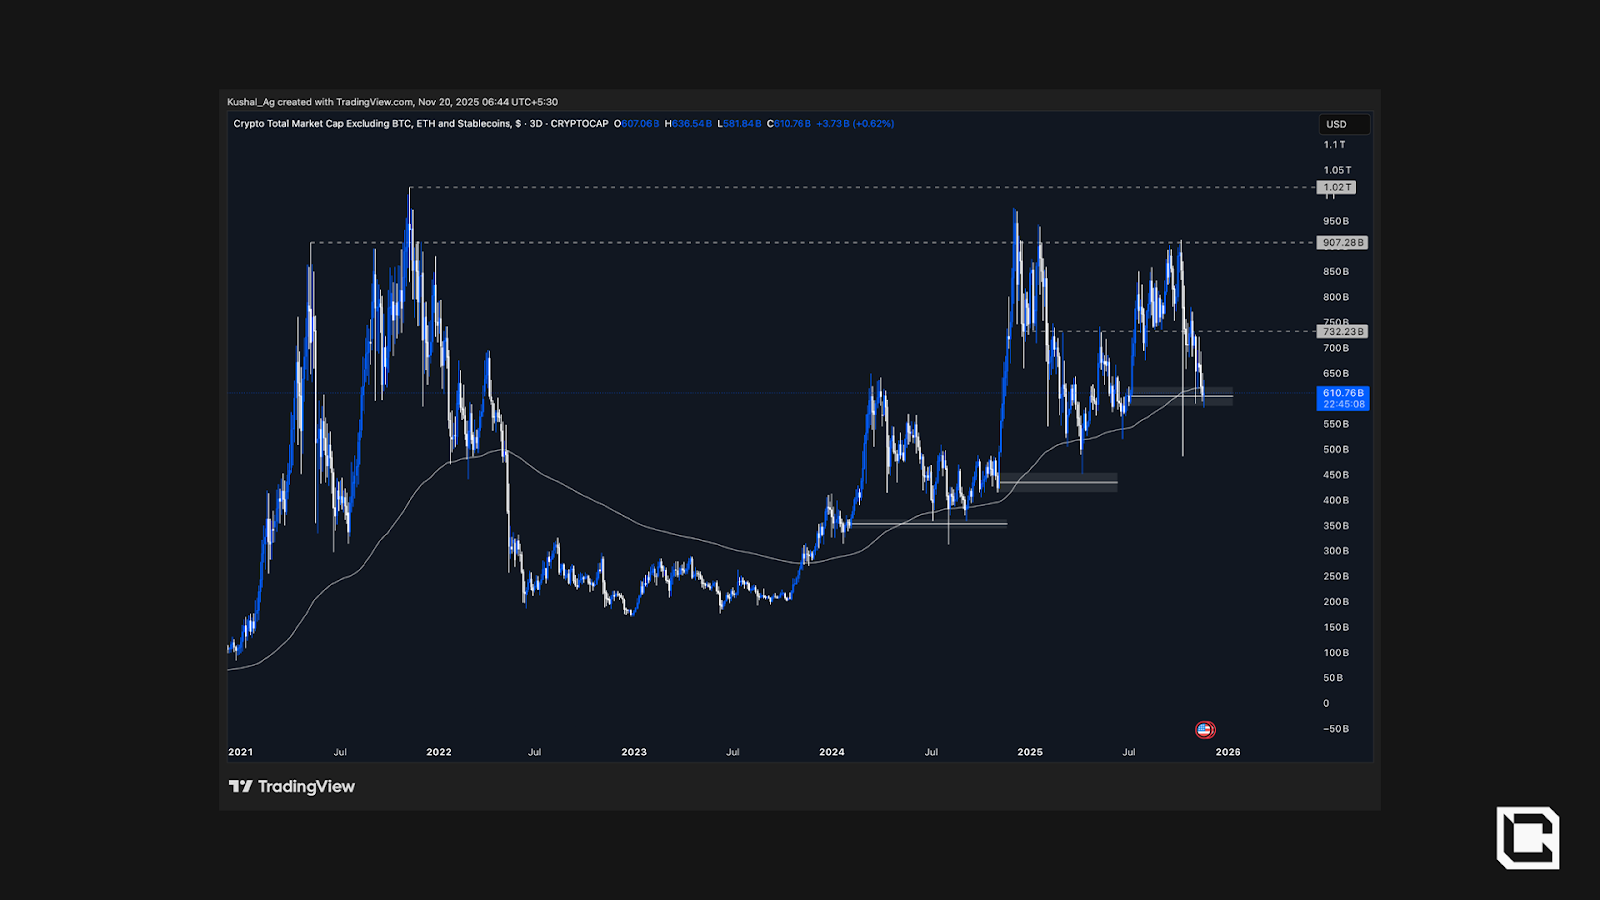
Total 3 Excluding Stablecoins
Scenarios to look out for:- Acceptance above $620B (EMA + demand) keeps the alt structure constructive and opens a measured push toward $732B and potentially $907B.
- Failure below $570B turns might lead to a flush towards $486B, after which a fresh base would be required. (This is where the 200 EMA on the weekly timeframe is also placed, making this an important area of demand)
To confirm this rotation, we now move to analysing these ratios next.
Total3/BTC (monthly) and Others/BTC (weekly)
When rotation is real, you’ll see Total3/BTC and Others/BTC base and start turning up. These two ratios are the cleanest signals that alts are beginning to participate.Total3 vs BTC (Monthly):
1,500 days of grind lower/sideways since late-2021, then 900 days of range since mid-2023. The longer this base stretches, the closer we typically get to a decisive turn. The 2017 impulse in this ratio exceeded 2021, so 2025–26 could be shorter, but a break from this multi-year structure can still be powerful.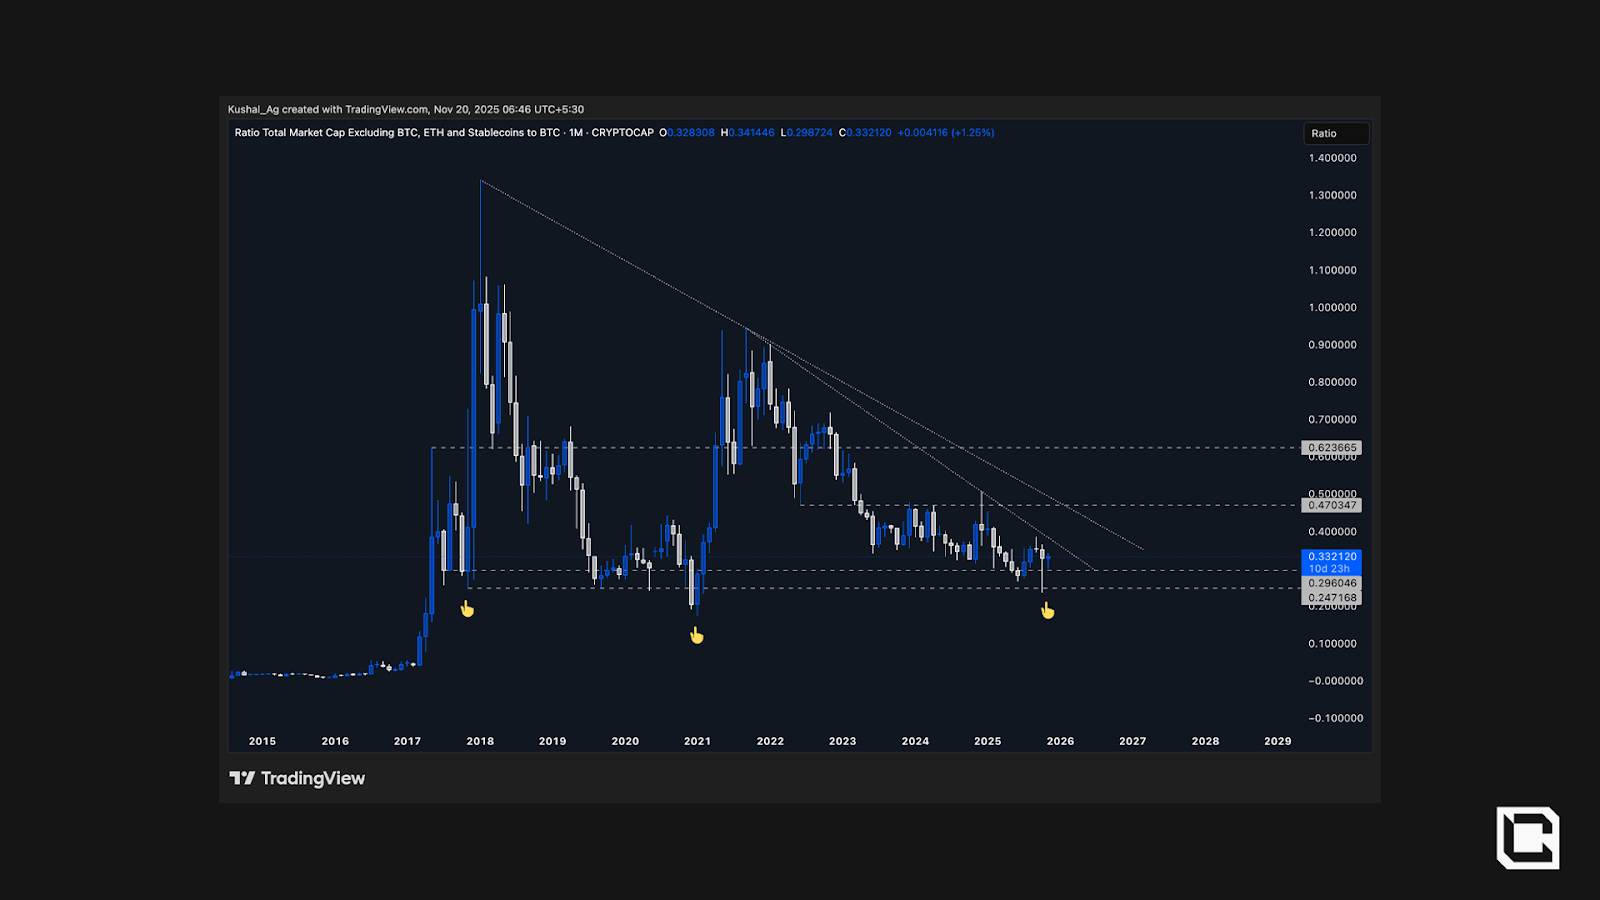
Total3/BTC chart
Ceilings sit at 0.47 and 0.623; a run to 0.623 implies roughly +85–90% outperformance vs BTC from here. High-timeframe supports remain 0.296 and 0.247—the same zones that ignited the 2017 mid-leg and 2021 main leg.Invalidation: weekly/monthly failure back below 0.296 delays rotation.
Others vs BTC (Weekly):
Back in 0.082–0.102 weekly demand, the launchpad for the 2021 leg (and stage two of 2017). The Oct 10 wick tapped the zone and snapped back. Since February, it’s mostly sideways base-building. The latest push down was a lower-low wick, not a confirmed swing, and there’s a bullish RSI divergence.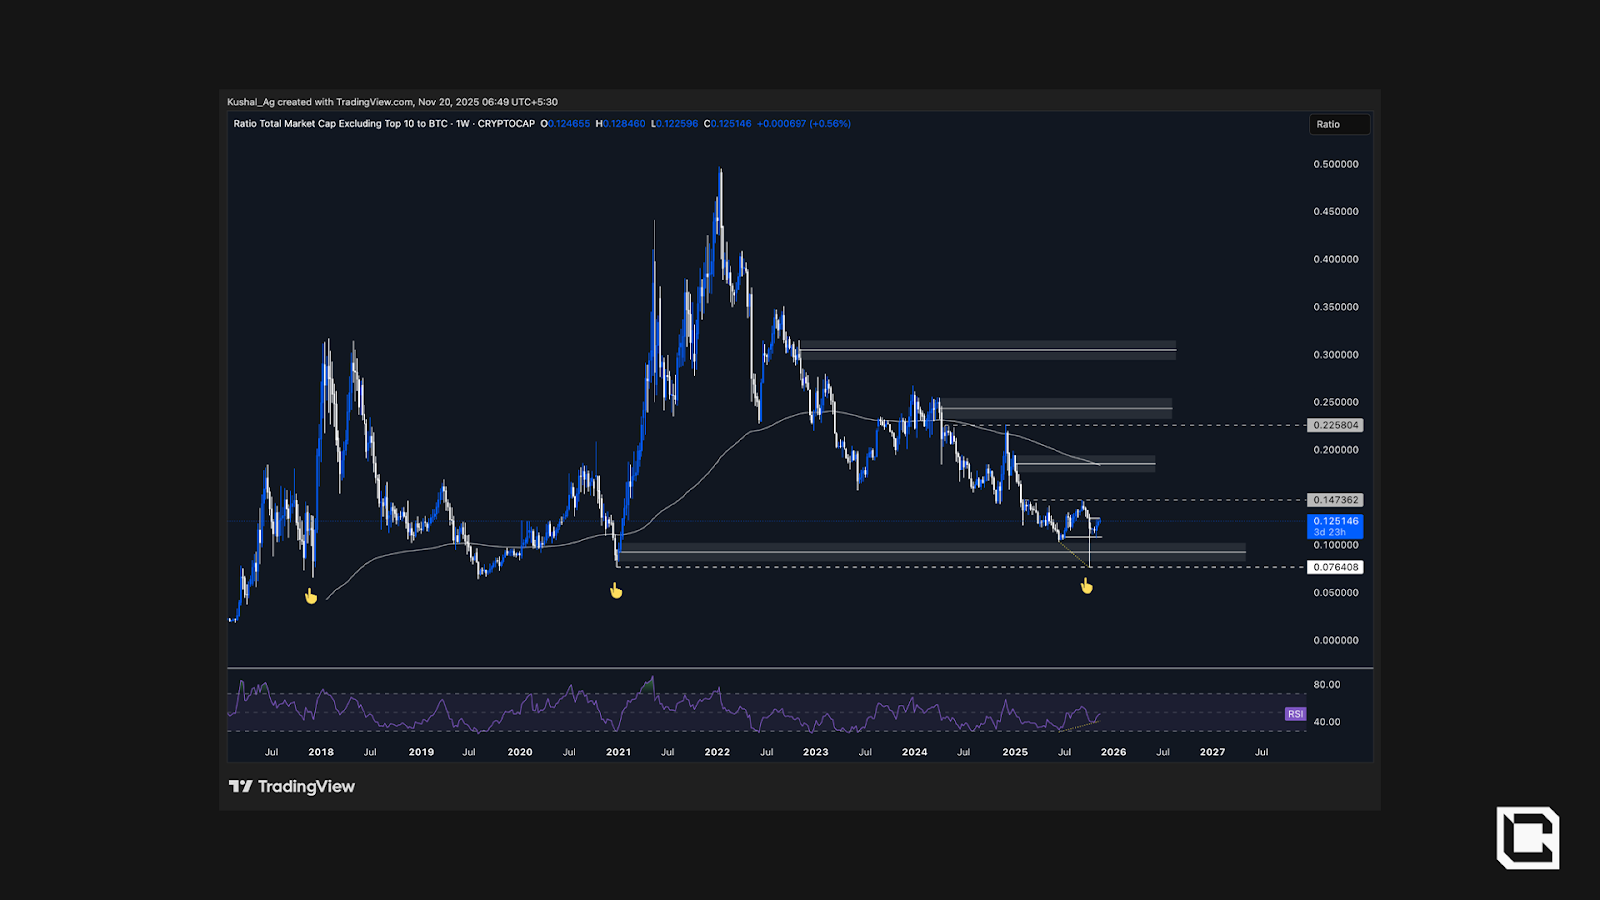
Others/BTC chart
First trigger is a reclaim of 0.147, above that, the 200-week EMA around 0.184 aligns with weekly supply 0.176-0.194. Next supply sits 0.231–0.253 (midpoint 0.243), with equal highs 0.225 as nearby liquidity.Weekly RSI divergence supports the base case on Others/BTC.
Invalidation: weekly close below 0.082 extends the base and pushes timing out.
We now map prior ratio bottoms to what Total and Others did next to size the potential once these turns stick.
Mapping ratio bottoms to market returns
Once Total3/BTC and Others/BTC stop making new lows and turn up, the entire pie grows, and more alts join the move. Both the ratios bottomed around a similar time previously, and here’s how that played out the last two cycles…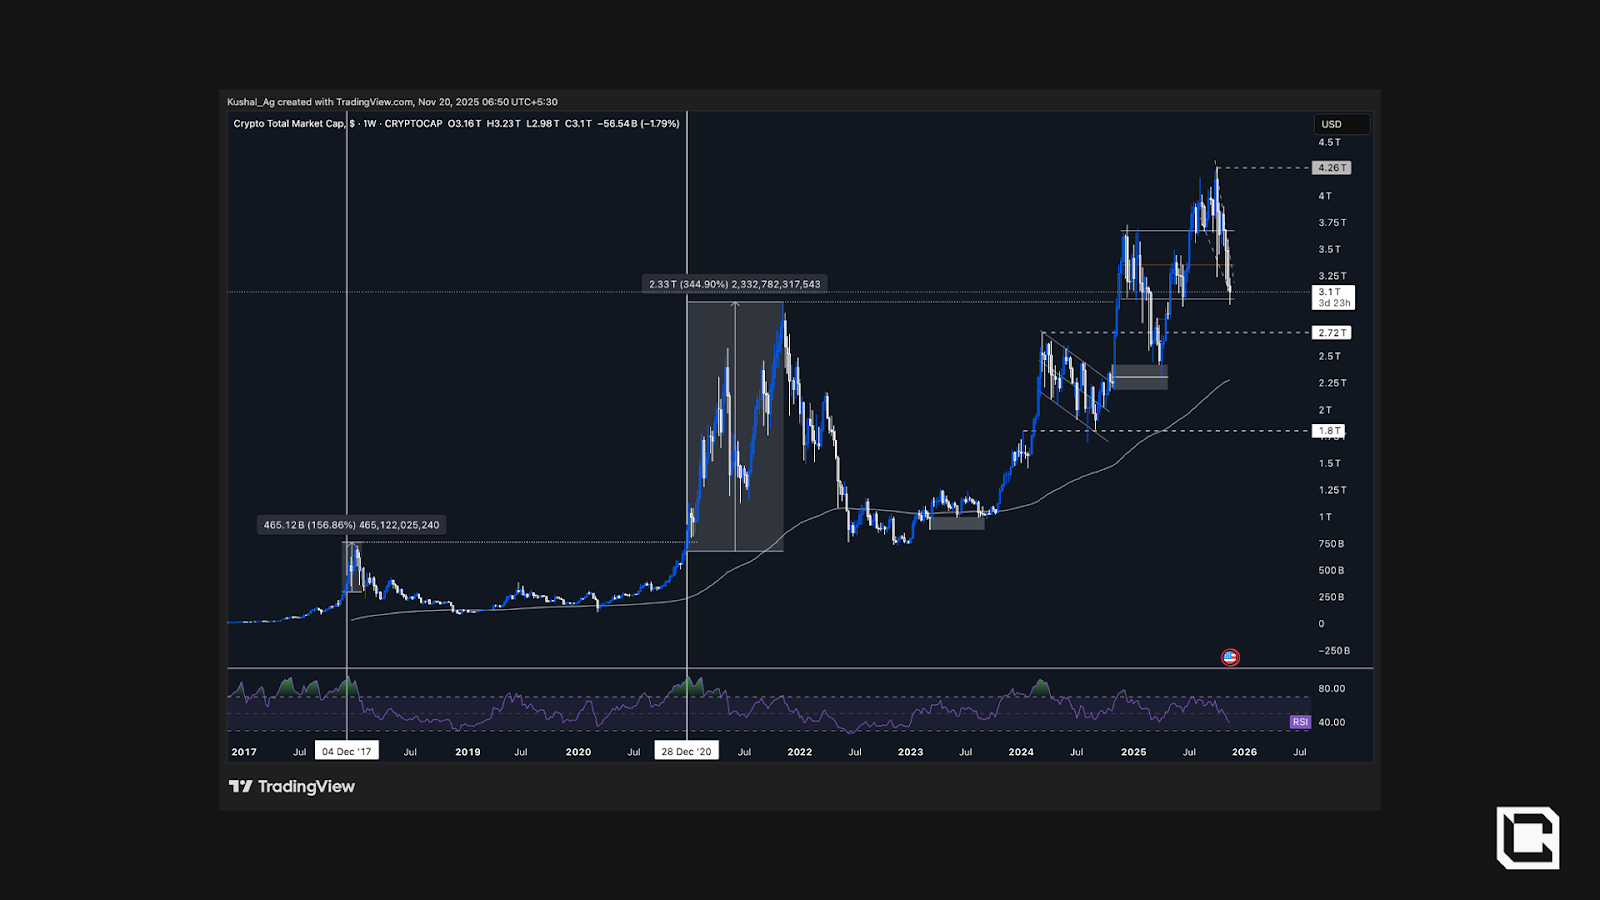
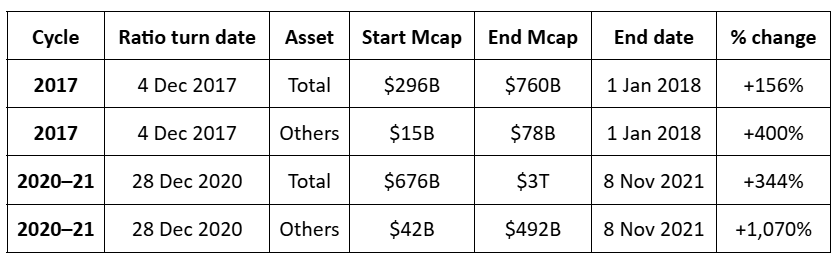
Total (after ratios bottomed)
- 2017 episode ( Dec 2017 → Jan 2018): $296B → $760B (+156%)
- 2020 episode ( Dec 2020 → Nov 2021): $676B → $3.0T (+344%)
- 2017 episode ( Dec 2017 → Jan 2018): $15B → $78B (~+400%)
- 2020 episode ( Dec 2020 → Nov 2021): $42B → $492B (+1,070%)
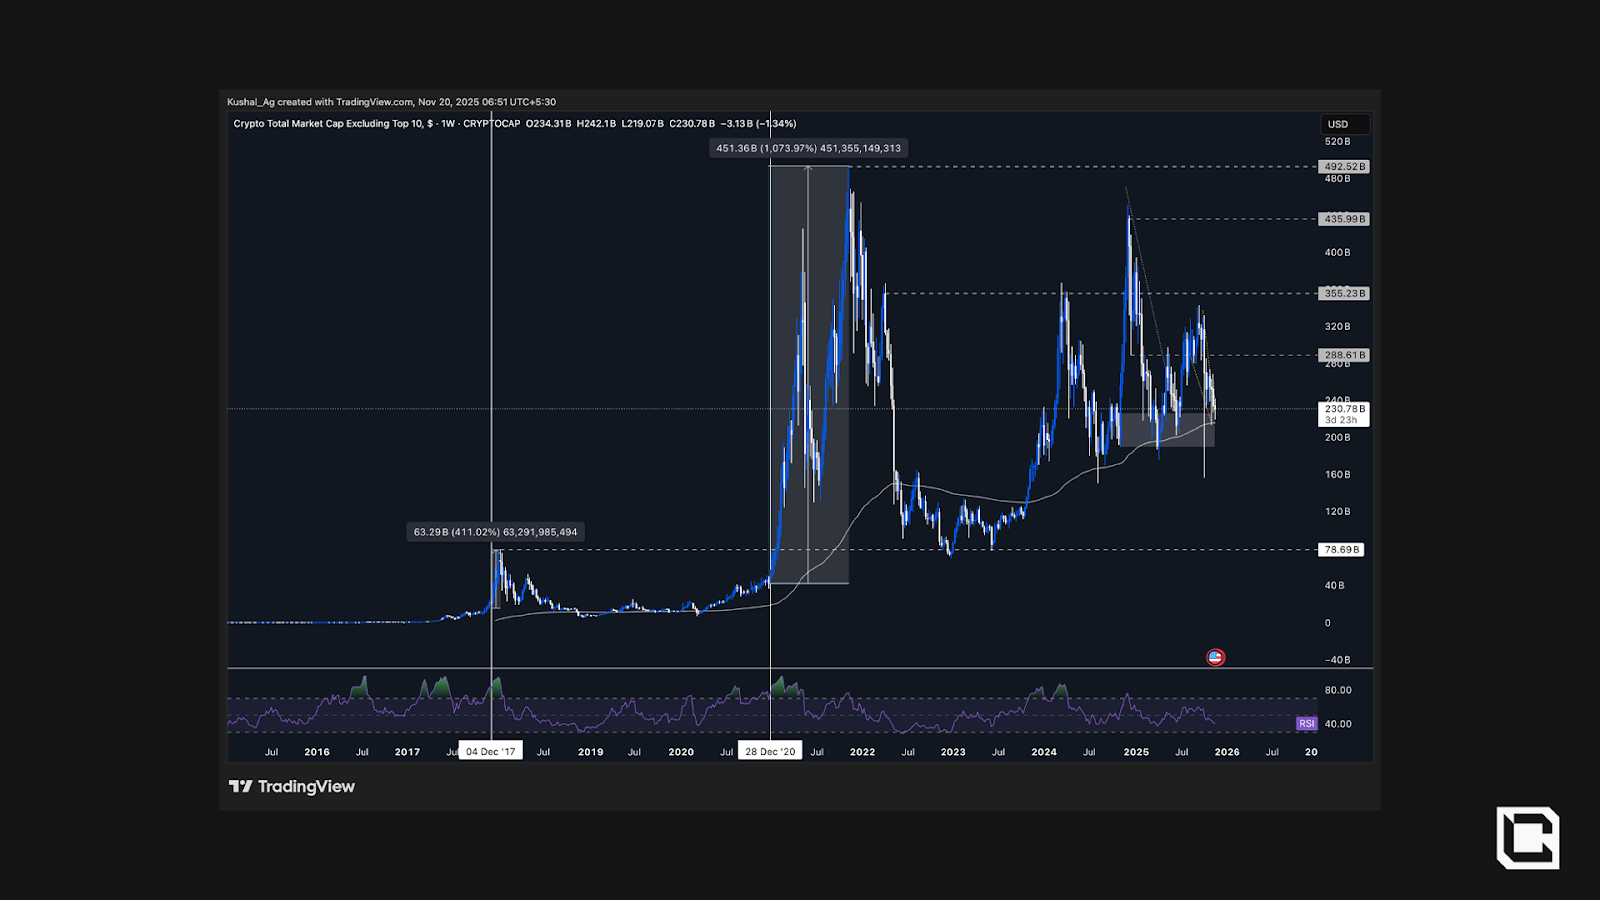
The focus shifted progressively from BTC to the wider market as the advance matured.
Market performance after the ratio turns
We’re not assuming the same magnitudes, but when these ratios base and turn, follow-through in Total and Others has been sizable. Initial hesitations are common; the bigger move has tended to unfold over weeks to months after the turn.
If the ratios break back below their base supports (Total3/BTC: 0.296/0.247; Others/BTC demand: 0.082-0.102), the rotation clock resets and the upside timing pushes out.
Now we will be analysing the Total crypto market cap (3-day timeframe) for a better understanding of where we are actually in this market right now.
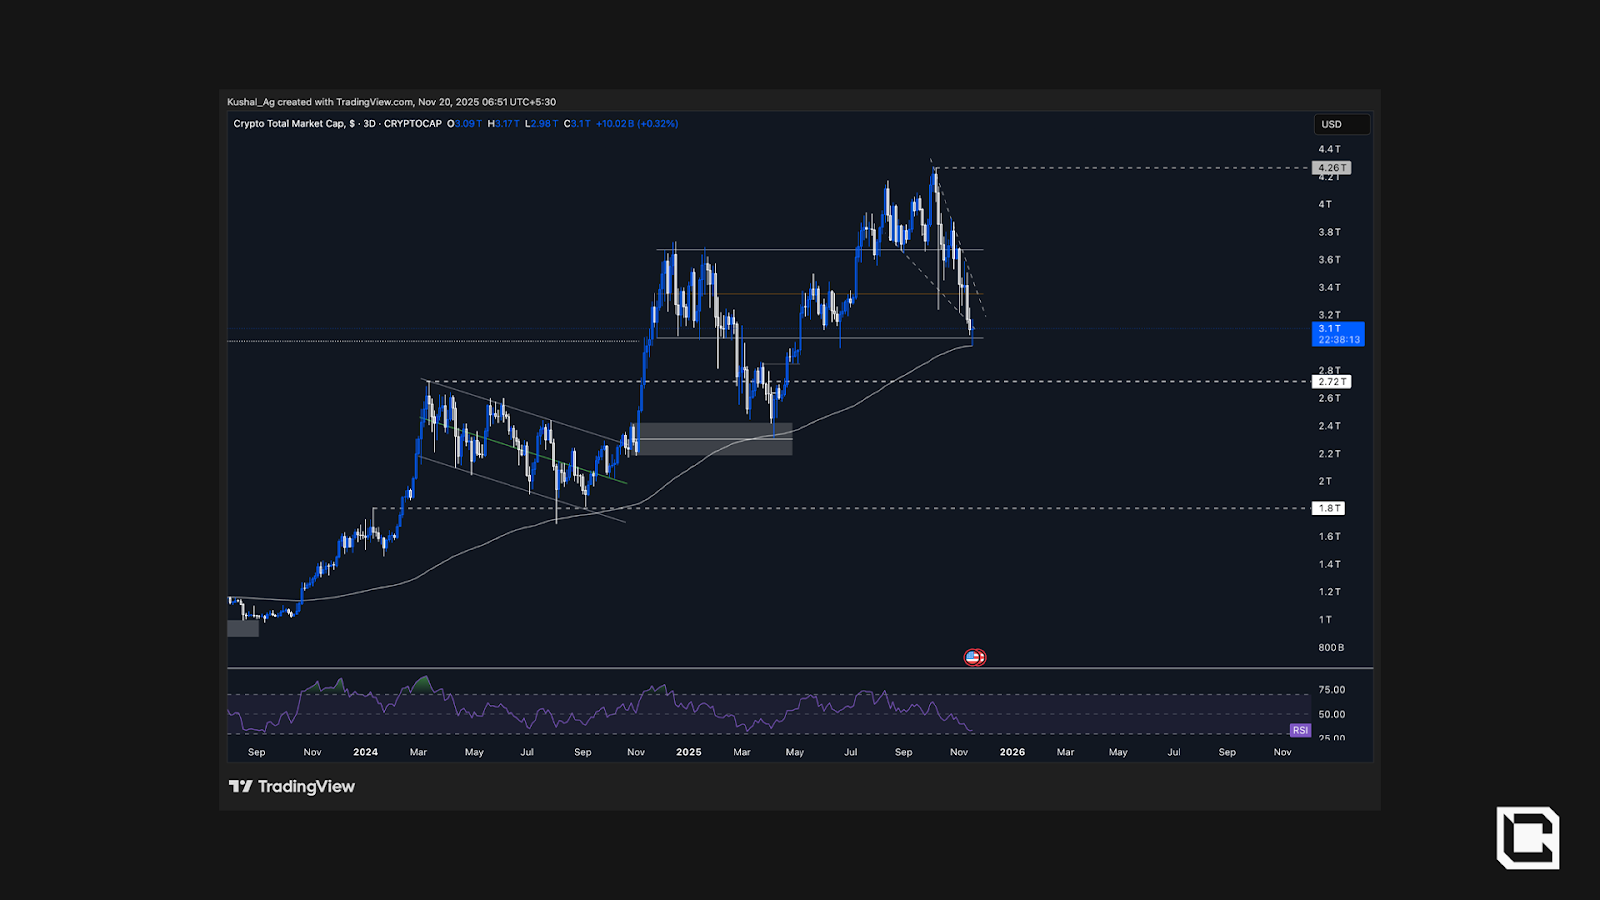
Total (3-day TF): structure, levels, context
After the ratio work, we sanity-check the backbone. On the 3-day chart, TOTAL has repeated the same behaviour three times this cycle…- Impulsive advance →
- Retrace to the 200-EMA →
- Continuation
Total Crypto Market Cap Chart
The first retest (Aug ’24) held near $1.72T with RSI around 37, the second retest (early ’25) held near $2.33T with RSI around 39.We’ve just tapped the 200-EMA again on the 3-day timeframe around $2.98T, with RSI being at 32, the most “oversold” of the three. Price is also sitting back on the 2021 ATH band ($3.01T) and the late-’24/early-’25 range floor ($3.03T), turning prior resistance into support.
In between, TOTAL broke that range, reclaimed it, squeezed above, then slipped back inside, classic mid-cycle deviation and re-test behaviour. The question now is whether this third 200-EMA touch resolves the same way the last two did.
Prior bounces occurred with RSI at 37 and 39; the current RSI at 32 suggests more reset than before. Reclaiming and holding above $3.35T would confirm the range-reaccumulation view, losing $2.98T/$3.03T with follow-through opens the $2.72T test.
Stablecoin Dominance
Stablecoin dominance has ranged in a broad band this cycle, support 4.8–5.6%, supply 8.6–8.9%. Each touch of supply aligned with the Fear & Greed Index flipping to extreme fear, each return to support aligned with greed. That rhythm has repeated multiple times and is intact today.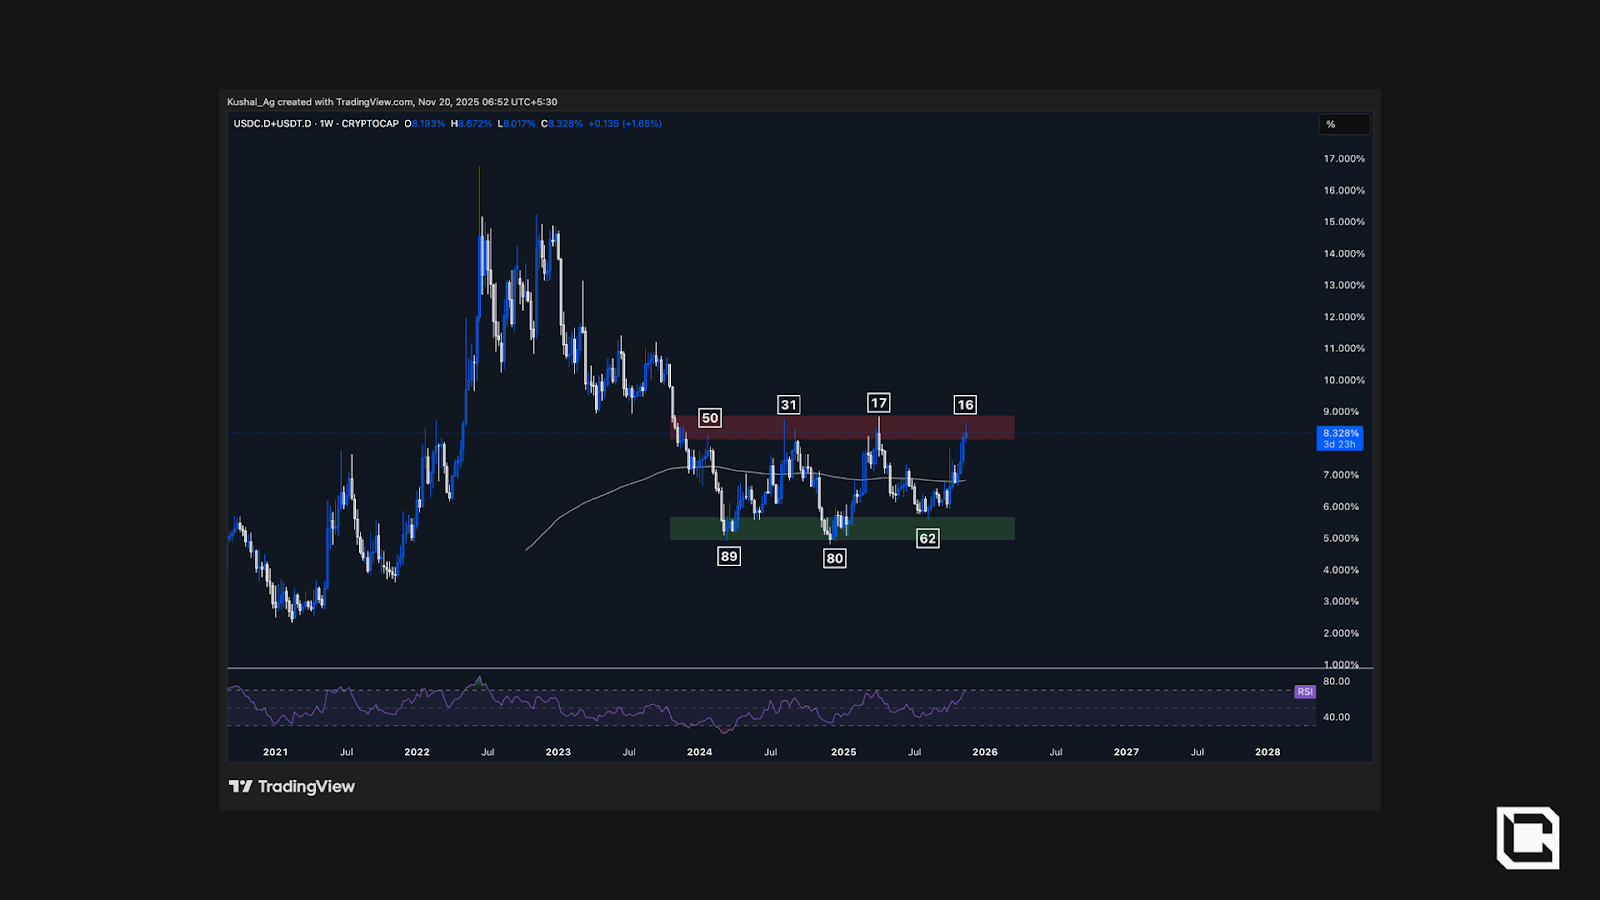
Stablecoin Dominance Chart
Key zones:- Supply (risk-off): 8.6-8.9%. Rejections here have coincided with FGI in fear (10-30).
- Support (risk-on): 4.8-5.6%. Bounces here have aligned with FGI in greed (60-90).
If stablecoin dominance rolls over from supply and trends back below 8.0% → 7.5% on a weekly close, it signals stablecoins leaving the sidelines, a setup that has preceded risk-on legs. A push through 8.9% would argue for more caution.
We now move to ETH/BTC’s analysis on the weekly and daily, along with a 2022 inverse analogue, which we will be looking at by analysing ETH's chart later.
ETH/BTC: Weekly and Daily
ETH/BTC likely set its local low in April ’25 at 0.0176 (monthly demand). Since then, it has bounced, shifted bullish and is now battling the downtrend line from Sep ’22. Price is based above a structural support band at 0.030–0.032, with the rising trendline near 0.0323.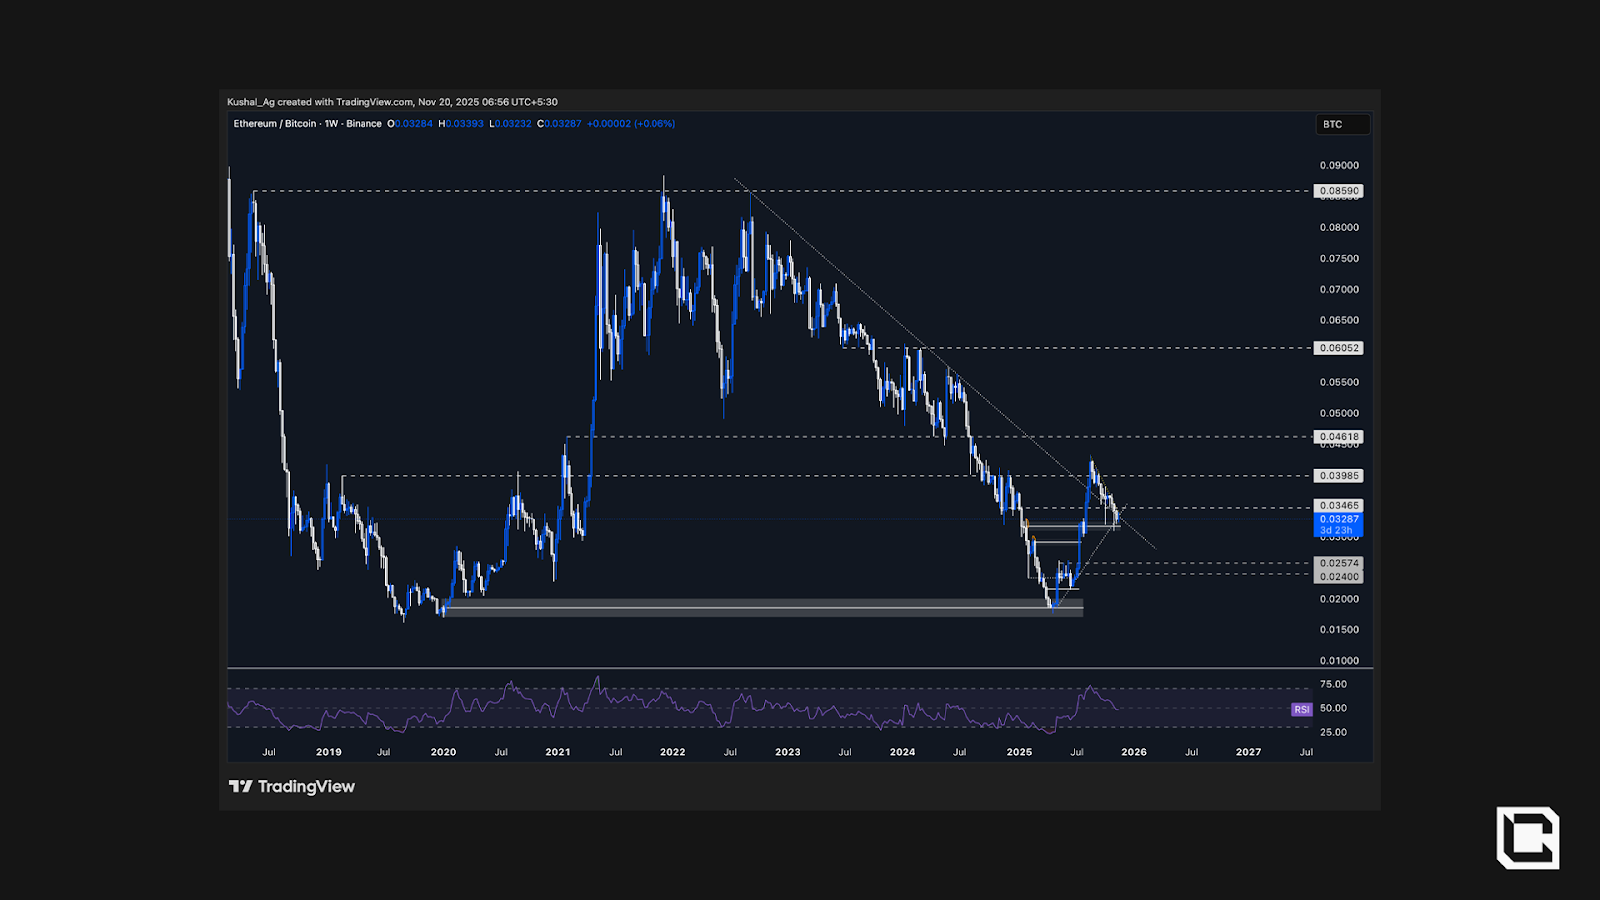
ETH/BTC Chart
A clean reclaim of 0.034 turns the corner, follow-through over 0.0398 opens 0.0461, then a higher timeframe target at 0.060.Key levels (weekly):
- Support: 0.030–0.032, 0.0257
- Resistance: 0.034, 0.0398, 0.0461 & 0.060.
- Key 200 EMA (daily): 0.033.
- Break/hold: >0.0346, Targets: 0.03985 —> 0.04618
- Failure: <0.0325 & 0.030 —> Downside Target: 0.029 & 0.0257
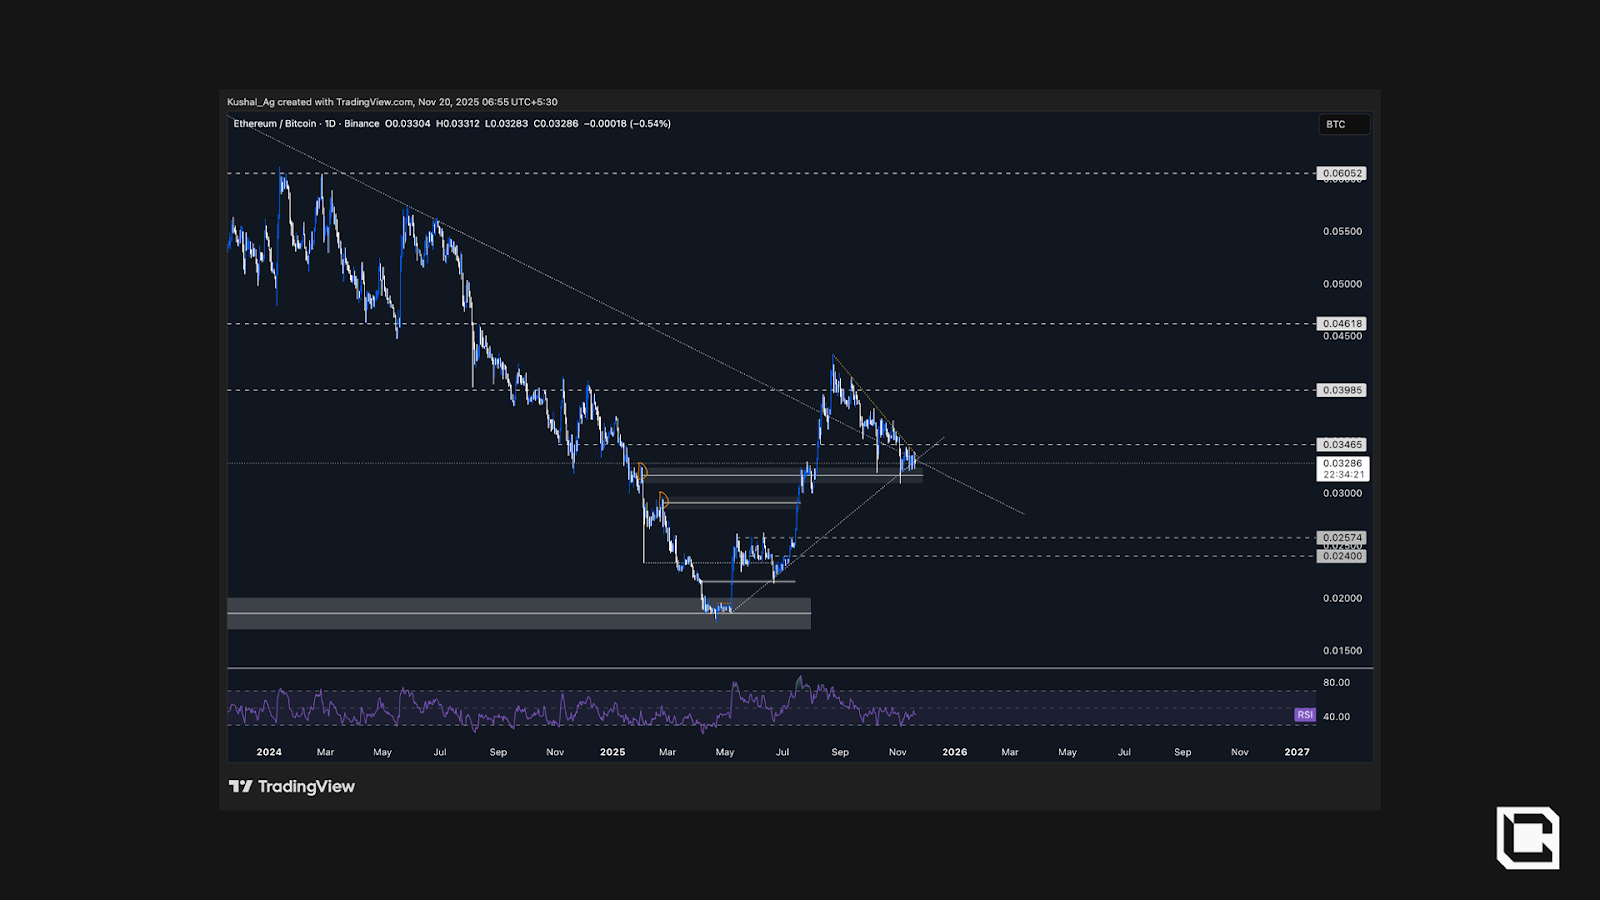
Price is hovering around the 200 EMA 0.033 while compressing inside a short-term downtrend (since late Aug ’25). The base has held 0.030–0.0325 repeatedly.
Daily close >0.0346, then holding >0.034, confirms a break of that compression. Lose 0.0325 → 0.030, and the setup slows with potential deeper retracements.
What would confirm strength:
- Weekly close above 0.034, then momentum through 0.0398.
- Daily structure flipping higher while holding the 200 EMA.
- Sustained closes <0.030 on weekly, or multiple rejections at 0.034-0.035 with fresh lows.
- If ETH/BTC stabilises above 0.034-0.035 and pushes toward 0.040, focus typically tilts toward ETH and higher-beta alts. We will now confluence this with ETH’s current weekly psychology vs back in 2022.
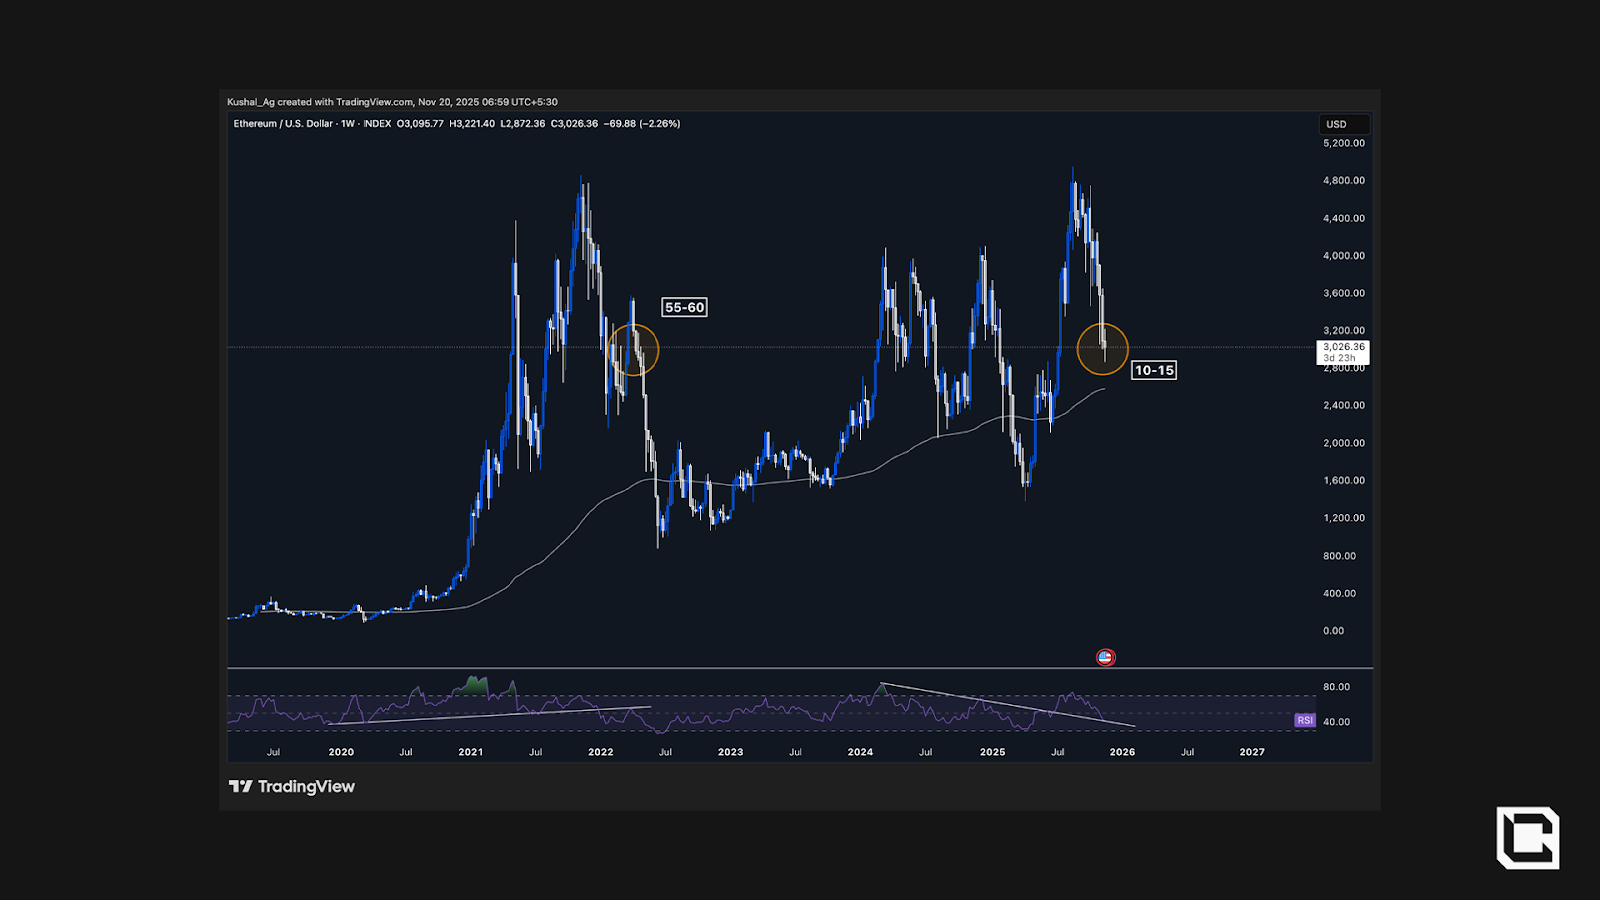
Set up: ETH is back near the $3k band, the same zone seen in Mar/Apr 2022, but the market context is inverted.
ETH/USD Chart
- Then (2022): Weekly RSI broke down, retested from below, then rolled; FGI 55–60 (complacent greed). Price weakness followed.
- Now (2025): Weekly RSI has broken out and is retesting; FGI recently 10–15 (extreme fear) despite the same ~$3k price area.
- Price: $3,000 for both periods.
- RSI posture: Breakdown & fail (2022) vs Breakout & retest (now).
- Sentiment: Greed 55–60 (2022) vs Fear 10–15 (now).
- Implication: Same price ≠ same risk, today’s momentum/sentiment mix skews constructive if the retest holds.
Again, we’re not trying to call the bottom here; we’re reading what the market is showing, same sticker price, very different psychology. One that has historically supported continuation once the retest sticks.
Now we cross-check this with Bitfinex margin long positioning on BTC to see if large players' behaviour rhymes with prior inflection phases.
Whales Keep Longing on Bitfinex
Through this cycle, Bitfinex margin longs have tended to build during drawdowns/sideways phases and unwind into strength. The same pattern appears to be repeating, after rebuilding from mid-June ’25, positioning has continued to rise while BTC has chopped lower/sideways, a behaviour that previously preceded upside legs.
BTC price + longs on Bitfinex
Key timestamps:- Mid-Mar ’24 → Q3 ’24: Start of the first 6+ month range; longs built as BTC went sideways.
- Q4 ’24 breakouts: As BTC pushed up, longs unwind into strength.
- Late Dec ’24 → Apr ’25: New drawdown, longs rebuilt into the lows, then reduced as price recovered.
- Mid-Jun ’25 → now: Another range/drawdown, longs building again despite volatility.
Key invalidation levels to watch:
• Total market cap: sustained loss of $2.98-3.03T opens $2.72T • BTC.D: weekly close above 60.85% delays rotation • BTC+Stable.D: sustained reclaim above 69%, especially 70.8-71%, signals more caution • Stablecoin.D: push through 8.9% argues for more caution • Total3/BTC: breakdown below 0.296 resets timing • Others/BTC: weekly close under 0.082 extends the base • ETH/BTC: failure to hold 0.030-0.032 weakens the setupWe will be watching these levels closely, and update you in real time as things develop.
Now let's summarise and lay out our outlook moving forward
Cryptonary’s Take: Bullish Q1/Q2
Is the bottom in? Extreme Fear rarely marks the exact bottom, but it consistently marks the bottoming zone. Right now, we would say we are close to the bottoming zone (60%-75% probability), though we might not have yet put a final bottom.Our thesis is that we get a bullish Q1. This is our base case if dominance metrics and ratios confirm in the coming weeks. Extension to Q2 if invalidation levels are tested but hold, requiring a slower re-accumulation phase. New lows are still on the table, but those are likely to result in bullish divergences.
Playbook: don’t go all-in at a single price. DCA over the coming weeks, add more on deeper red days, and always keep dry powder for potential liquidation events. We don’t expect a V-shape; let the range build, let entries average down.
Keep your positioning in high conviction picks. Our barbell will be BTC, ETH, SOL, HYPE, AURA. BTC and ETH anchor the core, SOL captures L1 beta, while HYPE and AURA give us asymmetric upside across both utility and meme narratives
We’ll keep tracking all of this and update if anything material flips.

Cryptonary, OUT!
Continue reading by joining Cryptonary Pro
$1,548 $1,197/year
Get everything you need to actively manage your portfolio and stay ahead. Ideal for investors seeking regular guidance and access to tools that help make informed decisions.
For your security, all orders are processed on a secured server.
As a Cryptonary Pro subscriber, you also get:
3X Value Guarantee - If cumulative documented upside does not reach 300% during your 12-month membership, you can request a full refund. Terms
24/7 access to experts with 50+ years’ experience
All of our top token picks for 2025
On hand technical analysis on any token of your choice
Weekly livestreams & ask us anything with the team
Daily insights on Macro, Mechanics, and On-chain
Curated list of top upcoming airdrops (free money)
3X Value Guarantee
If cumulative documented upside does not reach 300% during your 12-month membership, you can request a full refund.
Our track record speaks for itself
With over 2.4M tokens and widespread misinformation in crypto, we cut through the noise and consistently find winning assets.
Our track record speaks for itself
With over 2.4M tokens and widespread misinformation in crypto, we cut
through the noise and consistently find winning assets.


Frequently Asked Questions
Can I trust Cryptonary's calls?
Yes. We've consistently identified winners across multiple cycles. Bitcoin under $1,000, Ethereum under $70, Solana under $10, WIF from $0.003 to $5, PopCat from $0.004 to $2, SPX blasting past $1.70, and our latest pick has already 200X'd since June 2025. Everything is timestamped and public record.
Do I need to be an experienced trader or investor to benefit?
No. When we founded Cryptonary in 2017 the market was new to everyone. We intentionally created content that was easy to understand and actionable. That foundational principle is the crux of Cryptonary. Taking complex ideas and opportunities and presenting them in a way a 10 year old could understand.
What makes Cryptonary different from free crypto content on YouTube or Twitter?
Signal vs noise. We filter out 99.9% of garbage projects, provide data backed analysis, and have a proven track record of finding winners. Not to mention since Cryptonary's inception in 2017 we have never taken investment, sponsorship or partnership. Compare this to pretty much everyone else, no track record, and a long list of partnerships that cloud judgements.
Why is there no trial or refund policy?
We share highly sensitive, time-critical research. Once it's out, it can't be "returned." That's why membership is annual only. Crypto success takes time and commitment. If someone is not willing to invest 12 months into their future, there is no place for them at Cryptonary.
Do I get direct access to the Cryptonary team?
Yes. You will have 24/7 to the team that bought you BTC at $1,000, ETH at $70, and SOL at $10. Through our community chats, live Q&As, and member only channels, you can ask questions and interact directly with the team. Our team has over 50 years of combined experience which you can tap into every single day.
How often is content updated?
Daily. We provide real-time updates, weekly reports, emergency alerts, and live Q&As when the markets move fast. In crypto, the market moves fast, in Cryptonary, we move faster.
How does the 3X Value Guarantee work?
We stand behind the value of our research. If the documented upside from our published research during your 12-month membership does not exceed three times (3X) the annual subscription cost, you can request a full refund. Historical context: In every completed market cycle since 2017, cumulative documented upside has exceeded 10X this threshold.
TermsRecommended from Cryptonary


