Save 23% ($351) & Get a Free 1-1 Call with our Team ⏰ : 0d 2h 59m 43s
Hidden patterns that drive Bitcoin price swings
Bitcoin’s price dynamics aren't just about supply and demand—they're intricately linked to behavioural patterns recorded on the blockchain. A new study presented by one of the researchers at Cryptonary reveals how “disorder” in blockchain activity can signal panic selling in the Bitcoin market, tying human sentiment and market trends to the blockchain. Let’s dive in…

Disclaimer: This is not financial or investment advice. You are responsible for any capital-related decisions you make, and only you are accountable for the results.
What is blockchain "disorder"?
Bitcoin’s blockchain is a public ledger that records every single transaction ever made on the network. Each block contains a wealth of transaction data, such as the number of transactions, block size, and timestamp, commonly referred to as on-chain data. This data can be mathematically represented as vectors or arrows. Under normal circumstances, these vectors follow predictable patterns, aligning in similar directions that reflect typical behaviours—such as sending, receiving, and holding Bitcoin. But sometimes, the activity on the network becomes chaotic, which the study calls “disorder.”For example:
- A lot of wallets suddenly empty their funds (maybe whales preparing to sell).
- The number of inputs and outputs in transactions becomes unusually unbalanced.
- The total transaction volume spikes without clear reasons.
Why does this happen?
Think of the blockchain as a reflection of the market’s emotions. When people feel confident, transactions are steady and orderly. But when fear or uncertainty creeps in, their behaviour changes. They might:- Consolidate funds into fewer wallets to prepare for a sell-off.
- Make lots of small transactions to try and avoid losses.
- React to market rumours by moving their Bitcoin quickly.
Key findings from the study
Using concepts from physics and math, the study explored the signals emerging from transactional "disorder" on the blockchain and demonstrated its predictive power for market behaviour. It is astonishing to see that theories from physics and mathematics apply so well to the crypto market. Here are key takeaways:- Disorder predicts price drops: By analyzing a decade of data, researchers found that in 92% of cases, periods of disorder on the blockchain preceded Bitcoin price declines of at least 10% within three weeks. This highlights a strong connection between blockchain chaos and bearish market trends.
- Causality between blockchain and market: Blockchain disorder often reflects irrational behaviour among market participants, which signals the onset of broader market panic. For instance, sudden wallet consolidations or unusual transaction patterns may act as early warnings of sell-offs.
- Practical applications:
- Insights from the study can guide trading strategies by identifying disorder signals as potential market entry or exit points.
- The methodology could also extend to other cryptocurrencies like Ethereum and Solana, where unique transaction patterns might reveal similar market behaviours.
Real-life example: The 2015 flood attack
Let's take one example from the study, which clearly demonstrated the quality of the signal. In July 2015, Bitcoin’s blockchain experienced a surge in unusual activity known as the “Flood Attack.” Thousands of tiny transactions overwhelmed the network, causing chaos. This disorder signalled panic in the market, and shortly after, Bitcoin’s price dropped significantly.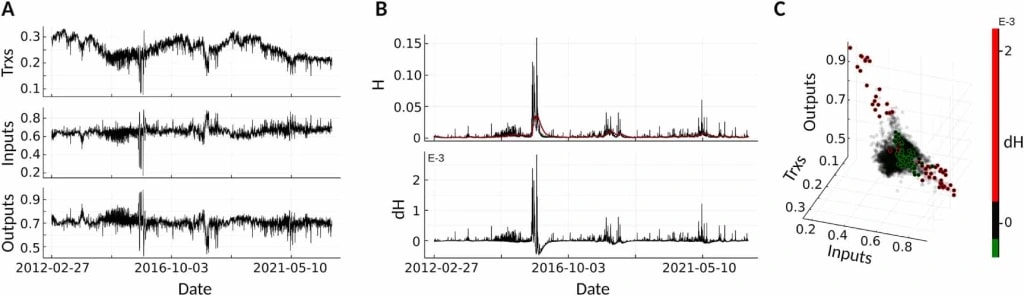
For traders who understood the blockchain’s signals, this would have been a clear warning to exit risky positions or even short the market.
Why does this matter?
This insight is unique to crypto. In traditional finance, we don’t get to see what’s happening under the hood. For example, when a big investor sells millions of dollars of stock, we don’t see the transaction structure—it’s invisible. But in crypto, every movement on the blockchain is public, giving us a huge advantage.By learning to read the blockchain, you’re not just guessing based on price charts or news. You’re using real-time data to understand market sentiment and behaviour. And this is exactly what we are exploring to be able to see market crashes before they happen.
For a more detailed explanation, one of the authors of the study presented this research at the Indonesia Blockchain Week 2024 conference. If you prefer, you can explore video content from this event for further clarity.
Cryptonary’s take
The connection between blockchain activity and market behaviour gives crypto traders a new edge. By watching for patterns of disorder, you can anticipate major market moves before they happen, adjust your strategy, and avoid getting caught off guard.Insights from the study could be applied to develop algorithmic trading strategies, leveraging disorder detection as a signal for market entry or exit. At Cryptonary, we’re taking this to the next level and developing a new set of tools and metrics based on these innovative algorithms and the expertise of top-tier researchers. All of this is to empower you with the most advanced metrics and strategies to navigate the crypto market confidently and have an edge.
You don't want to miss what is coming next...
Cryptonary, OUT!
Reference
Javarone, M. A., Di Antonio, G., Vinci, G. V., Cristodaro, R., Tessone, C. J., & Pietronero, L. (2023). Disorder unleashes panic in Bitcoin dynamics. Journal of Physics: Complexity, 4(4), 045002.Recommended from Cryptonary


