Save 23% ($351) & Get a Free 1-1 Call with our Team ⏰ : 0d 2h 59m 43s
Cryptonary’s Thesis on Concentrated LP: Turning Volatility Into Passive Income
The biggest misconception in crypto is that you need to know where the market is headed to make money. The truth is far simpler: you don’t. When used correctly, market volatility and time become your greatest edge, creating consistent yield while everyone else reacts emotionally. This report shows how this strategy turns that chaos into passive income. LET’S GO!
In this report:
- Introduction: How Markets Operate
- Why Concentrated Liquidity Matters
- How Concentrated Liquidity Works
- Case Study: Spot Holding vs Concentrated Liquidity
- How to Identify High Quality Opportunities
- Psychology and Risk Management for LPs
- Common Mistakes And Best Practices
- Step-by-step Tutorial
- Cryptonary’s Take
Introduction: How Markets Operate
Let’s take a step back and look at how markets usually work. In traditional markets, trading works like a matchmaking service. Buyers and sellers line up with their prices, and the system connects them when both sides agree. Exchanges like Binance and Coinbase use an order book to organise this; a constantly updating list of all buy and sell orders at every price level. When a match happens, the trade is executed. Market makers keep this system alive by placing orders on both sides so there’s always someone ready to trade.Decentralised Finance (DeFi) took a completely different approach. Instead of waiting for two people to meet in the middle, it created a system where you trade directly against a pool of money. This is the Automated Market Maker (AMM). There’s no order book, no matching, no negotiation. Users simply deposit two assets into a smart contract, forming a liquidity pool. The pool then uses a mathematical formula to set prices automatically.
Imagine walking into a shop to exchange money and having to wait for someone who wants the opposite trade, that’s how typically markets work. Now picture a vending machine loaded with two currencies. You put one in, and it instantly gives you the other. The machine adjusts the price based on how much of each currency it has left.
Why Concentrated Liquidity Matters
This shift, from human-driven order books to automated liquidity pools, is what opened the door for the next evolution of market making: concentrated liquidity.At this point, it is common knowledge that the crypto market can be extremely volatile. What appears to be a smooth upward or downward line on a zoomed-out chart is actually made up of violent spikes, sudden pullbacks, and long periods where price whipsaws around the same levels. Most participants either sit in spot waiting for a breakout or jump into leveraged trades trying to capture every move. Both approaches struggle because neither one is aligned with how price actually behaves.
Concentrated liquidity pools solve that mismatch. Instead of providing liquidity across all possible prices (like early AMMs), LPs now choose the exact range where they want to deploy capital. This design assumes that price will move back and forth inside ranges for long periods, and turns that into solid yield.
Liquidity providers do not get paid for predicting direction. Instead, they earn fees from the activity of other traders who swap inside the range. As long as those trades occur within the band the LP has defined, price can rise or fall and the position continues to generate passive income. The same back and forth that frustrates spot holders becomes a source of cashflow for anyone positioned in the active zone.
There is another layer to this design that is often overlooked. A concentrated liquidity position naturally accumulates more of the asset as price moves toward the lower boundary of the range and naturally sells as price approaches the upper boundary. It behaves like a systematic DCA mechanism that buys weakness and trims strength without emotional decision making. This automatic rebalancing gives the model both stability and discipline, qualities that most investors struggle to maintain on their own.
In this scenario, time and volatility are your edge here, where whether prices are going up or down can still keep you in a strong position. Prices go down, you accumulate more of the token you expect to grow in the future. Prices go up, hey, you made money. And as time goes on, your downside gets smaller and smaller, and the upside gets bigger and bigger due to fees/yield accumulated.
Together, these features create a structure that mirrors the rhythm of the market instead of fighting against it. Concentrated liquidity thrives in the environments that dominate crypto, where volatility is constant. It keeps capital productive during the long stretches when a simple buy and hold position would sit idle while still maintaining exposure to the underlying asset.
How Concentrated Liquidity Works
Early automated market makers were built on a constant product formula that required liquidity to cover every possible price from the lowest theoretical value to the highest imaginable one. This design made decentralised trading possible without order books, but it also created a structural imbalance. Most of the capital sat unused at prices that the market would almost never visit. Only a small fraction of the pool supported trades at the live price, which meant depth was thin where traders actually needed it and fee rewards were spread across capital that contributed very little.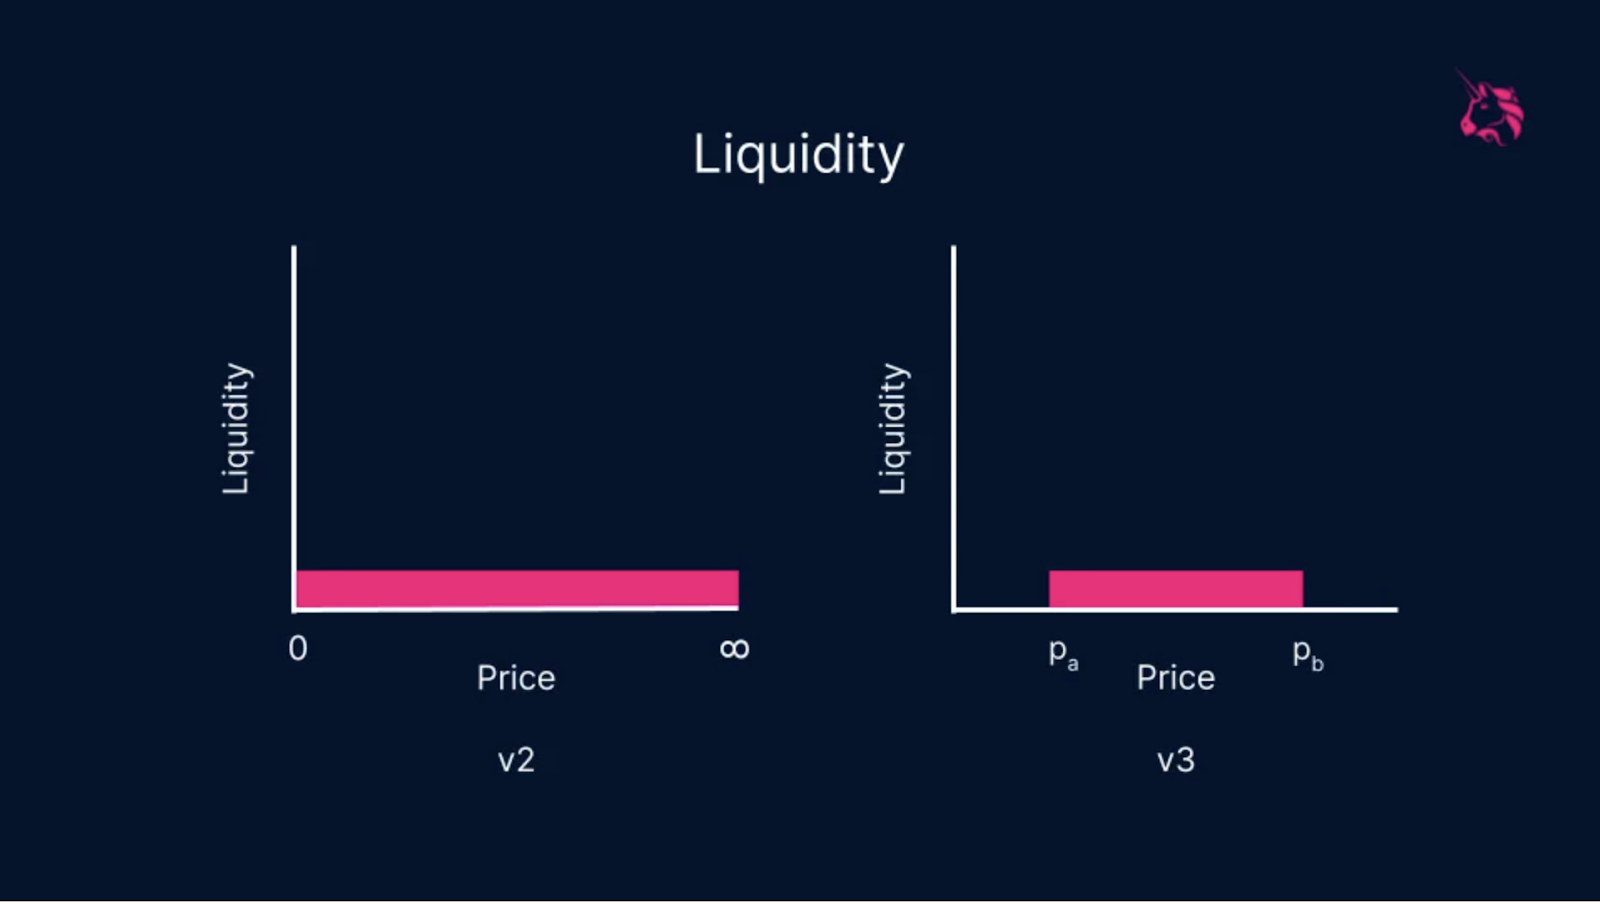
Normal LP vs Concentrated LP
Concentrated liquidity changed that architecture by allowing liquidity to sit only inside a specific price interval. Instead of allocating capital from zero to infinity, an LP chooses the boundaries that define where they are willing to provide liquidity. If the price of an asset is trading near $33 and the chosen range is $28 to $50, the entire position is deployed exactly where trades occur. Nothing is wasted at faraway levels. When price moves toward the lower boundary, the position gradually converts into the base asset (e.g HYPE). When price moves toward the upper boundary, it gradually converts into the quote asset (e.g USDT). While price remains inside the selected range, every trade routes through the LP’s capital and pays fees to the position.You can see this clearly in the way the liquidity band clusters in the $28 to $50 region on the chart. The curve widens exactly where most of the trading activity occurs, and the current price sits inside the same corridor. That visual alone captures the logic of the model. Instead of spreading capital across irrelevant price levels, it is condensed into the zone that the market actually trades through.
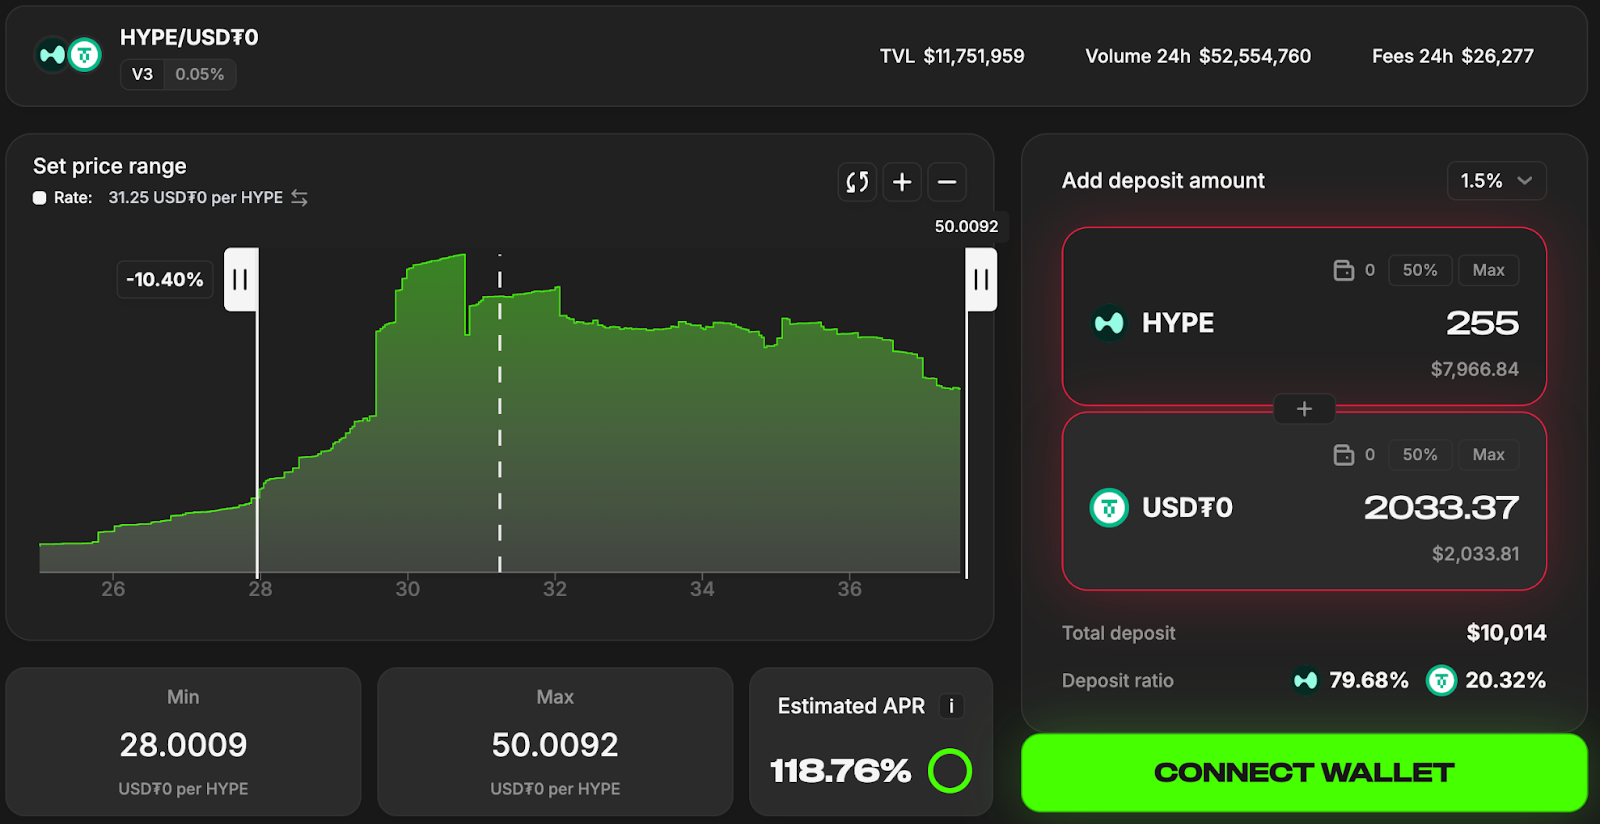
Project X User Interface
The result is significantly greater capital efficiency. A concentrated position with 10,000 dollars inside an active range can offer more meaningful liquidity at the live price than a traditional pool that spreads several times that amount across the full curve. Since only LPs whose ranges include the current price earn fees, the fee share per dollar also becomes much larger. In high volume markets with moderate TVL, this difference is what creates the triple digit APR numbers seen in many modern CLP environments.Concentrated liquidity also introduces a natural feedback mechanism that legacy AMMs never had. As price moves within the band, the position automatically rebalances. It accumulates more of the asset when price approaches the lower end of the range and gradually sells portions of the asset when price approaches the upper end. This behaviour mirrors a disciplined, rules based DCA system that adds during weakness and realises gains during strength. It is an effect built directly into the mathematics of the pool, and it gives the structure a level of mechanical discipline that most investors cannot replicate manually.
Case Study: Spot Holding vs Concentrated Liquidity
The most important question for any investor evaluating concentrated liquidity is simple. What happens if the same capital, in the same market, over the same period, is either held as spot or deployed inside a defined liquidity range. Theory explains why concentrated liquidity should work, but only a direct comparison shows whether it actually does. HYPE provides a useful test case because throughout 2025 it spent long stretches rotating through the same region with sharp rallies that eventually retraced back to familiar levels.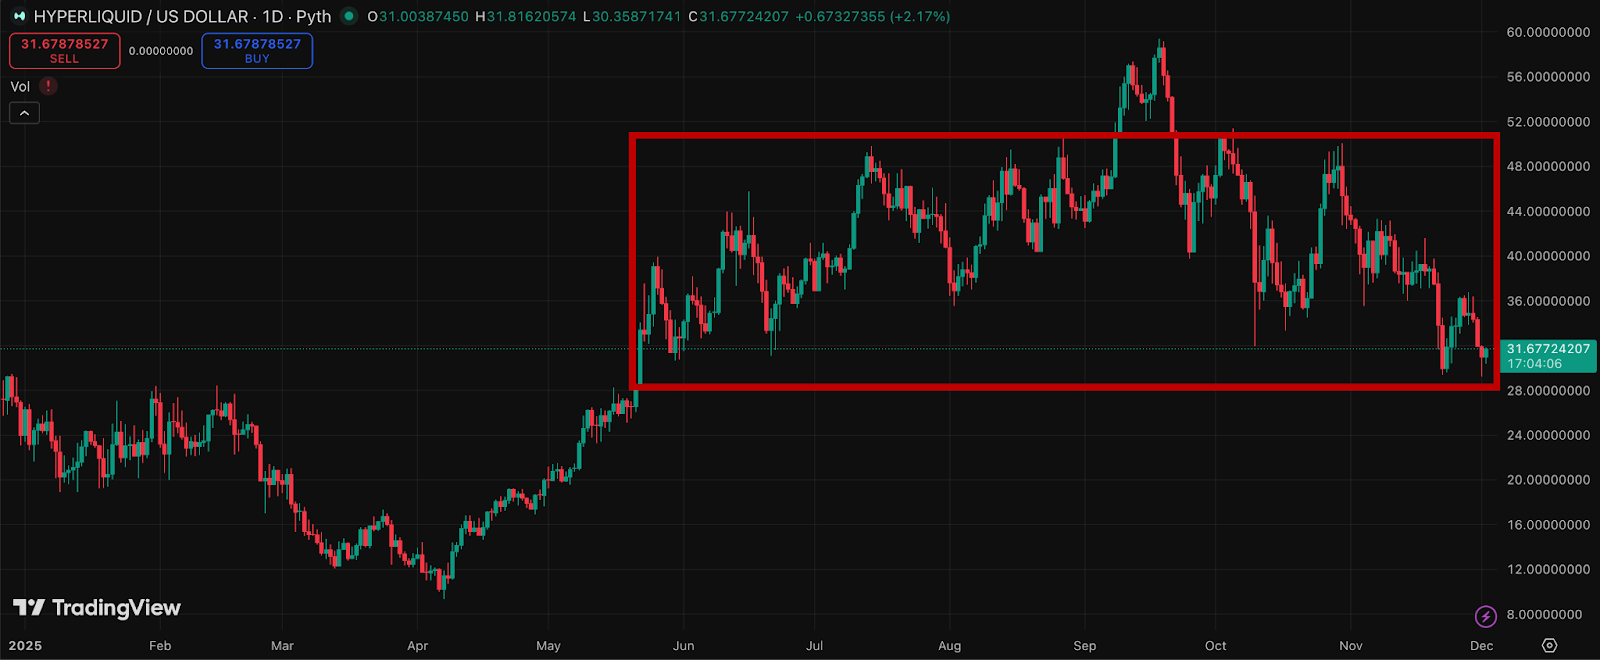
HYPE Price Action
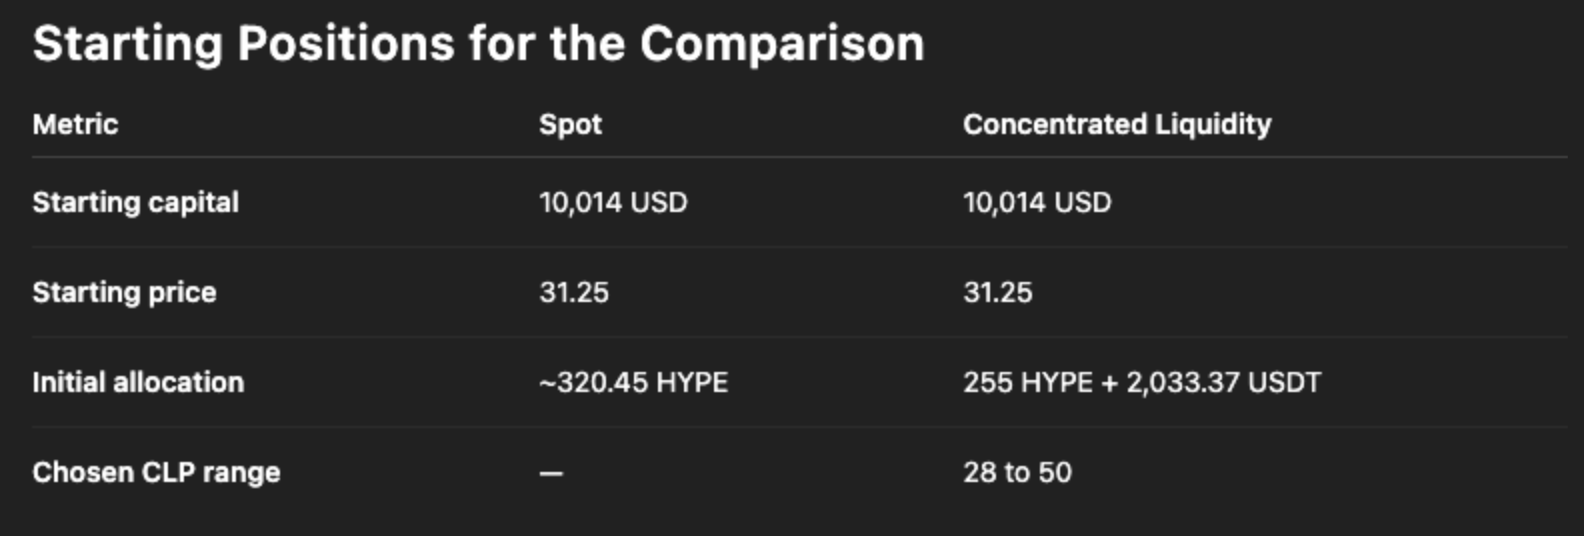
This comparison is built around a window that begins just before June and ends in early December. During this period, HYPE rallies into the high $50s, unwinds almost the entire move, and finishes within a few cents of its starting point. This type of behaviour is common in crypto. It is also the exact type of environment that concentrated liquidity is constructed to monetise. The chosen range of $28 to$ 50 is the region where HYPE traded for most of the year, as illustrated by the chart. Price moved repeatedly through this corridor, generating continuous trading activity that a concentrated position is designed to capture.Before getting into results, it is useful to outline the starting conditions for both positions.
Spot vs CLP: Comparison Table #3
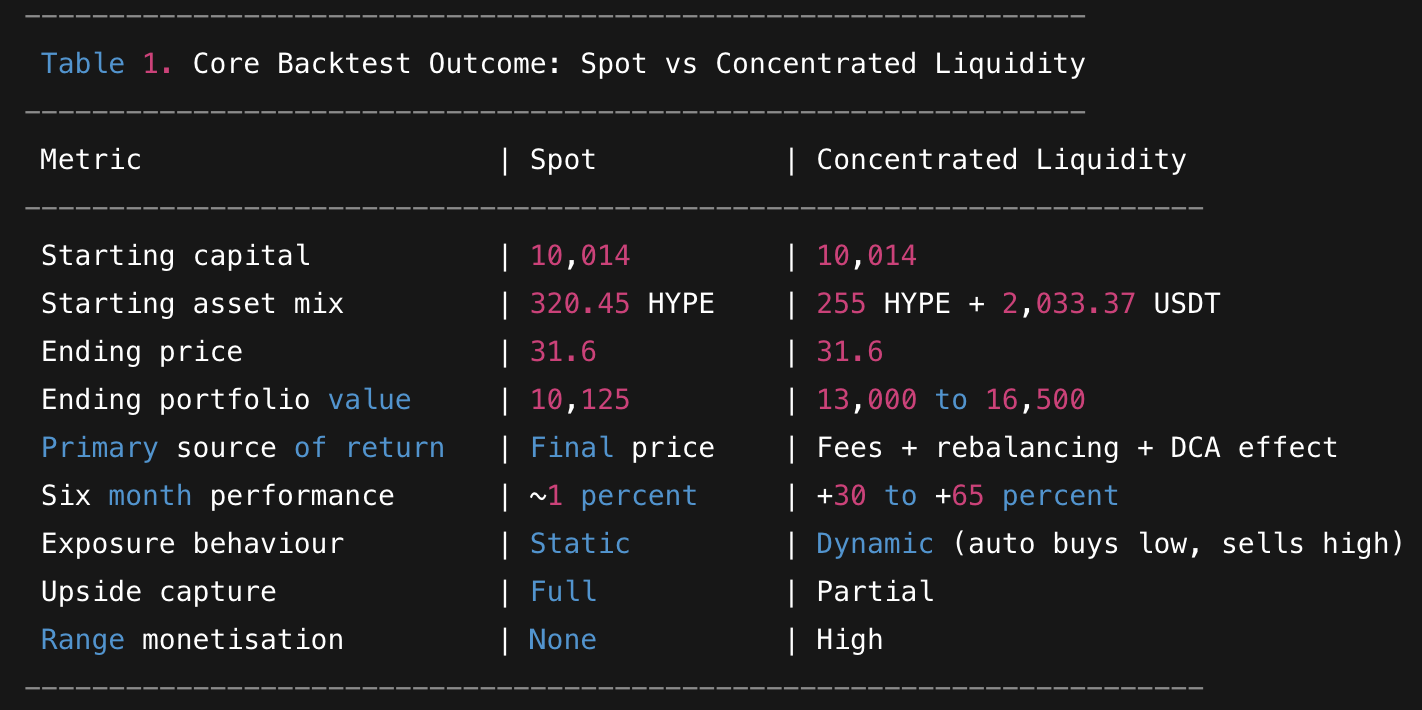
With that structure in mind, the difference between the two strategies becomes clear.- A spot holder allocating slightly more than 10,000 dollars at a price near 31.25 receives roughly 320.45 HYPE. When the period ends with the asset near 31.6, that stack is worth about 10,125 dollars. The investor lived through a full cycle that included violent swings in both directions, yet the total return is barely more than one percent. This is not unusual. Spot exposure captures only the difference between the start and end points, not the movement that occurs in between.
- The concentrated liquidity position begins with the same capital but deploys it as 255 HYPE and 2,033.37 USDT inside the 28 to 50 range. Because this band covers the entire opening region and aligns with where most trading occurred throughout the year, the position remains active for the majority of the window. All swaps inside the band route through the LP’s liquidity and produce fees. The estimated APR for this position while active is about 118 percent! To stay conservative, the assumption is that the position is active for roughly 85 percent of the period, which produces an effective rate near 101 percent for the entire window.
Spot vs CLP: Comparison Table #2
Over a six month stretch, that rate translates to a return of approximately 50 percent with simple interest and around 65 percent with compounding. In dollar terms, the LP collects somewhere between $5,000 and $6,500 in fees during the same window that spot holders earned roughly 125$ in appreciation. This difference shows the benefit of aligning capital with the behaviour of the market rather than the hoped for direction of the market.One structural detail is important here. When a concentrated position rotates fully into the quote asset at the top of the range, it functions as a complete profit taking moment. An LP who wishes to remain out of the market during the retrace can simply stay out of range and hold that profit. In this comparison, the position remained active across the entire cycle to demonstrate how the structure behaves from start to finish. The option to take profit, however, exists in real time for any LP and is something a spot holder does not automatically receive.
Impermanent loss must also be addressed. As price climbed through the $40s and into the mid $50s, the position gradually sold HYPE into USDT, reducing exposure relative to spot. If the breakout had held and price never returned to the band, concentrated liquidity would have underperformed. That is how the structure behaves in clean, uninterrupted trends. But this rally did not hold. The move unwound, price reentered the band, and the position automatically began accumulating HYPE again at lower prices. Because the start and end points of the window are nearly identical, the long term impact of impermanent loss becomes small relative to the fee income.
Spot vs CLP: Comparison Table #3
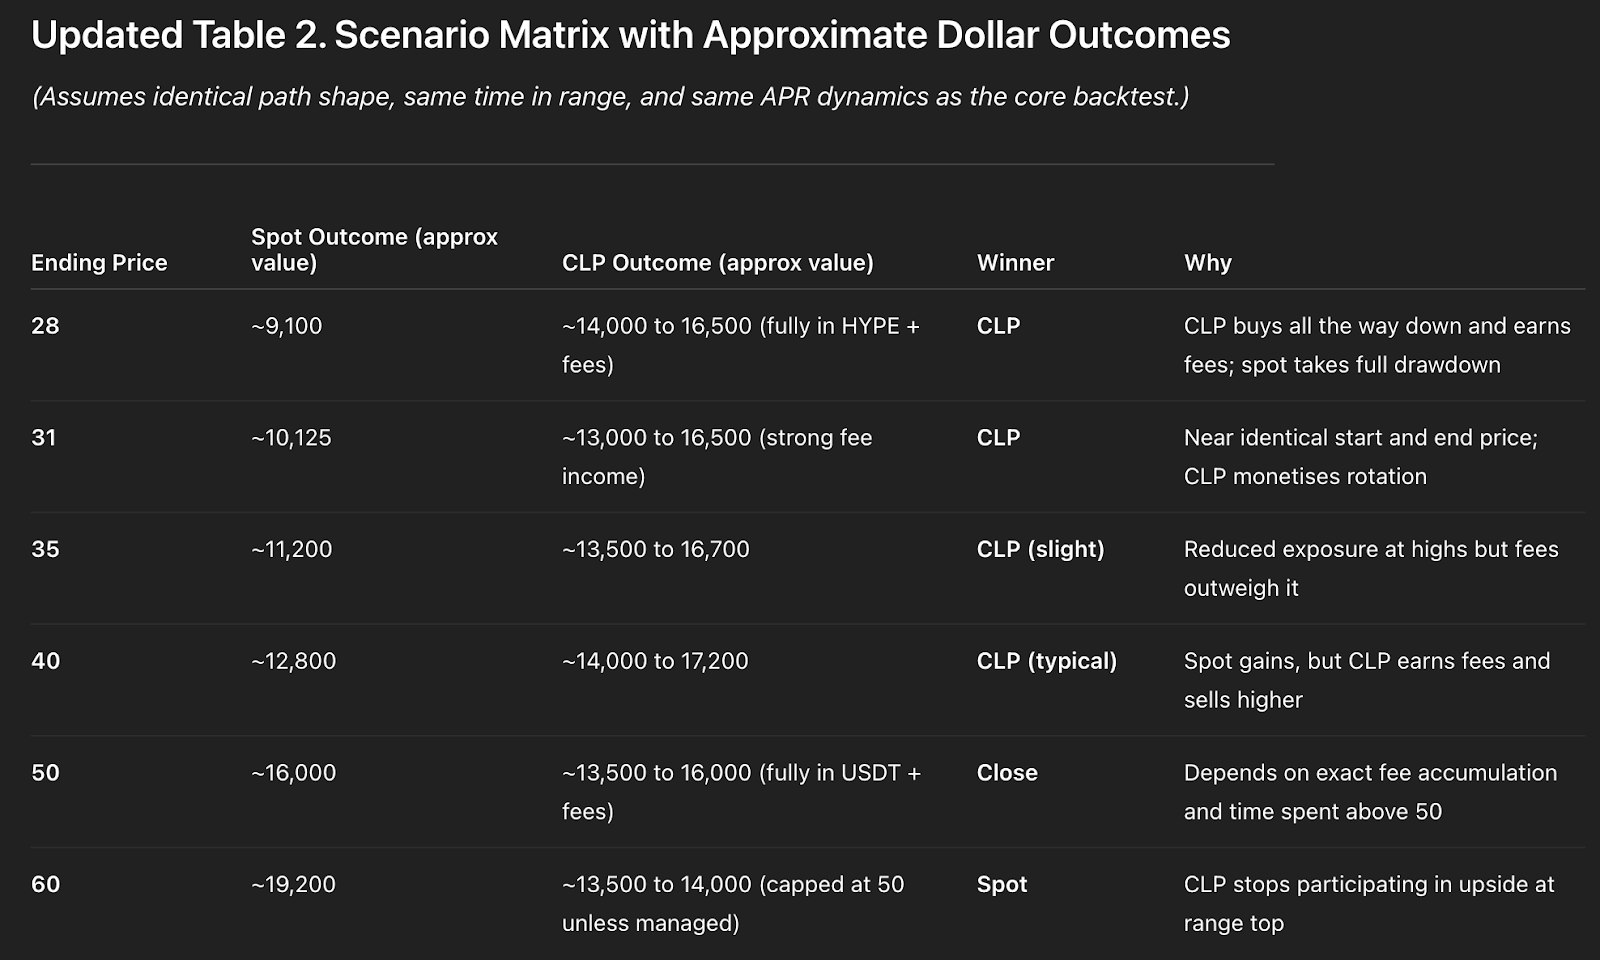
By the end of the period, the concentrated liquidity position is worth somewhere between $13,000 and $16,500 depending on compounding and fee variability. Even the most conservative interpretation places the CLP well ahead of spot. The explanation is straightforward. Price spent most of its time revisiting the same region, generating swaps, and providing repeated opportunities for the LP to earn fees and rebalance efficiently. Spot participated only in the directional component of the path, most of which eventually unwound.This comparison captures the core advantage. In markets where volatility is high, concentrated liquidity monetises the motion that spot holders experience without compensation. It converts repeated oscillations into yield, while spot reflects only the end point of the cycle.
How to Identify High Quality CLP Opportunities
Start With Assets You’re Happy to Hold Long Term
Sometimes the market pulls back harder than expected, and your initial CLP range ends up being too tight. When this happens, your liquidity position becomes out of range, meaning:- You stop earning fees, and
- You become 100% exposed to one side of the pair
Best choices:
- Blue chips (BTC, ETH, SOL, HYPE): deep liquidity, strong narratives, and you can typically hold these assets long term with a piece of mind
- Select high-quality memes (e.g AURA, SPX): These have higher volatility = more fees and yield, but still structurally and narrative-wise strong.
Choose The Ranges Right
Picking the right range is the most important part of concentrated liquidity provision. Your range determines:- how much fees your earn,
- how exposed you become to each asset, and
- how long your liquidity stays active before going out of range. (When you are happy to exit or being fully exposed)
Typically, you need to pay attention to major support and resistance levels where price might react. You can follow our Market Directions for that or the upcoming Market Pulse series where we will share our ranges. Pro subscribers get weekly ranges and pools that our team actively uses.
Additional tip: Platforms with potential airdrops (e.g Project X, Meteora) can offer an attractive bonus to your overall yield, especially if they reward early liquidity providers with tokens or points.
However, these opportunities often come with higher risks, including weaker security, limited audit history, and less proven CLP mechanics. If you’re risk-averse or prefer stable, predictable returns, it’s best to stick to battle-tested platforms like Orca and Uniswap
Psychology and Risk Management for LPs
There are risks to understand. If price leaves the selected range and does not return for a long period, the LP ends up holding only one asset and temporarily stops earning fees. In a sustained one directional trend, simple spot holding can outperform. But crypto does not spend most of its life in clean trends. It spends most of its life revisiting familiar zones, oscillating around key levels, and generating consistent trading activity in relatively tight corridors. Concentrated liquidity is constructed to function inside that environment. It concentrates depth where the market spends most of its time and derives yield from the trading activity that takes place there.This shift from passive, unfocused liquidity to targeted, active liquidity is what makes CLPs fundamentally different from the systems that came before them. It is also what makes them an effective tool for turning volatility into income rather than allowing it to erode returns.
For example, If the price moves outside your chosen range (e.g., SOL spikes to $250), your liquidity stops facilitating trades, and you miss out on fees and end up with either USDC or SOL.
Imagine if you entered the pool at $175 per SOL, and the next week, SOL shoots to $300 in a single weekly candle. You wouldn’t enjoy the upside fully because you DCAed out fully by SOL reaching $200 to USDC. This is called impermanent loss—despite being profitable in dollar terms, your position might be worth less than if you’d just held SOL in this period. Despite high APY collected in USDC and SOL, the fees collected in just 1 week won’t be enough to cover missed capital gains.
Additionally, the tighter the range, the more fees you collect (higher APY), but the higher the possibility of you going out of the range and having impermanent loss. The wider the range, the fewer fees you collect, but a lower possibility of going out of the range and having impermanent loss
Mitigation strategy: The art here is to find a perfect balance between high APY and the width of the range so that you earn maximum fees and stay in range for a prolonged enough time. This comes with the understanding of the market trends and where the asset is likely to go next or chop around. You can have a good sense of this over time if you read our Market Directions and Market Update reports.
Also, it is important to think about what levels you would be okay with 100% of your position in SOL, and at what price you would be okay selling all your SOL to USDC. If the price goes to a lower band, congrats, you have accumulated more SOL as an investment for the future. If the price goes to the upper band, congrats, you have taken profits at the level you wanted to exit.
Balancing these two things can help you choose the right range, or you can just follow us for ranges we think are the most appropriate, depending on the market.
Common mistakes and best practices
Here are some mistakes that users generally make when starting their journey with liquidity poolsPanicking when out of range
If an asset's price moves outside your chosen range, your position stops earning fees for a bit. It's easy to think, "Oh no, I chose the ranges wrong, I will pull out my liquidity now!"If you stay in the pool, the price can swing back into your range, and your position will start earning those sweet fees again. For example, let’s say you set a range for SOL-USDC pool at $120–$180, but SOL drops to $100. At that point, your position might be 100% in SOL.
Don’t stress! SOL is a blue-chip asset in the crypto world, and prices often bounce back after some market chop. When SOL climbs back into your $120–$180 range, your position reactivates, and you’re back to collecting yield like a pro. By staying patient, you’re not only holding a solid asset but also setting yourself up for more passive income when the market moves in your favour.
Setting Ranges Without a Plan
One of the most important things with CLP is to choose ranges correctly. Many do it wrong. Choosing a price range is like picking the perfect spot to fish; you want to be where the action is! Setting a range that's too tight (+-5% from the current price) might boost your APY, but it increases the chance of slipping out of range quickly. On the flip side, a super-wide range might keep you in the game longer, but could mean lower fees. Finding the sweet spot takes a bit of thought.Less is more. Optimise your range for longevity and align it with your comfort zone. Ask yourself: "At what price would I be happy holding 100% SOL/HYPE/ETH for future growth? At what price would I feel great locking in profits with 100% USDC?" For example, if you're cool with owning SOL at $150 and taking profits at $200, set your range around those levels. If you keep getting in and out of the ranges, that will incur additional liquidity, trading fees that hurt your profitability. That is why enter with an aim to be in a pool as long as possible.
How to earn passive income with concentrated pool (Example of SOL-USDC)
- Step 1: Set Up a Solana Wallet
- Download non-custodial wallets like Phantom
- Fund the wallet with SOL and USDC via exchanges (e.g., Coinbase, Binance, etc).
- Step 2: Go to a DEX
- Go to ORCA and connect your wallet
- Step 3: Provide Liquidity
- Select the SOL-USDC pool, and choose a price range (e.g $120-$160; for more up-to-date ranges follow our weekly market pulses).
- Deposit SOL and USDC depending on the range
- Confirm transaction (low Solana fees ensure affordability).
- Step 4: Earn and Monitor
- Earn trading fees paid in USDC and SOL
- Enjoy passive income and yield
Cryptonary’s Take
CLP is one of the best opportunities the market has ever offered retail investors. What was once reserved for institutions, market makers, and insiders is now accessible to anyone.It remains one of the most overlooked and misunderstood strategies in crypto, and one of the few where you don’t need to predict market direction to steadily earn over time.
The best part is that the market can actually work in your favour: the longer price stays within your range, the more fees you collect, allowing time to compound returns and naturally soften sharp moves.
But choosing ranges right that work best is important. Cryptonary Pro subscribers receive updated pool ranges every week, along with full transparency on the pools we’re in. If you want that same edge, it’s time to upgrade to Cryptonary Pro.
Cryptonary, OUT!
Recommended from Cryptonary


