Save 23% ($351) & Get a Free 1-1 Call with our Team ⏰ : 0d 2h 59m 43s

Disclaimer: Not financial nor investment advice. Only you are responsible for any capital-related decisions you make and only you are accountable for the results.
Anyone who was around for the 2017 bull-run has December engrained in their heads. It was the single best performing month for Altcoins as a whole. Let’s look at some examples:
- ETH: +300%
- XRP: +1,360%
- LTC: +340%
- ADA: +1,725%
- BNB: +1,240%
These are random examples in no particular order just to illustrate the performances.
In this case-study, we’re going to take a look at the historic performance of Altcoins as a whole at the end of the year.
We’ll separate market trends into two categories: bullish & bearish and we’re going to only consider the months of December where the overall preceding trend was bullish (higher lows and higher highs) no matter how small/shallow the advances are, because this is the market structure we are currently in.
The data will be taken from CoinMarketCap’s Altcoin MCap chart for a fair average with a long history.
2013
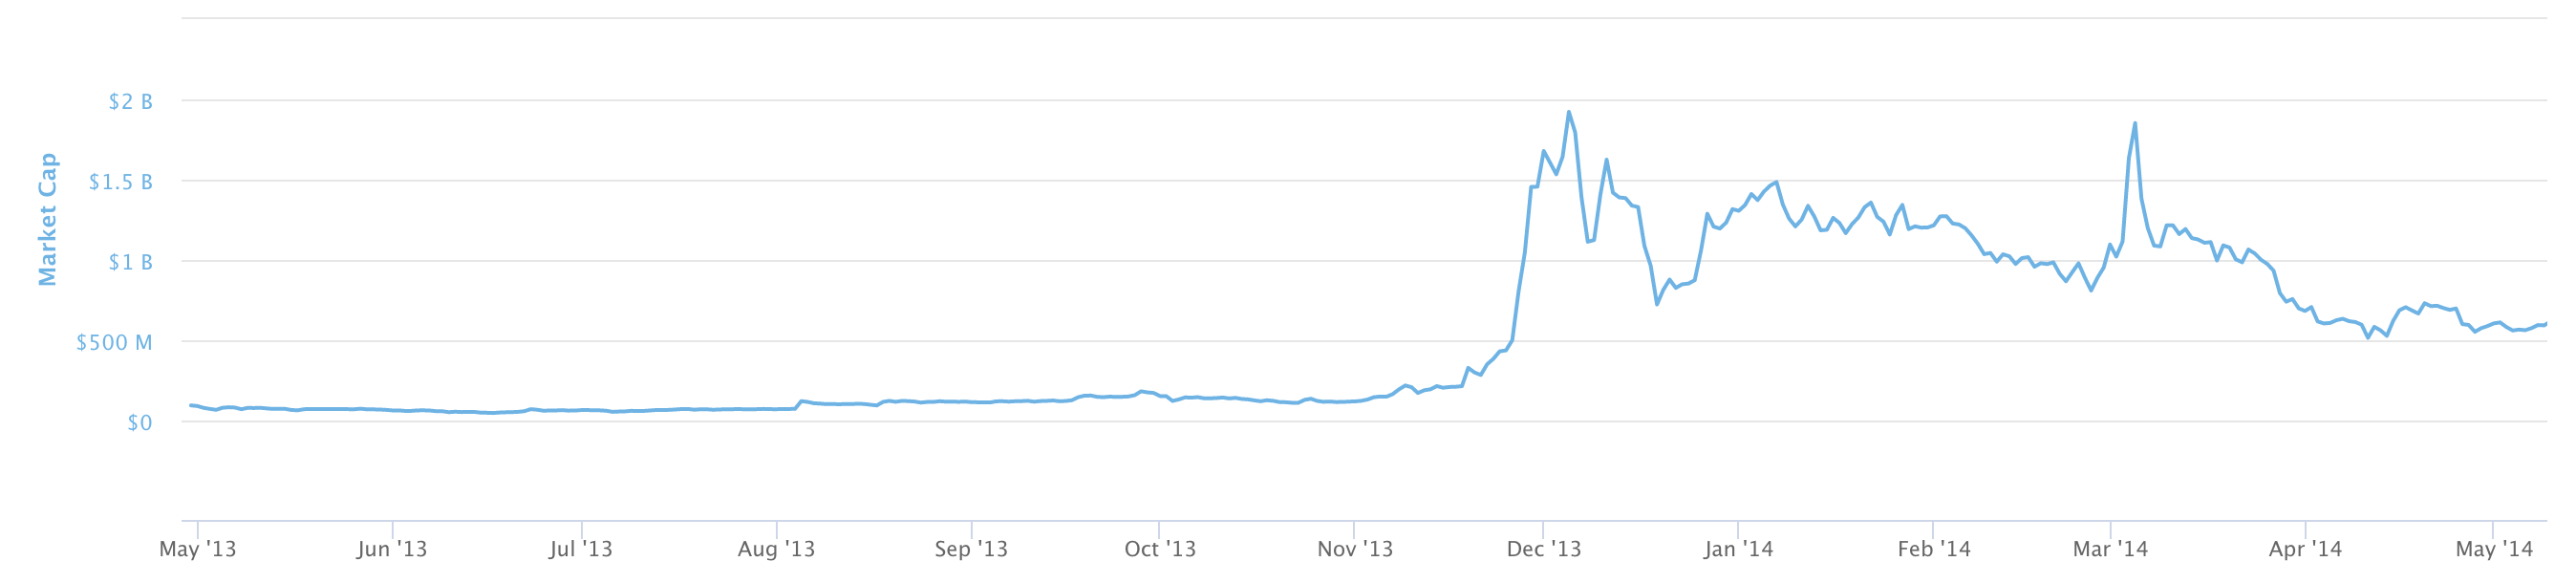
This is the Altcoins Market Cap in 2013, a clear and significant rally took place in November (+1,230%). Given the meteoric rise, not much was left for December in that year and price stagnated for the remainder of the year.
Given the magnitude of the run, in a bullish market structure, it does count as an end of year rally.
2014
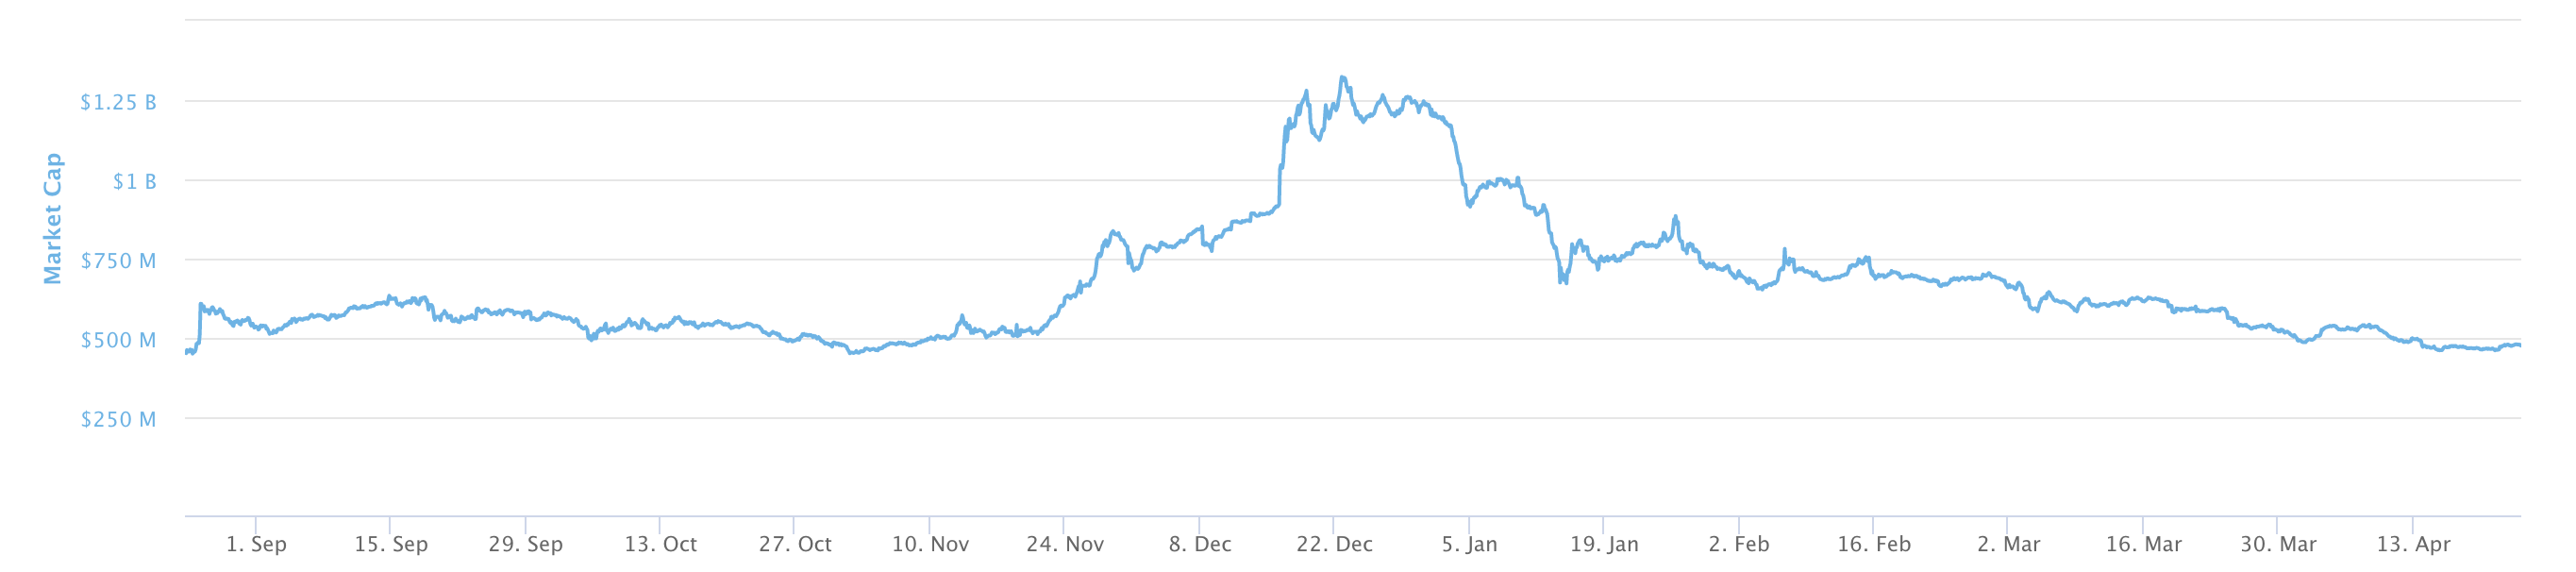
In 2014, a primary price rally began in November (+67%) which was then followed by a second rally in December (+84%) from start to peak.
2015
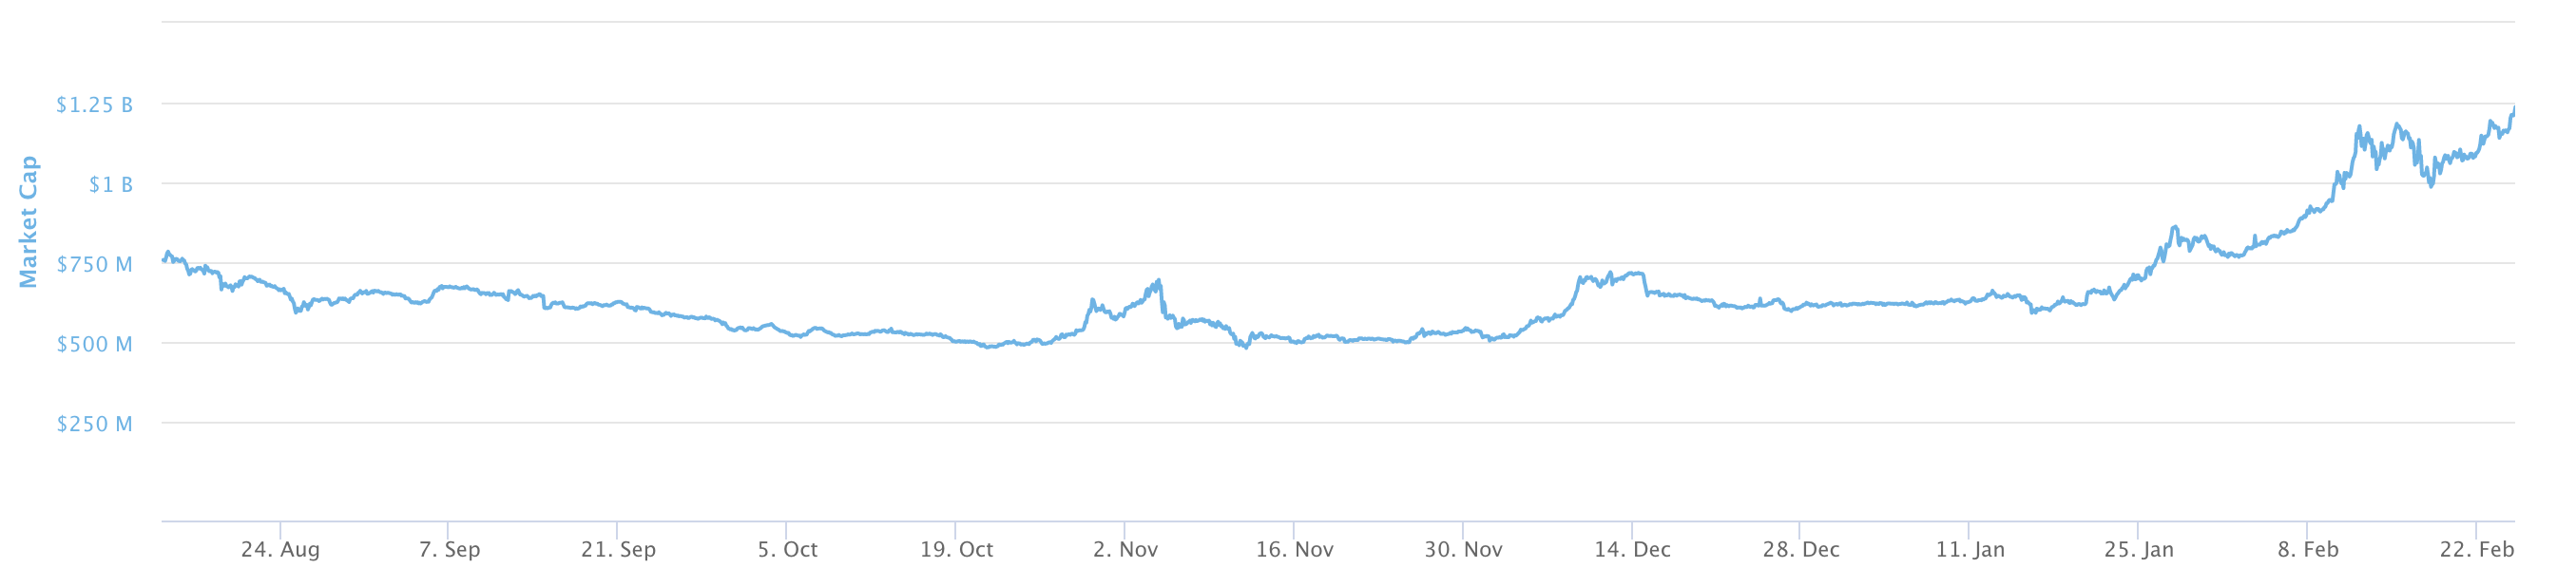
2015 was the year when Bitcoin was just starting to bottom out and getting prepared for the parabolic rally from $250 to $20,000. In December 2015, Altcoins saw a reasonable increase of +35% from start to peak.
2016
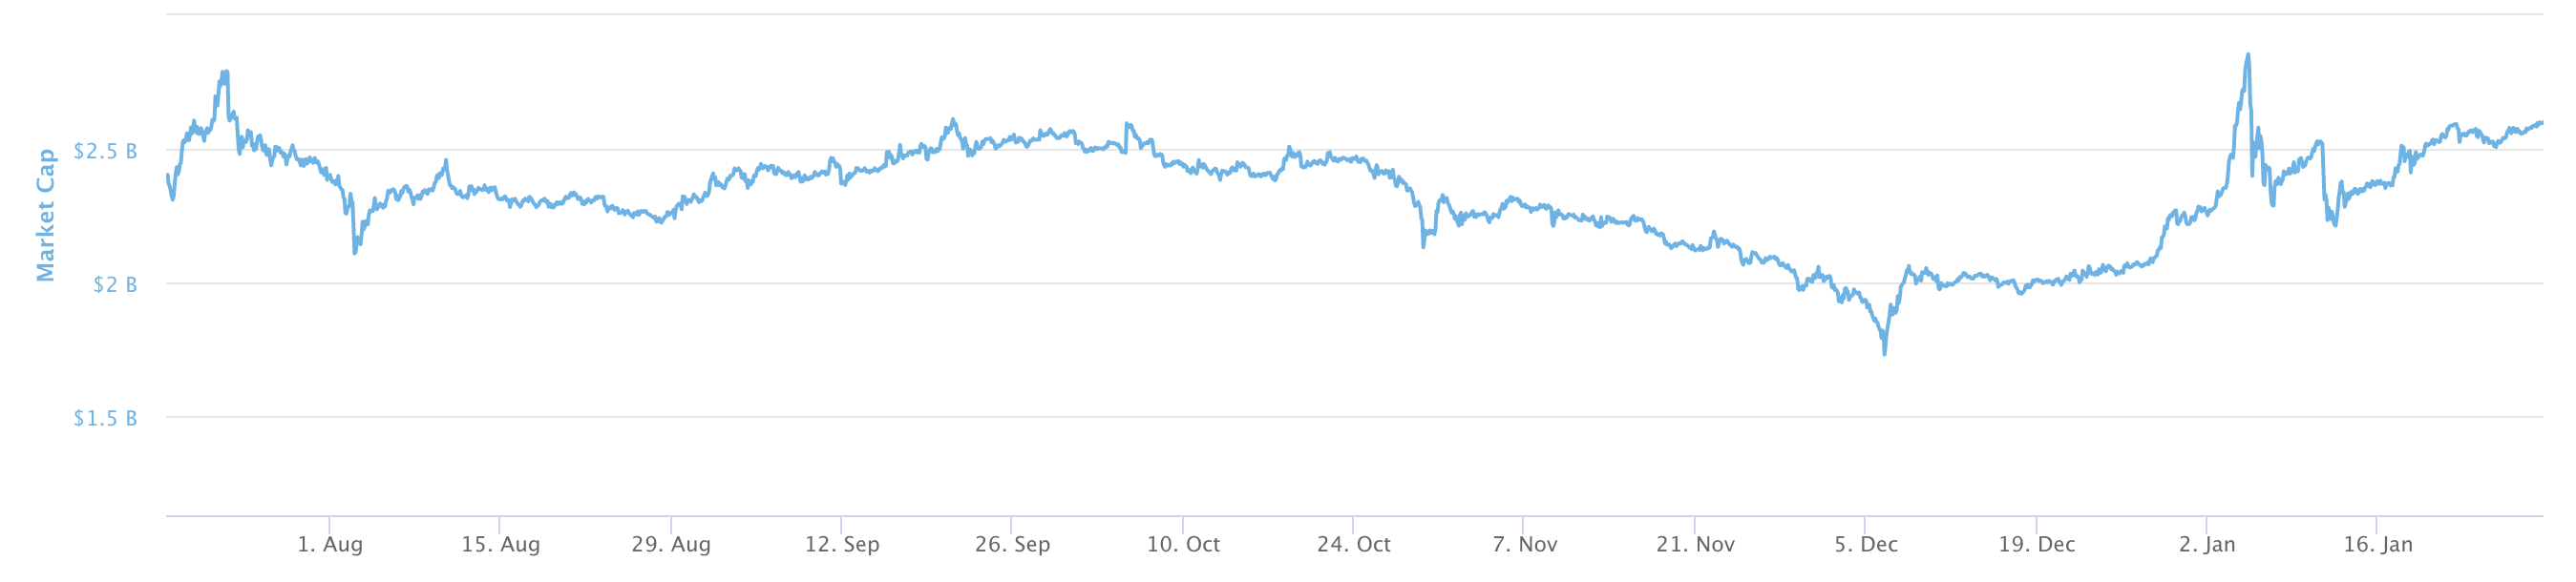
Another reasonable month for Altcoins, with a +15% increase. This is the era when more projects were being injected into the market.
2017
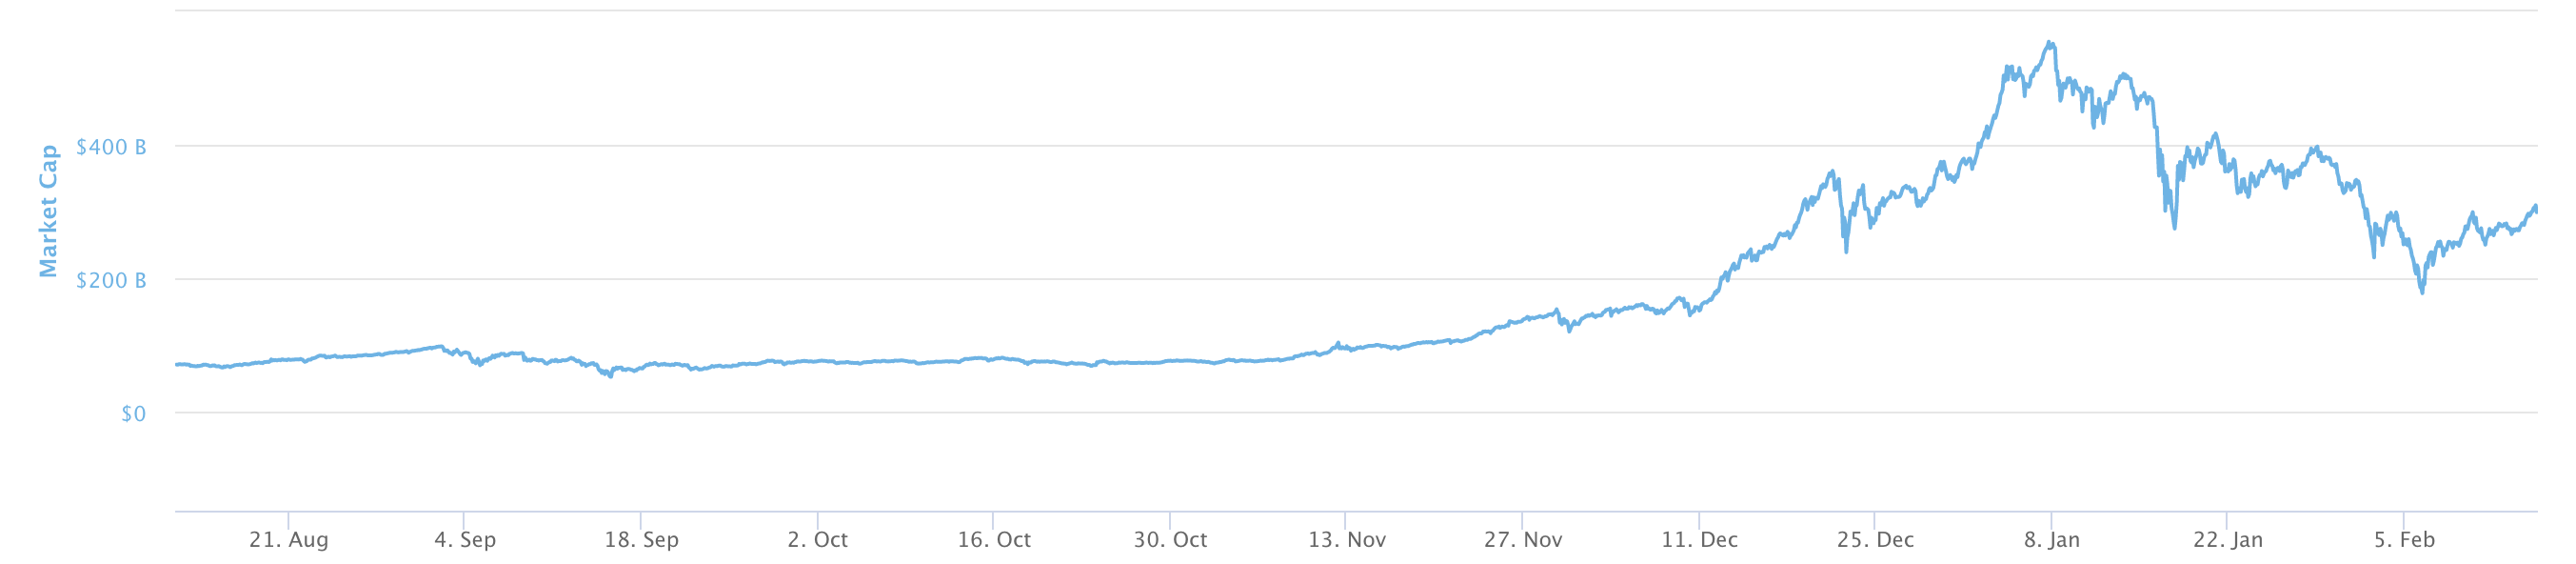
The magical 2017 bull-run, 185% in December 2017 on Altcoins. This may seem like a small figure given the numbers we stated at the start of the journal; this is because not all assets perform the same and this is an average.
2018 & 2019
Neither 2018 nor 2019 had a bullish market structure consisting of HHs and HLs in the last quarter. Despite that, these were the performances:
- 2018: +0%
- 2019: -9%
Statistics Summary
|
December Performance | |
|
2013 |
-20% (November +1,230%) |
|
2014 |
84% |
|
2015 |
35% |
|
2016 |
15% |
|
2017 |
185% |
The month of December has statistically served Altcoins well, now let’s take a look from a fundamental perspective.
Fundamentals: Retail & Institutions
Institutions have deployed the majority of their capital into Bitcoin, there will be other assets into which they deploy capital; in fact they’ve started doing so into a particular one (Research Report incoming), but for now their presence in Alts is minimal.
Who dominates Alts? Retail until now.
Bitcoin has had an immense run in a few short weeks, ranging here without any major movements ($5k/6k+) is probable, especially with the fact that holidays are incoming and traditional trading desks (institutions) close.
This leaves retail traders with a highly priced, stable Bitcoin and an empty scene to trade Altcoins, which is what historically led to an "Alt-Season".
Conclusion
This mixture of statistical evidence and fundamental reasoning may set the stage up for Alts to pull a decent performance this month (50-100%); that is our theory and the facts backing it.
BUT, the best is yet to come. The effect of institutional investors will show up on certain Altcoins in 2021.
You know how Bitcoin went through a “vertical accumulation”? It'll soon start happening on another one 🚀
(more info is coming in due time)
Disclaimer: NOT FINANCIAL NOR INVESTMENT ADVICE. Only you are responsible for any capital-related decisions you make and only you are accountable for the results.
Recommended from Cryptonary


