Save 23% ($351) & Get a Free 1-1 Call with our Team ⏰ : 0d 2h 59m 44s

GMX
Similar to Gains Network, it offers leverage trading on various assets, except it operates on Arbitrum and Avalanche. Traders can use up to 50x leverage, which can amplify both gains and losses; it is suitable for experienced traders looking for high-risk, high-reward opportunities.
The generated fees are distributed as ETH and AVAX on Arbitrum and Avalanche, respectively. This is in stark contrast with Gains, where fees are used to buy back the GNS tokens.
This approach allows investors to earn blue-chip assets that are less likely to be subject to market volatility.
However, similar to GNS, the supply of GMX is fully unlocked, making this asset quite appealing from an investing perspective.
Let's look at numbers and explain why we think it is undervalued.
Disclaimer: This is not financial or investment advice. You are responsible for any capital-related decisions you make, and only you are accountable for the results.
Investment thesis
- Fully diluted mcap: $237m
- Revenue generated in the last 12 months: $7.6m
- P/E ratio: ~30 (~10 based on recent earnings data)
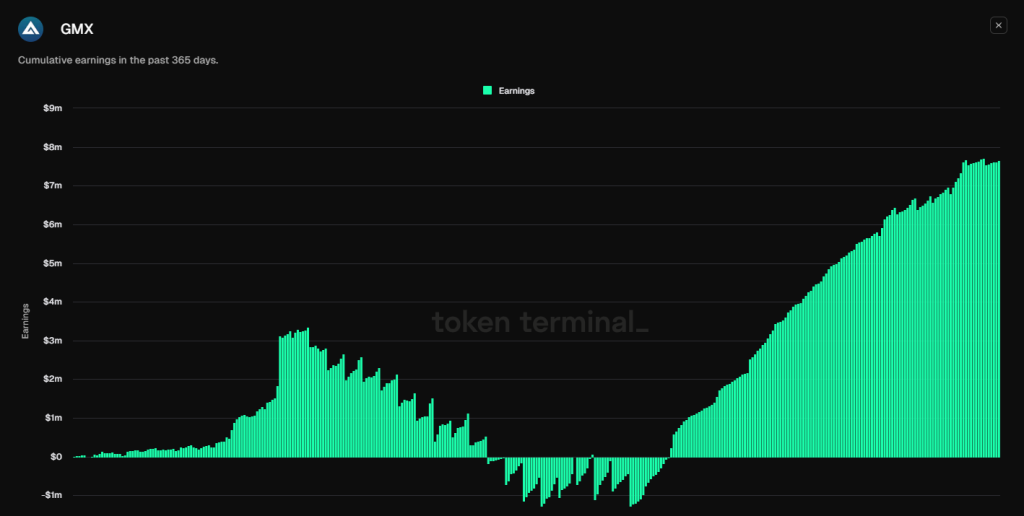
Up until April, GMX was barely profitable as a platform. However, from April, it started making money and generated a solid $9m in earnings, which is $21.6m annualised.
Comparing market cap and annual earnings gives an approximate P/E ratio of 10, which is quite solid from a value investing approach.
Moreover, since March/April (when GMX finally started being profitable), the market has cooled down and been range-bound. We are yet to see how much money GMX can make for its stakers in better market conditions when things are overheated.
Therefore, we remain optimistic that when attention switches back to DeFi, and BTC breaks its range, we can expect increased volume and earnings.
$GMX technical analysis
When analysing GMX on the weekly timeframe, we can see a consistent bullish structure characterised by higher highs and higher lows, as denoted by the red dots on the chart. This pattern has been established over a significant period, demonstrating GMX's strength and resilience in the market.Higher-highs and higher-lows
From June 2022 to April 2023, GMX experienced an impressive 680% rally, propelling the coin to a higher high of $90. This significant move highlighted GMX's potential and placed it firmly on the radar of long-term investors. However, after reaching the $90 mark, GMX has been consolidating within a large wedge pattern on the weekly timeframe.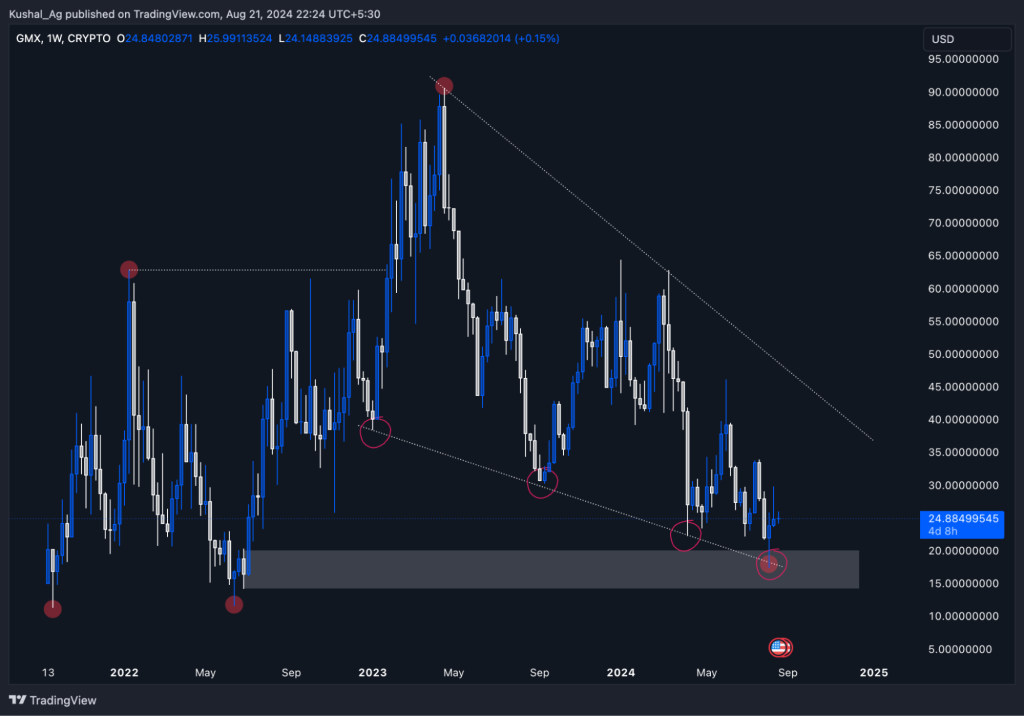
Wedge formation
The wedge pattern that GMX is currently trading within is critical for its long-term outlook. A breakout from this wedge, particularly on the upside, could trigger a substantial rally, aligning with the previous bullish trends observed in GMX. This pattern is essential for traders and investors as it could signal the next major move for GMX.Demand zone and support levels
Currently, GMX has mitigated its weekly demand zone, which is marked by a grey box on the chart, ranging from $14 to $20. This zone coincides with GMX taking support at the lower end of the wedge pattern.Historically, the price has bounced strongly and quickly whenever it has touched the lower boundary of the wedge, as marked by the red circles on the chart. This marks the fourth time GMX has touched this critical support level, making it a significant area of interest for potential bullish reversals.
Key levels to watch
- Demand zone: $14 - $20 is a critical support area. Given the historical bounces from this level, it is a strong area for potential accumulation.
- Upside potential: If GMX continues to hold this support level and the wedge breaks on the upside, a push towards $40 is anticipated. This target aligns with the previous price actions and could be a key resistance area in the near term.
Conclusion
GMX is at a pivotal point on the weekly timeframe. The ongoing wedge formation and the significant demand zone between $14 and $20 presents a strong case for a potential bullish reversal.If the price manages to break out of the wedge on the upside, GMX could see a substantial move, possibly targeting the $40 level in the near term.
Investors and traders should monitor these key levels closely as they could dictate the next major trend for GMX.
GMX is a solid perps platform that recently became profitable. However, many people are overlooking its cash flow potential. The yield is paid out in ETH and AVAX, which makes it very attractive if you intend to earn a passive income.
Recommended from Cryptonary


