Save 23% ($351) & Get a Free 1-1 Call with our Team ⏰ : 0d 2h 59m 44s

Gains Network
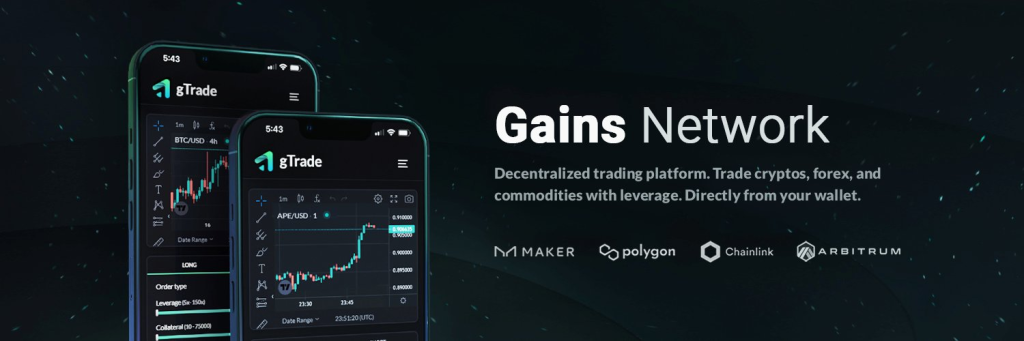
Gains Network operates on both the Polygon and Arbitrum networks, focusing on providing a liquidity-efficient, user-friendly, and powerful decentralised leveraged trading platform.
It is designed to offer users up to 150x leverage on cryptocurrencies, 1000x on forex, and significant leverage on stocks and commodities, making it one of the most aggressive leverage options in the DeFi space.
The Gains Network token (GNS) serves as both a governance and revenue-sharing token. Recently, the DAO implemented Buyback & Distribute tokenomics, where 90% of fees are distributed to stakers.
With a fully circulating supply and no insider unlocks pending, the investment case for Gains Network is strong.
Now, let's examine why we think it is undervalued based on the revenue the platform is generating.
Investment thesis
- Fully diluted mcap: $87m
- Revenue generated in the last 12 months: $30m
- Price-to-Earnings (P/E) ratio: ~3
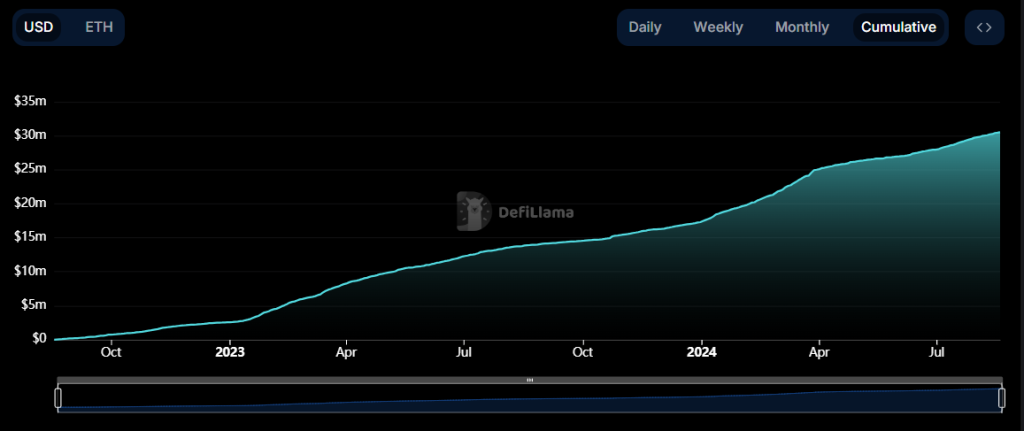
That gives a price-to-earnings (P/E) ratio of roughly 3. For assets in the application layer (apps) in crypto, we usually consider a P/E ratio below 10 to be undervalued.
For comparison, the P/E ratio of the S&P 500 (an index generally considered a benchmark for capital markets) is 27.45 as of the time of writing. Historically, the S&P 500's P/E ratio has never been below 5, even in times of economic crises, recessions, depressions and global uncertainty.
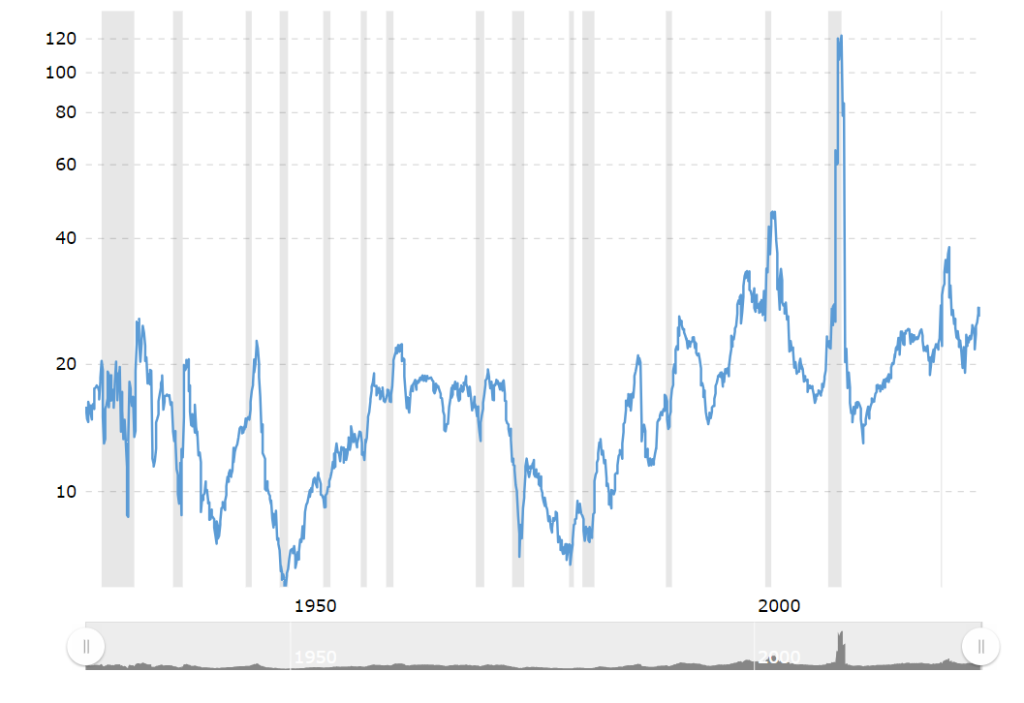
Thus, using this benchmark, there is a strong case for the asset with a P/E ratio that is below 10 to be undervalued in bull markets.
With a P/E ratio of 3, the current market price suggests that the asset is generating earnings at an exceptionally high rate relative to its valuation. This means that for every dollar invested, you're effectively capturing a significant portion of the network's revenue stream.
Since 90% of these earnings are distributed to stakers, the dividend yield alone is substantial, offering investors a steady income far exceeding traditional returns. This high yield indicates that the market has likely undervalued GNS, possibly due to underappreciation of its earnings stability or growth potential.
Even if the market price remains unchanged, the ongoing revenue distribution positions you to earn a significant return on your investment. And if the market eventually recognises the true value of GNS, there's considerable upside potential as the price adjusts to reflect its strong fundamentals and earnings power. This isn't just about potential price appreciation—it's about capturing a high, consistent return from an asset that the market has yet to fully value
Of course, this has several assumptions, such as volume and price not dropping as we go. However, even if we include some margin of safety and double the ratio to 6 or even triple it, it is still lower than 10 and significantly lower than S&P's multiples.
Thus, GNS remains undervalued, and when the macro environment improves, and investors switch to higher-risk opportunities, the market is likely to reprice the asset.
In the meantime, let's turn to technical analysis to determine the short-term odds.
$GNS technical analysis
In the context of the broader altcoin market, which has been underperforming for some time, analysing Gains Network ($GNS) on the weekly time frame provides a more comprehensive outlook. The weekly chart offers a clearer long-term perspective, reducing the noise and bearish bias that might dominate shorter timeframes.Higher-highs and higher-lows
GNS has maintained a bullish structure on the weekly chart, characterised by a series of higher highs and higher lows. This structure is clearly denoted by the red dots on the chart, which highlight significant swing points in the trend. The most recent red dot around the $2.11 level indicates a critical area of interest as it aligns with a key demand zone.
Demand zone analysis
The demand zone currently being mitigated is significant, formed in September 2022. This zone is represented by the grey box on the chart, stretching from approximately $1.28 to $3.00. This zone is significant because it was the area from which GNS launched an impressive 800% rally, reaching a high of $11.8 in February 2023.The latest price action has seen GNS revisit this demand zone after a bearish phase in August 2023, when it moved within a bearish channel and eventually broke lower. The fact that GNS is testing this zone again, with the broader market potentially setting up for a bullish move, suggests that GNS is poised for a potential reversal and upward movement from this area.
Key levels to watch
- Demand zone: $1.28 - $3.00 is the key accumulation zone. This is where bids should be layered for potential long positions, as this zone has historically acted as a launchpad for significant price rallies.
- Critical resistance: A break above $4.60 is crucial for flipping the lower timeframe structure bullish. Clearing this level would signal a stronger reversal and continuation of the bullish trend on higher time frames.
Conclusion
GNS, on the weekly timeframe, is testing a crucial demand zone that has historically led to significant bullish moves. With the broader market conditions potentially aligning for a bullish reversal, GNS is positioned for a possible upward movement.Investors should watch the $1.28 - $3.00 zone closely for entry opportunities and monitor the $4.60 level for a confirmed bullish flip on lower time frames.
Gains Network has great tokenomics with clear value accrual. A P/E ratio of 3 is extremely attractive as a cash flow play. Young Warren Buffet and Shark Tank investors would hunt for this kind of investment.
Even though we understand the nuance of crypto markets where attention decides an asset's performance, this is too good of an opportunity to ignore.
Disclaimer: This is not financial or investment advice. You are responsible for any capital-related decisions you make, and only you are accountable for the results.
Recommended from Cryptonary


