Log in

Save 35% ($551) & Get a Free 1-1 Call with our Team ⏰ : 0d 2h 59m 44s

Home
Research
Analysis
Community
  1. Cryptonary
  2. Research
  3. Guide: The RSI Indicator
Education

Guide: The RSI Indicator

Updated: Jul 30, 2024
Published: Apr 7, 2021
0
Share:

Whenever a new entrant begins their trading journey, they will be flooded with information about technical indicators and acronyms. They're often told something along the lines of "This is the secret to trading".

Post Feature Image

NEWS FLASH: It is not.

Technical indicators are useful when properly applied but should not be used on their own to make decisions.

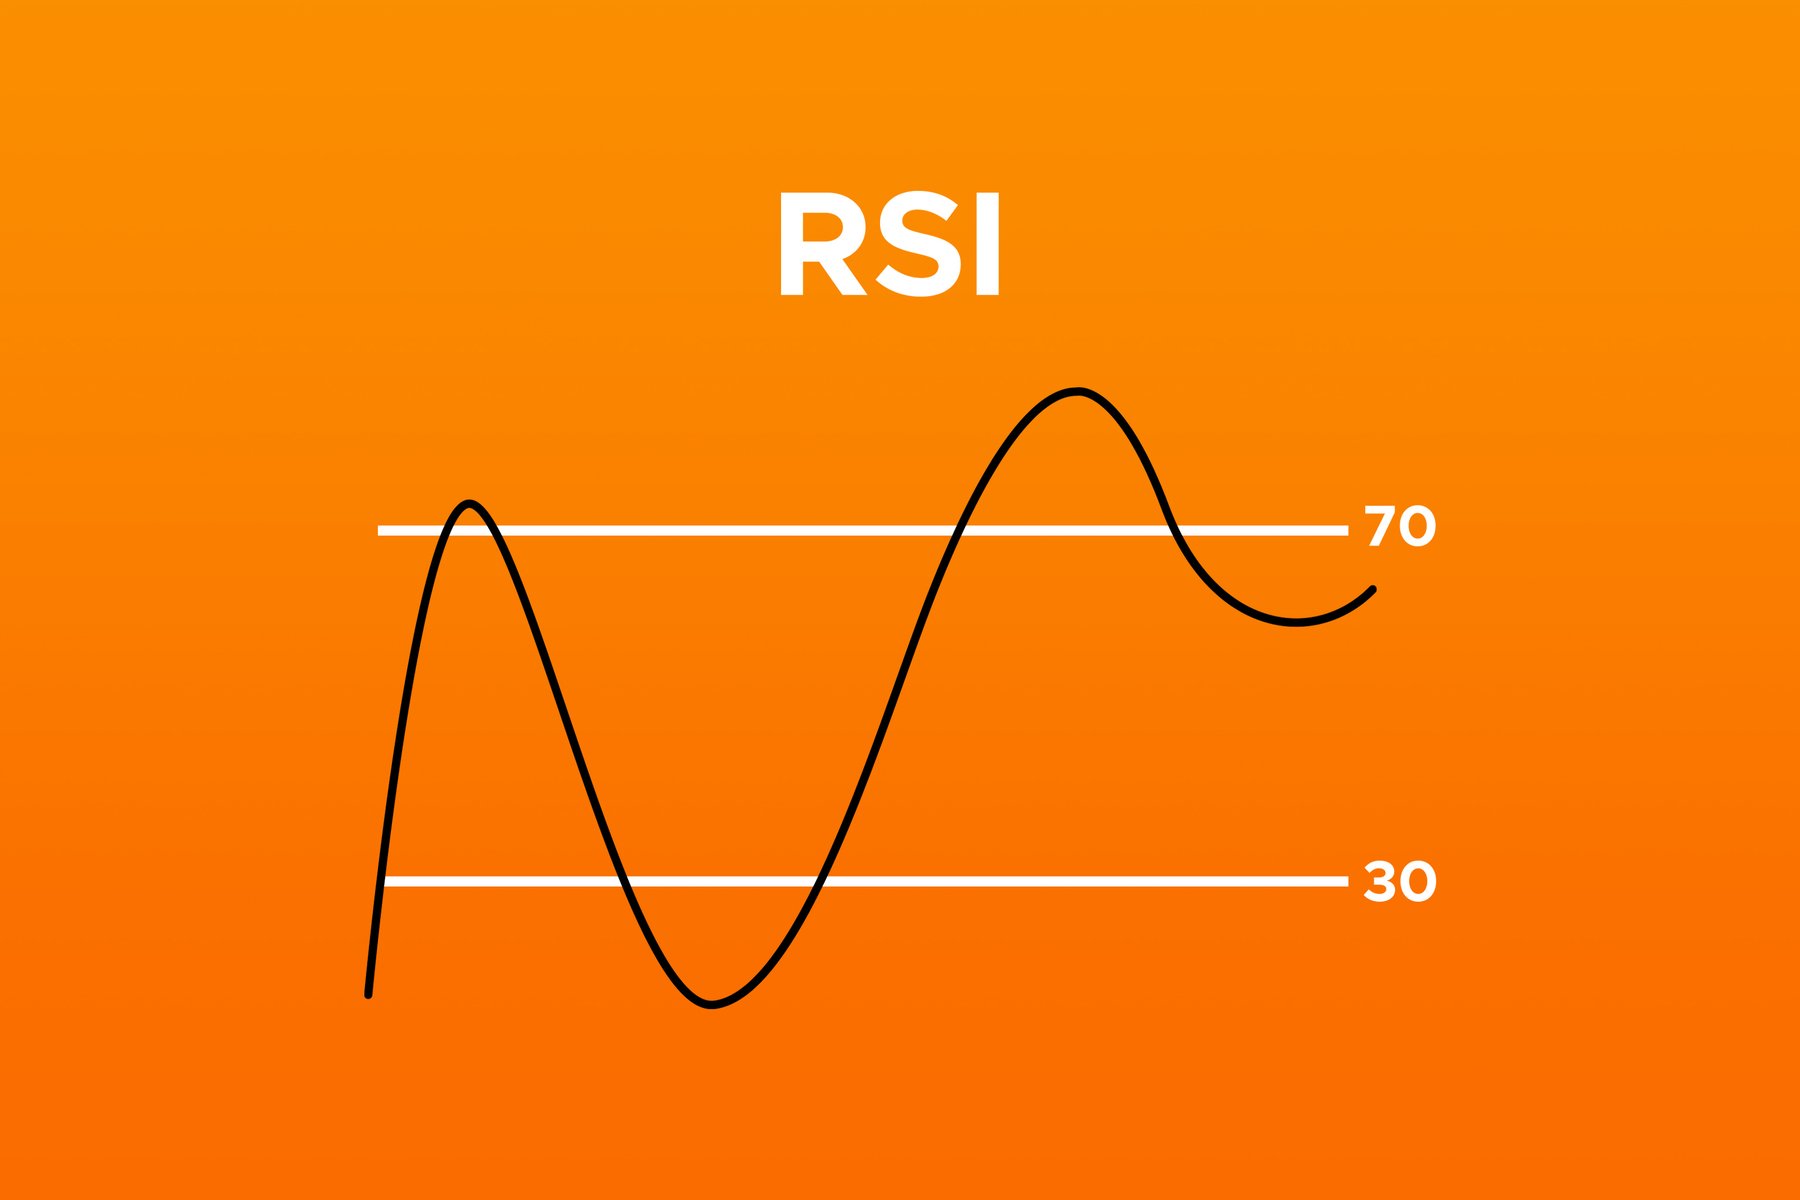
The most commonly used indicator is: The Relative Strength Index or RSI.

Calculation

The RSI is calculated based on the average gains/losses over a certain time period - by default that is 14 days.

The formula is:

RSI = 100 - [ 100 / (1+ RS) ]

& RS = Average Gain / Average Loss

Overbought & Oversold

Typically, RSI > 70 considers an asset to be "Overbought" and an RSI < 30 considers it "Oversold". People often here the sentence: "Sell when it's overbought and buy when it's oversold".

This is a misconception and really bad advice.

Using the RSI

The Relative Strength Index is a momentum indicator. In reality, this means selling based on RSI figures above 70 often leads to one missing a major portion of a rally. Why? Because a high RSI indicates that the market is trending. The same can be applied to oversold conditions - the market is trending down and one would buy before a larger downside push.

The RSI's use mainly comes in for checking on the momentum's health, whether buyers/sellers are getting exhausted but it cannot be used to find tops & bottoms. That is where the concept of divergences comes in.

RSI Divergences

When a market is trending down and price action is continually creating lower lows, while the RSI is registering higher lows then that means the downside momentum is getting exhausted and seller strength is dissipating. This is called a bullish divergence.

Conversely, the opposite is also valid: higher highs in price with lower highs on the RSI indicates buyer momentum exhaustion and is called a bearish divergence.
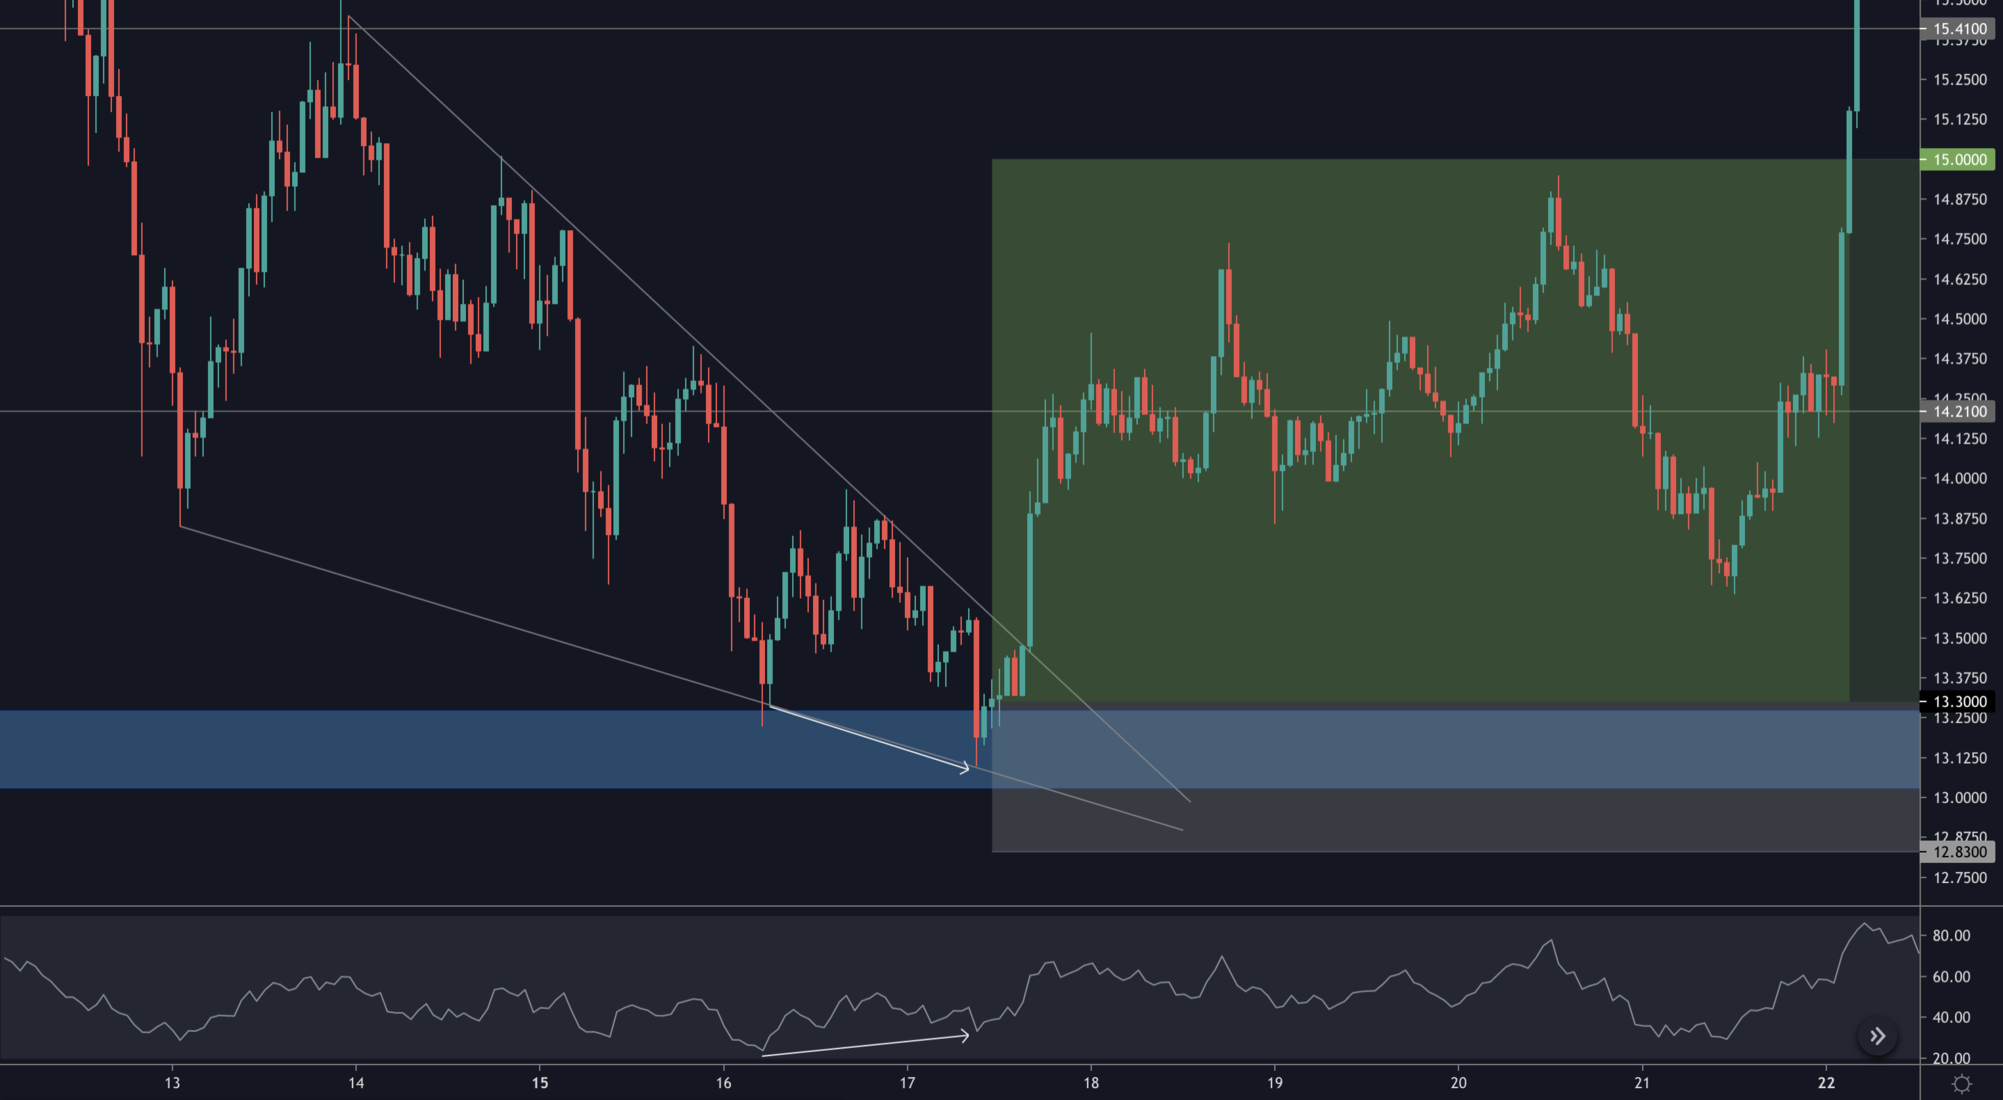
Example

Take a look at the chart below.

Price was creating lower lows while the RSI was generating higher lows. This was indicating that each new push to the downside became shallower and eventually that led to buyers overpowering sellers and a market reversal.

Of course, the RSI is not a main decision maker but rather a confluence indicator. With a falling wedge formation and incoming price support, a bullish divergence increases the odds of success for a price reversal.

aligncenter size-full wp-image-52259

Get started for free

Create your free account or log in to read the full article.

​

Netherlands

By signing up, you agree to our Terms & Conditions
Recommended from Cryptonary
Market Update: Bitcoin Approaches Key Resistance as US-Iran Tensions Drag On
PRO
Market Updates
Market Update: Bitcoin Approaches K...The geopolitical backdrop remains tense, but markets are not breaking. As the US-Iran deadlock drags...
9 min read
Apr 23, 2026
BTC, ETH and More: Bitcoin Maintains Strength
PRO
Market Direction
BTC, ETH and More: Bitcoin Maintain...The market remains tilted toward upside, but recent price action is sending a clear message: strengt...
11 min read
Apr 21, 2026
Market Update: Bitcoin Eyes Key Catalysts
PRO
Market Updates
Market Update: Bitcoin Eyes Key Cat...A volatile macro backdrop continues to dominate crypto markets, with shifting signals from U.S.–Iran...
7 min read
Apr 20, 2026
Market Pulse: Fed and Earnings
PRO
Market Pulse
Market Pulse: Fed and EarningsThis evening, we had the Fed Meeting (Powell's last as Chair) and Big Tech Earnings. Let's dive into...
3 min read
Apr 30, 2026
Market Update: US-Iran Deadlock and Key Risks
PRO
Market Updates
Market Update: US-Iran Deadlock and...This week brings several key developments for markets, with renewed focus on US-Iran tensions, the F...
8 min read
Apr 27, 2026
BTC, ETH and More: Market Hits a Major Decision Zone
PRO
Market Direction
BTC, ETH and More: Market Hits a Ma...Bitcoin has finally tapped the $79,140 liquidity target, but the real question now is whether this b...
12 min read
Apr 24, 2026
Market Update: Bitcoin Approaches Key Resistance as US-Iran Tensions Drag On
PRO
Market Updates
Market Update: Bitcoin Approaches K...The geopolitical backdrop remains tense, but markets are not breaking. As the US-Iran deadlock drags...
9 min read
Apr 23, 2026
BTC, ETH and More: Bitcoin Maintains Strength
PRO
Market Direction
BTC, ETH and More: Bitcoin Maintain...The market remains tilted toward upside, but recent price action is sending a clear message: strengt...
11 min read
Apr 21, 2026
Market Update: Bitcoin Eyes Key Catalysts
PRO
Market Updates
Market Update: Bitcoin Eyes Key Cat...A volatile macro backdrop continues to dominate crypto markets, with shifting signals from U.S.–Iran...
7 min read
Apr 20, 2026
Research
Top PicksDeep DivesPassive IncomeAirdrop ReportsMemecoins
Analysis
Market UpdatesMarket DirectionMarket PulseLivestreams
Tools
Market DirectionAssets & PicksAirdropsPortfolio Tracker
Cryptonary
Affiliate programEducationPrivacy PolicyTerms & ConditionsContact UsWrite for usTeam
Stay connected
Disclaimer: The information provided on this website is for educational and informational purposes only and does not constitute financial, investment, legal, or tax advice. Cryptonary is not a licensed financial advisor. All content is shared without any guarantee of accuracy or completeness. You are solely responsible for your investment decisions. Always do your own research and consult with a licensed professional before making financial choices. Past performance is not indicative of future results.

×
popupimage
Our Latest Utility Token Research ReportPreviously locked for Pro members, now available to read in full.
  • tickThe utility token we're tracking closely
  • tickWhy we believe it's still early in the cycle
  • tickWhat we're watching to confirm a structural shift
​
Netherlands

No spam. No hype. Just the research.