Save 23% ($351) & Get a Free 1-1 Call with our Team ⏰ : 0d 2h 59m 43s
Korea’s Market Crash: Is a Global Financial Contagion Starting?
The first cracks in global markets are starting to appear. South Korea has already suffered the worst stock market crash in its history, the UAE exchanges shut down after missile strikes, and shipping through the Strait of Hormuz has nearly disappeared. Yet US equities are still hovering near record highs, raising one critical question: how long can that resilience last?
South Korea's stock market just recorded the worst single-day drop in its history. Dubai's exchanges went dark for two days as missiles fell on Abu Dhabi. The Strait of Hormuz, through which roughly 20% of the world's oil flows, has seen near-zero commercial traffic for ten days.
US markets briefly sold off late last week as the conflict escalated. By Monday night, the S&P 500 had already recovered most of those losses and was trading back near 6,820, still close to its recent highs.
Whether that resilience holds may turn out to be the most important question in global markets right now.
In this report:
- Why Korea cracked first, and what it reveals about leverage
- Why the UAE shutdown matters, and how Gulf capital can hit US markets
- Why Hormuz is more than an oil story
- Why the S&P has held up, and why that may not last
- Why BTC has held up, and why the signal is still mixed
- What to watch next
Disclaimer: This is not financial or investment advice. You are responsible for any capital-related decisions you make, and only you are accountable for the results.
What happened? South Korea Is Under Pressure
South Korea's benchmark KOSPI index suffered its worst crash in history in early March 2026, triggered by fears over the escalating US-Israel-Iran conflict disrupting oil supplies (South Korea imports nearly all its energy from the Middle East).The index plunged 7.24% on March 3 and a record 12.06% on March 4 (the biggest single-day drop ever, closing at ~5,093), wiping out roughly 18–20% from recent highs over just a few days and erasing over $550 billion in market value.
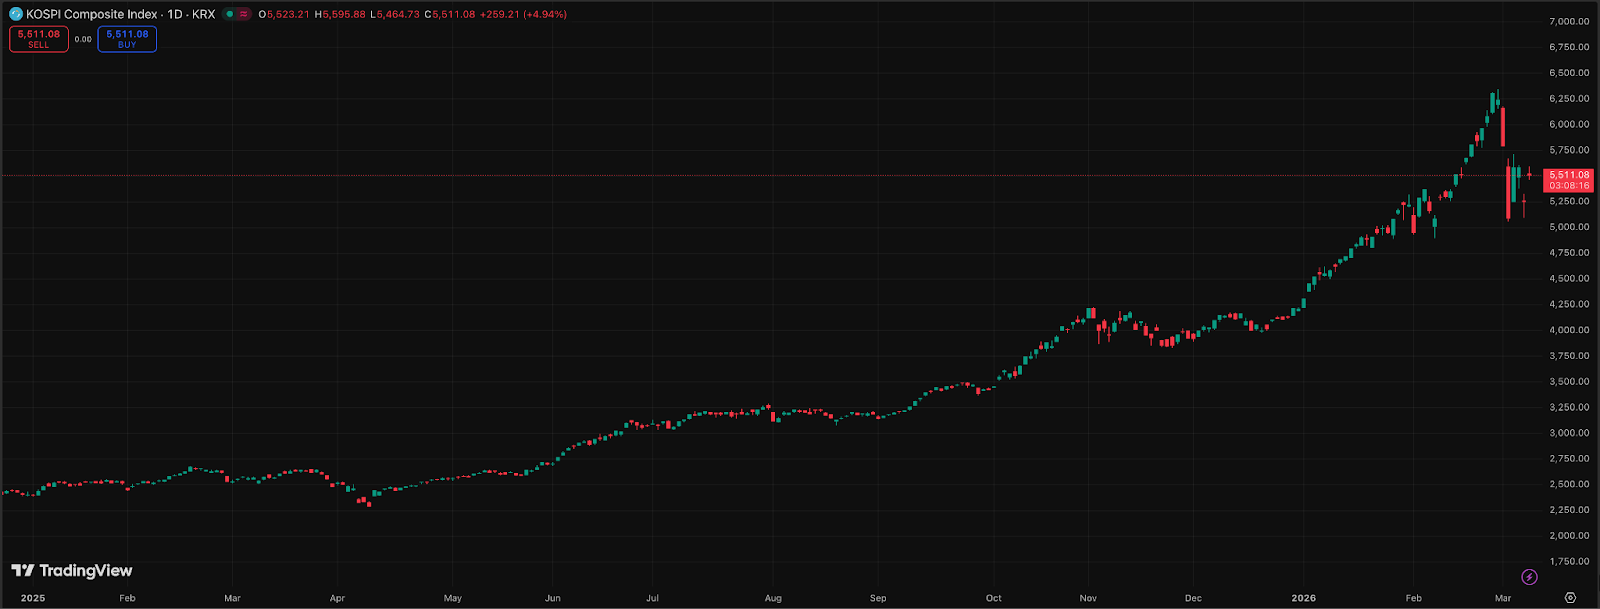
However, this is not just about the energy they import from the Middle East. To understand why Korea fell harder than any other major market, it is necessary to start with how far it had already risen. From roughly 2,400 at the start of 2025, the KOSPI climbed to an all-time high of 6,347 on February 25, 2026. That represented a gain of nearly 150% in fourteen months, making it the strongest-performing major equity index in the world over that period and substantially outperforming the S&P 500.
However, the structure beneath that rally was fragile. Samsung Electronics and SK Hynix, the two dominant players in AI memory chips, together accounted for roughly one-third of the index. As demand for AI infrastructure accelerated through 2025, their share prices rose sharply. When those two names moved, the broader market moved with them. That kind of concentration can look powerful in a momentum market. In a panic, it can quickly become a point of vulnerability.
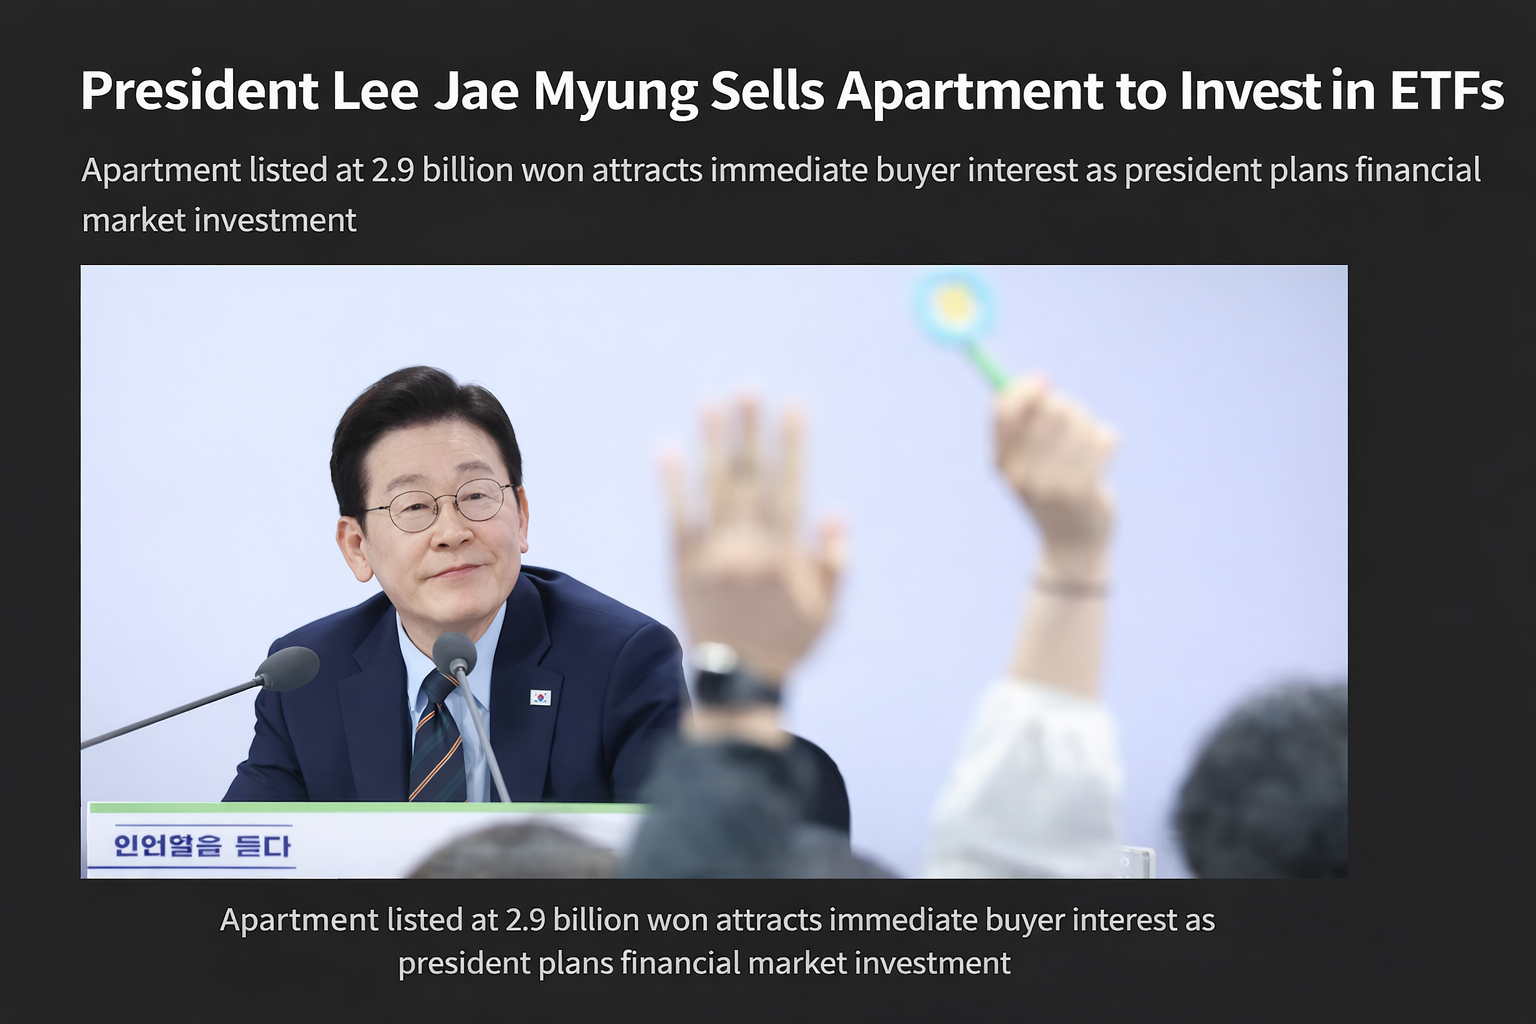
Retail participation appears to have made the setup even more fragile. Active trading accounts in Korea surpassed 100 million for the first time in January 2026, in a country with a population of 51 million. The government actively encouraged what it called a "money move," redirecting household savings out of real estate and deposits and into equities. President Lee Jae-myung publicly praised the trend and announced he was selling his own apartment to put money into stocks. What looked like broad participation on the way up may also have increased fragility once prices began to fall.
This level of risk appetite was not new. Korean retail investors have long been among the most aggressive in the world. The country ranks near the top globally for derivatives trading volume relative to population, and Korean crypto exchanges have historically recorded some of the highest volumes anywhere. The so-called kimchi premium exists because local crypto demand is often strong enough to push Korean prices above international markets. In other words, Korean traders are real degens.
That same speculative behavior helped drive the KOSPI to 6,347 and left retail portfolios heavily exposed to leverage. When sentiment turned, there was limited natural buying available to absorb the selling. This is an important distinction. Korea did not enter the selloff looking weak in headline performance terms. It entered looking extended, concentrated, and vulnerable beneath the surface.
From Shock to Liquidation
The US-Israeli strikes hit Iran on February 28, and Tehran responded by threatening to close the Strait of Hormuz. Korea, however, was still in the middle of a long holiday weekend, which delayed the market reaction. When markets reopened on March 3, the selling that had built up over the break hit all at once.
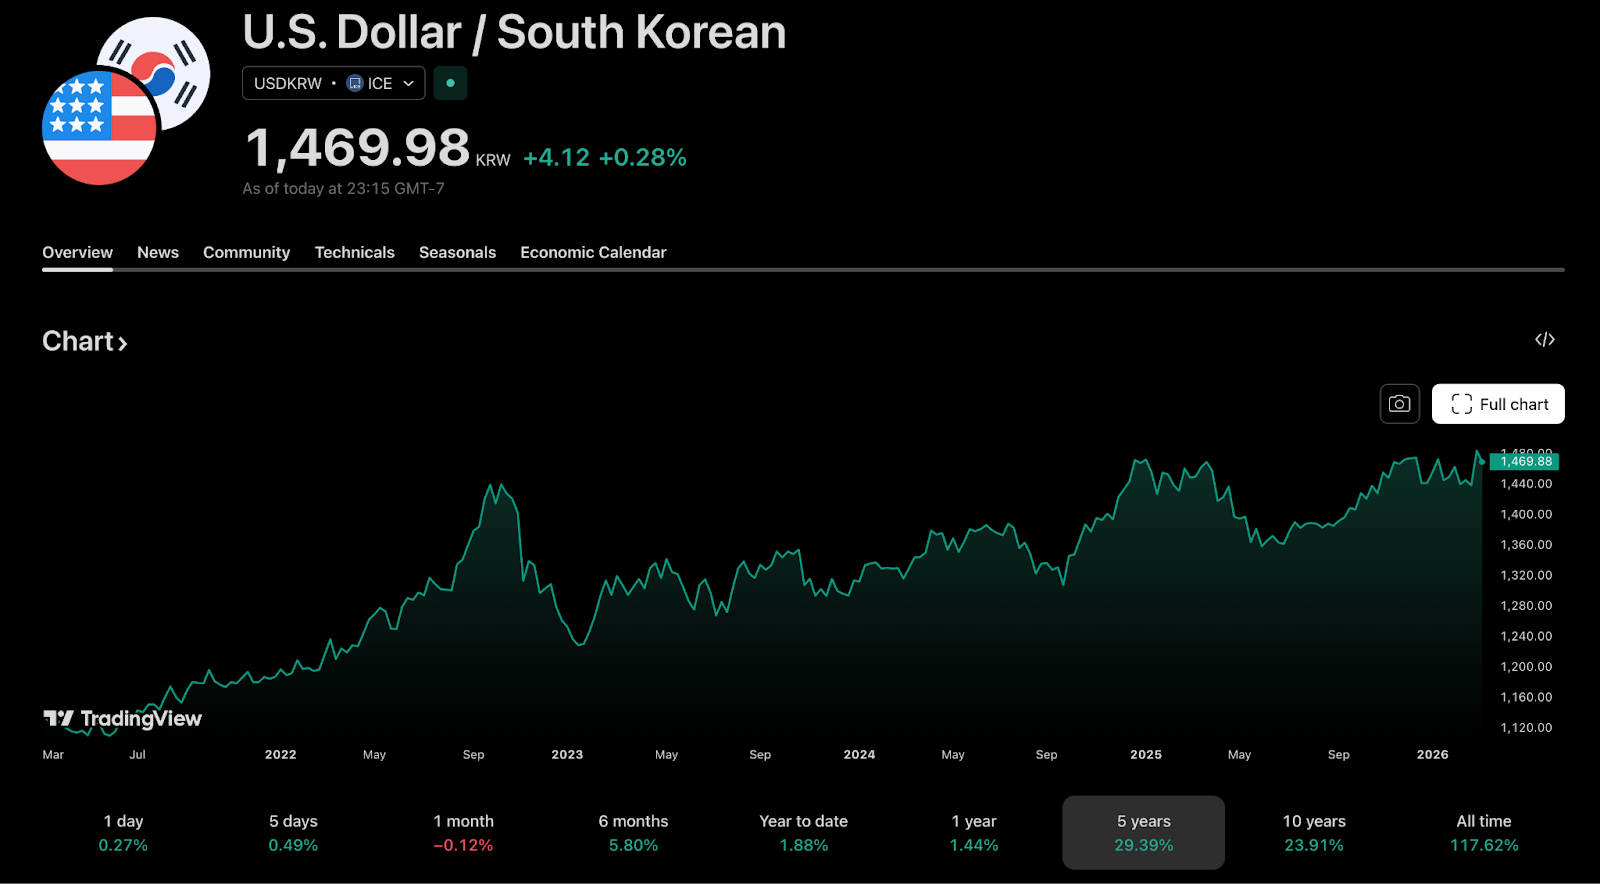
Foreign investors dumped more than $3 billion in Korean stocks over the two-day crash, while the won weakened sharply against the dollar, briefly pushing through the 1,500 level before settling back near 1,470. For an economy heavily dependent on imported energy, that move made Korea’s already heavy import bill even more expensive in local currency terms.
The KOSPI fell 7.2% on March 3 and another 12.06% the following day, marking the worst single-day decline in the index’s history. Circuit breakers were triggered in both sessions, and the selling was nearly indiscriminate, with all but 14 of the 925 traded stocks closing lower on the worst day. Even the market’s largest names were hit hard, as Samsung fell nearly 10%, SK Hynix dropped 11.5%, and Hyundai Motor lost almost 12%.
The mechanics mattered as much as the headlines. Margin calls on leveraged retail positions triggered forced selling, and each additional wave lower produced more liquidation. The same leverage that amplified gains during the rally accelerated losses on the way down. This is often how highly extended markets unwind, not through an orderly repricing, but through a self-reinforcing liquidation cycle.
What happened after the initial crash mattered just as much. Korea did not stage a clean V-shaped recovery. A bounce of 9.6% on Thursday, March 5, offered brief relief, but that stabilization did not hold. By Monday, March 9, the KOSPI was back under pressure and closed around 5,251, erasing the rebound and leaving the market still sharply below the February 25 peak of 6,347.
That post-crash price action is very important. The rebound failed to restore the prior range, making a new lower high… (aka potentially start of a bearish trend)
UAE: A Shutdown, Then a Selloff
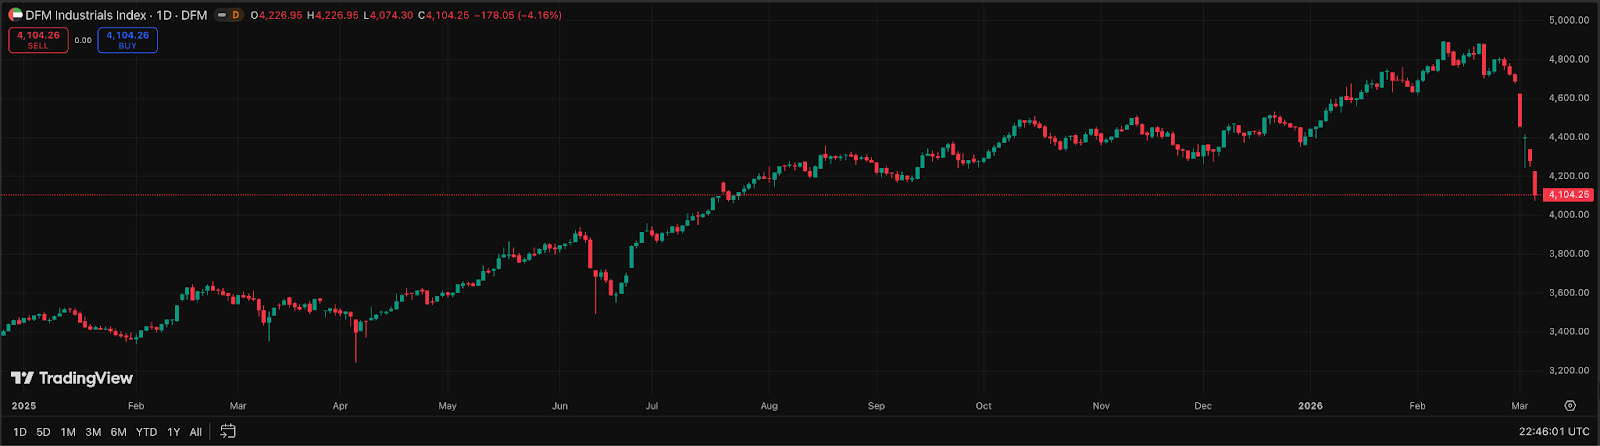
South Korea’s market collapse showed up immediately in price. In the UAE, the first signal came through market closure.
After Iran struck Abu Dhabi airport on March 1, the UAE Capital Market Authority shut both the Abu Dhabi Securities Exchange and the Dubai Financial Market for two days. That kind of move is highly unusual and signaled that the threat was being taken seriously on the ground.
When trading resumed, the Dubai Financial Market sold off sharply, while Abu Dhabi also came under pressure. The weakness persisted into the following sessions, suggesting the shutdown had not contained the shock so much as delayed its expression in price.
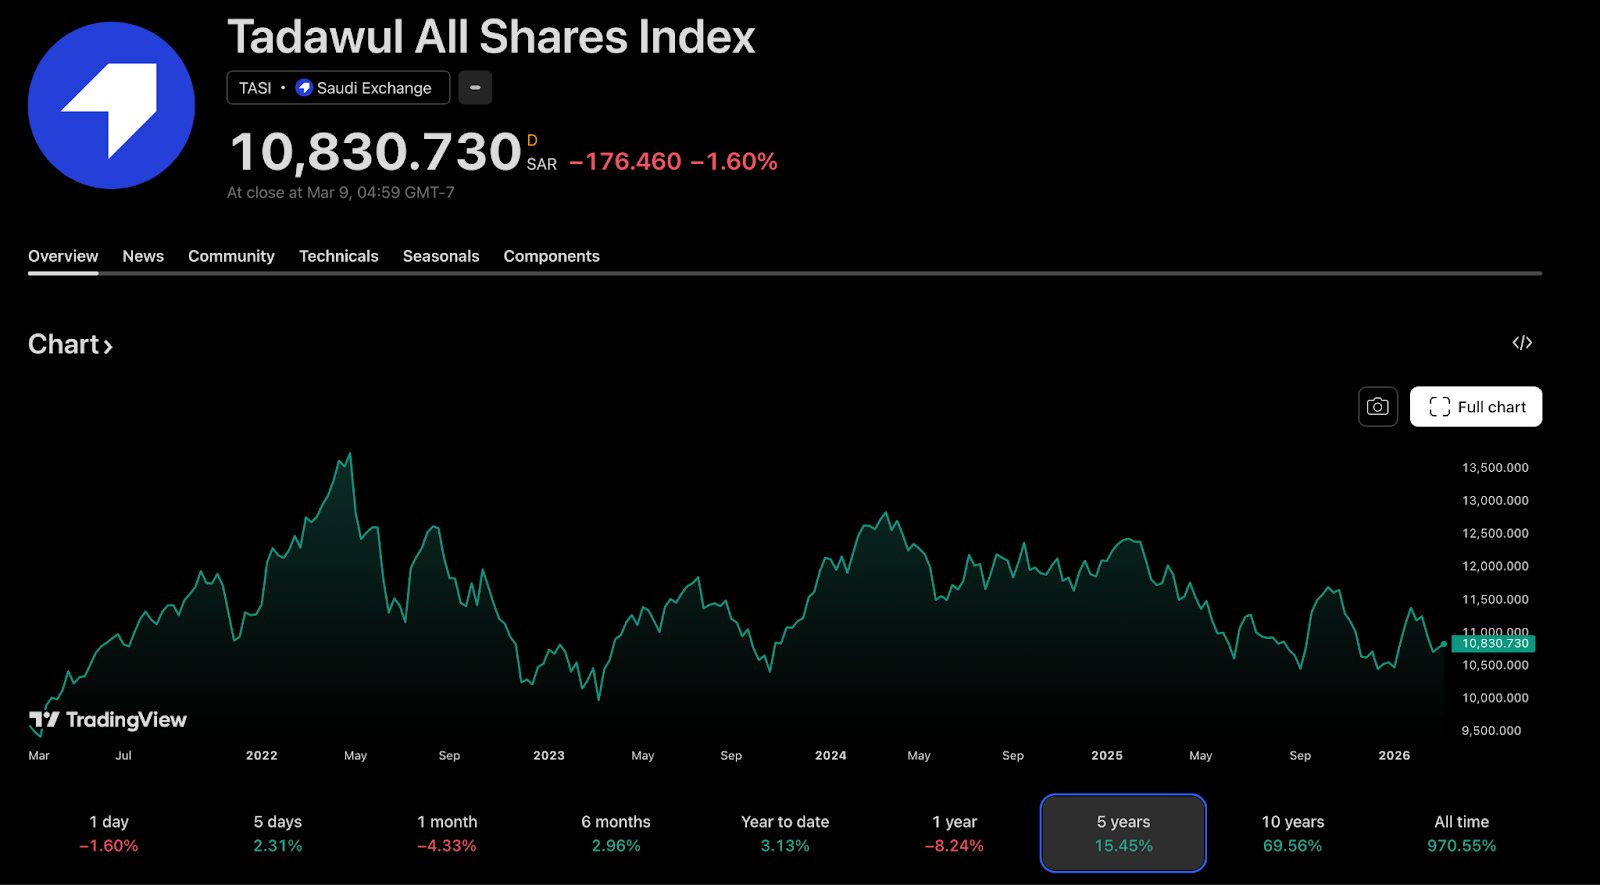
Saudi Arabia’s Tadawul, by contrast, held up materially better. That distinction matters. The UAE is also an energy exporter, but Abu Dhabi was directly struck, and its exchanges were closed, which made the market appear part of the conflict zone rather than a straightforward beneficiary of higher oil prices. Saudi Arabia, by contrast, appeared more insulated from the immediate disruption, while its Aramco-heavy index was better positioned to absorb stronger crude.
Why Gulf Capital Matters
The sovereign wealth angle is often underreported but profoundly important. Gulf nations, especially Abu Dhabi, with over $2 trillion managed by ADIA, Mubadala, and ADQ, and Saudi Arabia, with a $1 trillion US investment pledge from the Public Investment Fund, manage massive, active sovereign wealth pools. These funds are major, recurring buyers across US equities, private equity, infrastructure, credit, and technology.That is why Gulf instability matters beyond the region itself. The immediate risk is not forced liquidation. It is a pause in new allocations, a reduction in risk appetite, or a shift toward domestic or regional capital preservation. In a market already trading on stretched valuations, that kind of slowdown matters. US equities do not necessarily need outright selling to reprice lower. They simply need less incremental buying.
If Gulf sovereign funds become more cautious, the effect may be slower deployment, more selective risk-taking, and less incremental support for a market that has grown used to deep pools of capital. That may not look dramatic day to day, but over time, it weakens a market that has become dependent on abundant liquidity and persistent inflows.
This matters especially in the current setup. US equities are already carrying high valuations, a compressed equity risk premium, and rising sensitivity to oil, yields, and inflation expectations. In that environment, even a modest softening in sovereign demand can have an outsized effect. A market trading on thin risk premiums does not need a wave of forced selling to break lower. Sometimes it only needs the bid to fade.
This Isn’t Just an Oil Story
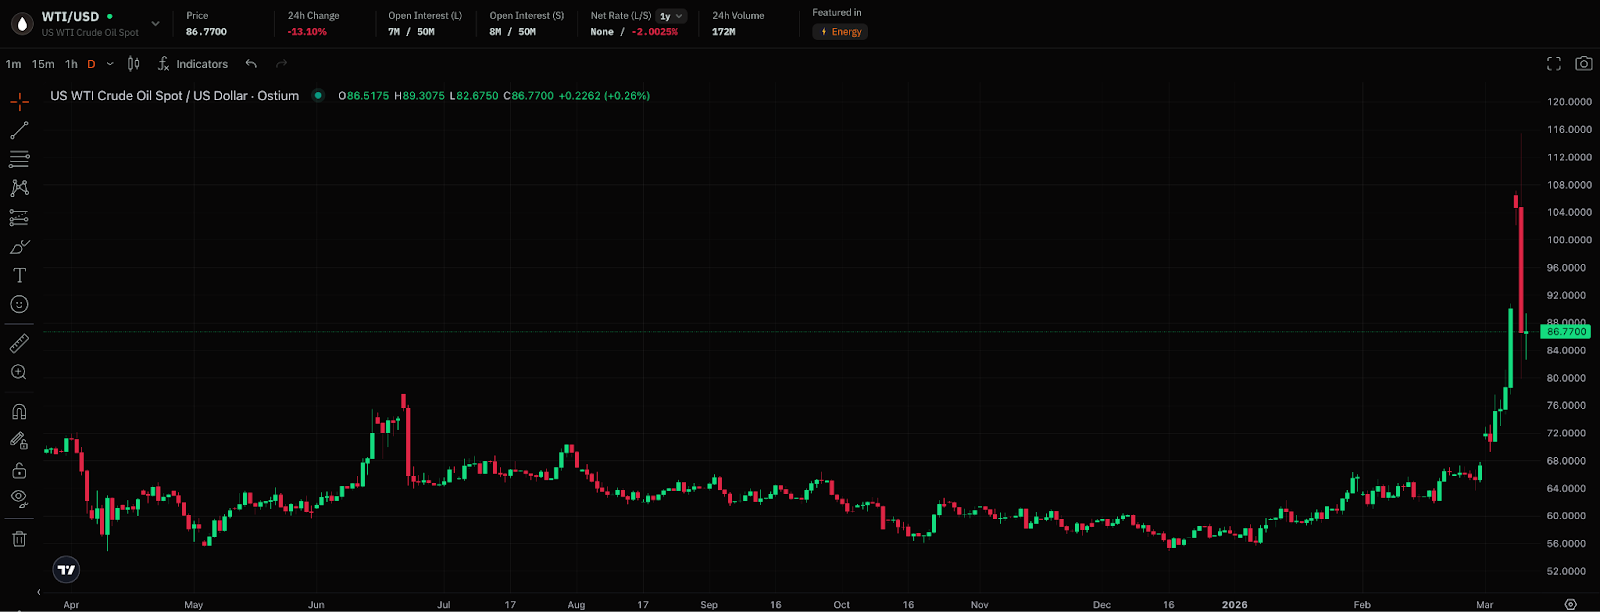
The dominant market framing has been oil. Prices spiked sharply during the initial panic before retreating. As of the latest update, WTI was back near $86.8 after briefly trading much higher during the initial shock.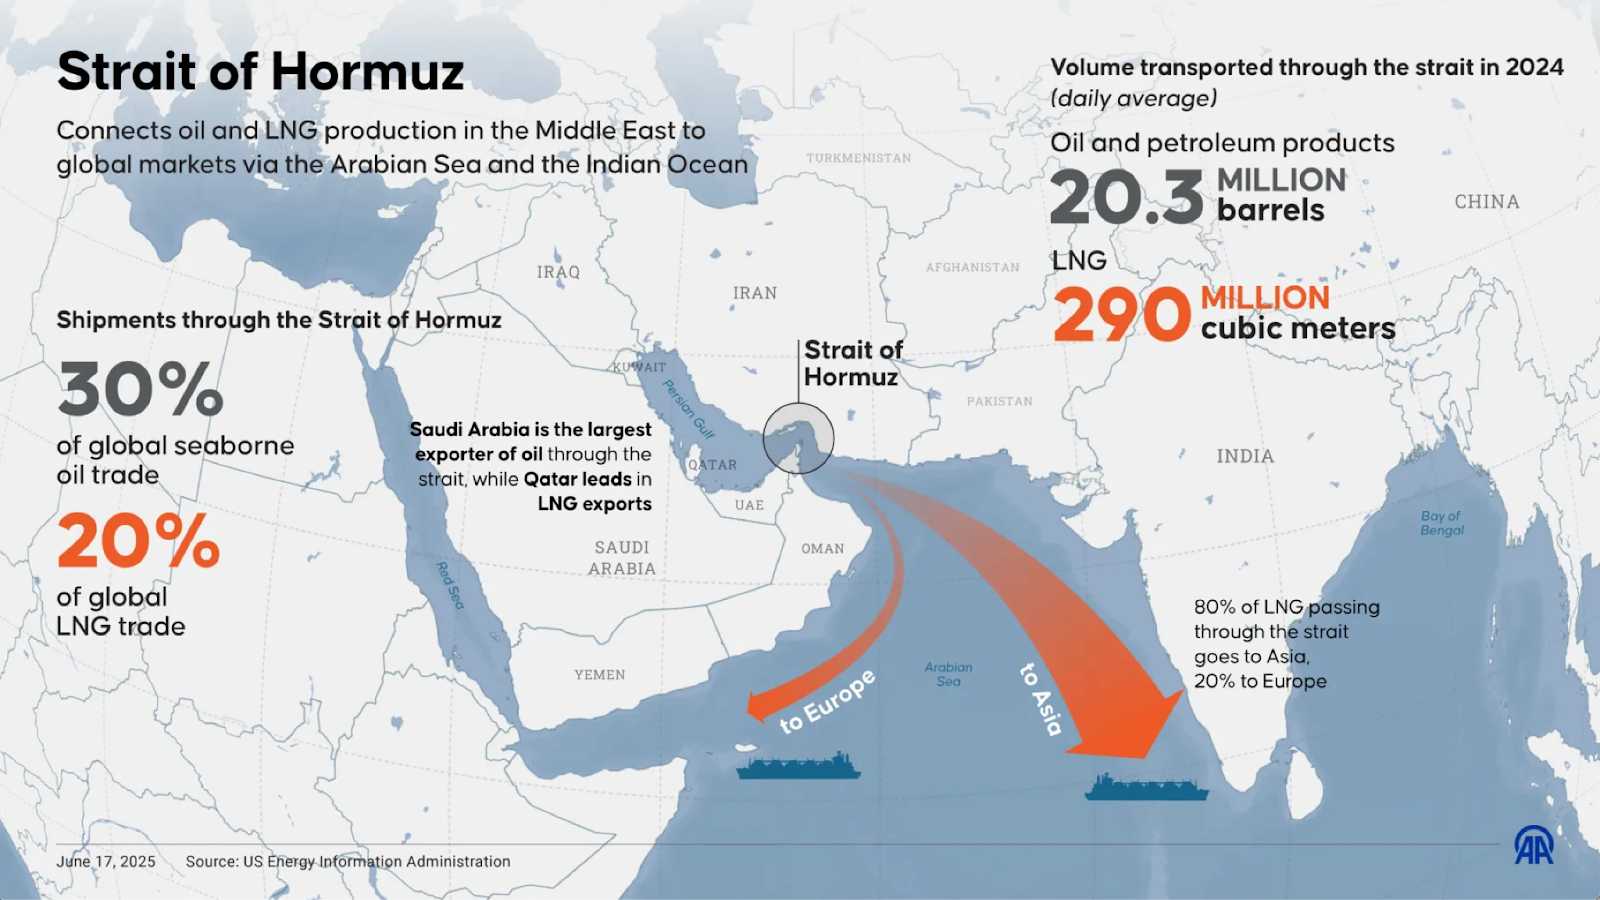
Trump’s CBS interview on March 9 helped fuel the retracement, but the Pentagon contradicted that message within hours. The contradiction remains unresolved, and the Strait of Hormuz remains functionally closed.
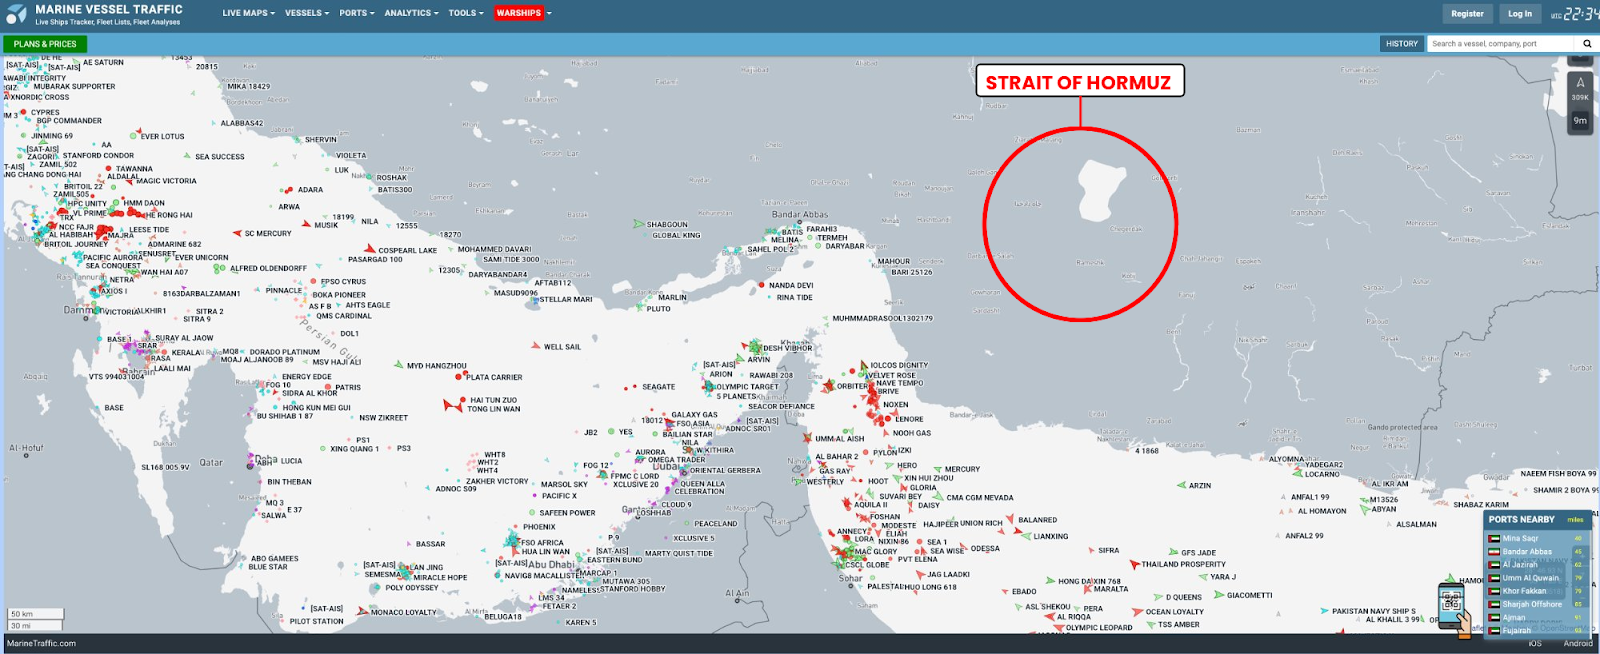
According to the US Energy Information Administration, roughly 20.3 million barrels of oil and petroleum products pass through Hormuz each day, representing about 30% of global seaborne oil trade. Another 290 million cubic meters of LNG move through the same chokepoint daily, equivalent to roughly 20% of global LNG trade, with about 80% of that volume heading to Asia. Saudi Arabia is the largest oil exporter through the Strait, while Qatar dominates LNG flows.
That is why this is not just an oil story. Hormuz is a chokepoint for several supply chains the global economy treats as essential, and one of them sits directly beneath the AI trade that has done so much of the heavy lifting for US equities.
From Military Risk to Commercial Disruption
The shipping data makes clear that this is no longer a simple geopolitical scare. As traffic through the strait collapsed, the story shifted from military risk to commercial disruption. Tanker crossings fell to near zero, insurance costs surged, and vessels began to stack up around the region.
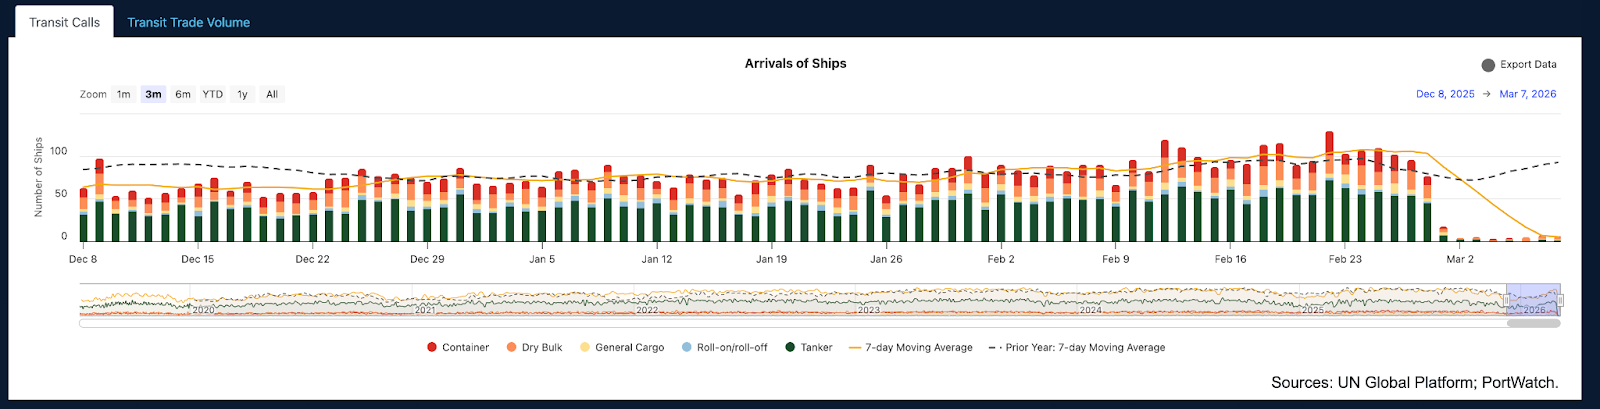
Even if the exact counts change day to day, the broader message is clear: this is not normal shipping activity under elevated risk. It is a serious disruption to a critical corridor.
The Insurance Layer Nobody Is Talking About
This is the part of the story that markets may be underestimating. The practical mechanism closing Hormuz is not just missiles or naval risk. It is insurance.
Between March 1 and 2, seven of the twelve P&I clubs that collectively insure roughly 90% of the world’s ocean-going commercial tonnage issued 72-hour cancellation notices for war-risk coverage across the Persian Gulf. Without that coverage, a supertanker may still be physically able to sail, but the voyage becomes commercially difficult or impossible. Ports become more cautious, cargo owners hesitate, banks step back, and shipping lines stop moving.
Trump responded by saying the US Development Finance Corporation would provide government-backed political risk insurance and that the Navy would escort tankers if necessary. That may help at the margin. The bigger question is whether it can replace the institutional reinsurance market at scale. Even if the military threat were to recede quickly, insurers would still need time to rebuild risk models.
That means the reopening timeline is not purely a function of when the shooting stops. There is a parallel institutional process here that markets do not appear to be fully pricing.
The AI Supply Chain Risk
This matters for US equities because the disruption runs into the AI stack.Qatar’s Ras Laffan LNG facility has been struck and output disrupted. Qatar supplies roughly a third of Taiwan’s LNG imports, while LNG generates more than 40% of Taiwan’s electricity. TSMC, the foundry at the center of the global advanced chip supply chain, is also one of the island’s largest industrial power consumers.
The chain of logic is straightforward. If LNG flows are disrupted for long enough, power systems come under pressure. If power systems come under pressure, semiconductor production becomes more vulnerable. If semiconductor production becomes more vulnerable, the infrastructure narrative underpinning a large part of the AI trade begins to face a real-world constraint.
That does not mean the market must immediately reprice every large-cap technology name. It does mean the risk is more layered than a simple oil shock, and more relevant to US equities than current price action suggests.
Could the US Market Be Next?
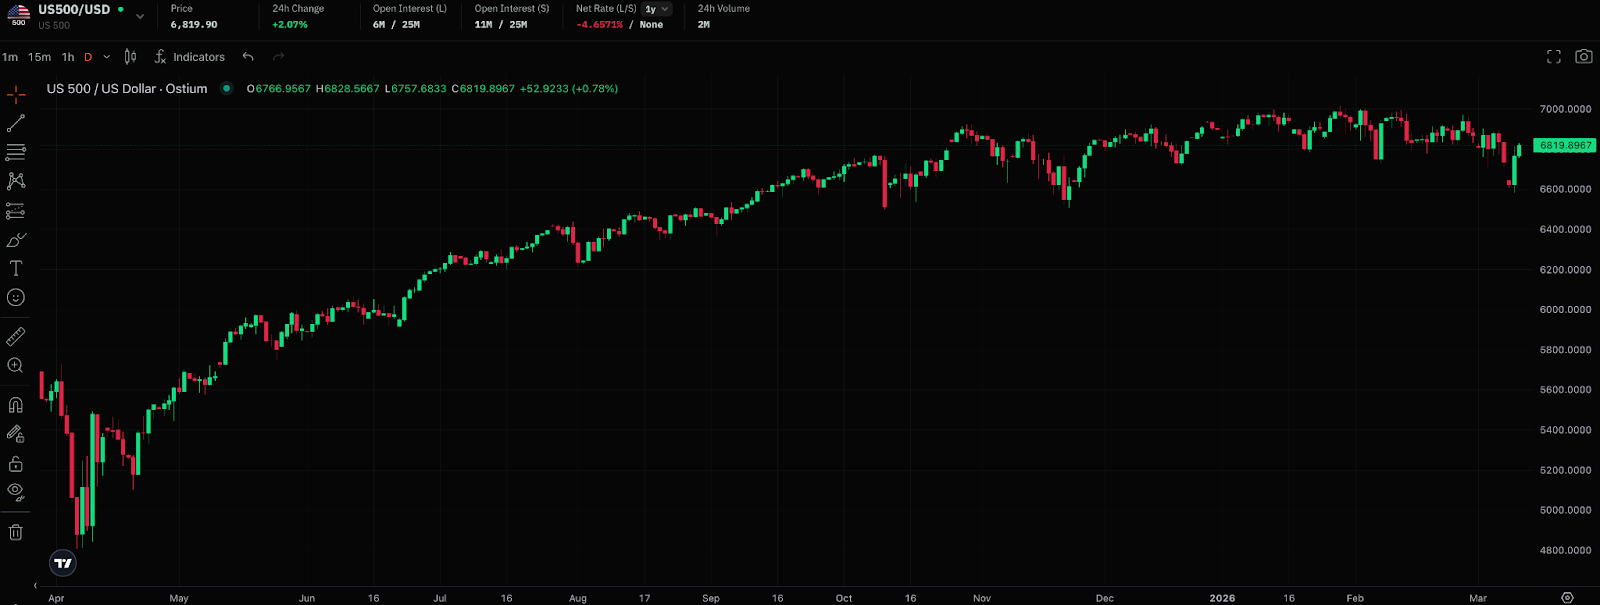
The S&P 500 dipped roughly 1% in the immediate aftermath of the strikes and has since recovered most of those losses, trading back near 6,820 as of the latest market check. Volatility spiked to its highest closing level since November 2025, but the index itself has not broken down.
There are real reasons for that resilience. Mega-cap buybacks continue to provide a mechanical bid. Investors may still be pricing a short conflict, particularly after Trump’s March 9 comments. The concentration of the index in dollar-earning technology giants also offers some insulation from global stress.
Discussions around strategic reserve releases, if they materialize, would further help cap the near-term oil shock. That helps explain why equities have absorbed the first wave of the shock better than many would have expected.
What bought markets time was not a genuine resolution, but a temporary easing in the most immediate pressure points. Strategic reserve discussions and Trump’s suggestion that the war could end soon helped pull oil lower, which in turn gave equities room to recover. But that rebound rests on the assumption that the conflict de-escalates before the secondary effects begin to matter. If the situation drags on without resolution, the same pressures are likely to re-emerge.
US equities entered this shock with very little room for error. The Shiller CAPE ratio was already near historic highs, while the equity risk premium had compressed toward zero. Markets at those valuations do not need a major policy mistake to reprice. They simply need a shock that lasts longer than expected.
The February jobs report added to that vulnerability. With growth already softening and oil still well above its pre-war baseline, the market is starting to confront the early ingredients of stagflation: slower growth, sticky inflation, and a Fed with limited room to respond. Markets are still pricing only one rate cut for all of 2026. The Russell 2000 has already shown more visible strain than the large-cap indices, which is often where stress appears first.
A Fed leadership transition in June adds another layer of uncertainty. Kevin Warsh is expected to replace Powell, and history suggests that markets often become more sensitive to policy uncertainty during chair transitions. That does not guarantee a drawdown. It does mean the market is more fragile than it was six months ago.
What the Prediction Markets Say
Prediction markets tell a similar story. Recession odds on Polymarket’s “US recession by end of 2026” market sat around 22% before the conflict, spiked to 36% at the height of the initial panic, and have since pulled back to 28%. The unwind mirrors what oil did on March 9: a fear premium fading on ambiguous signals rather than on any actual resolution.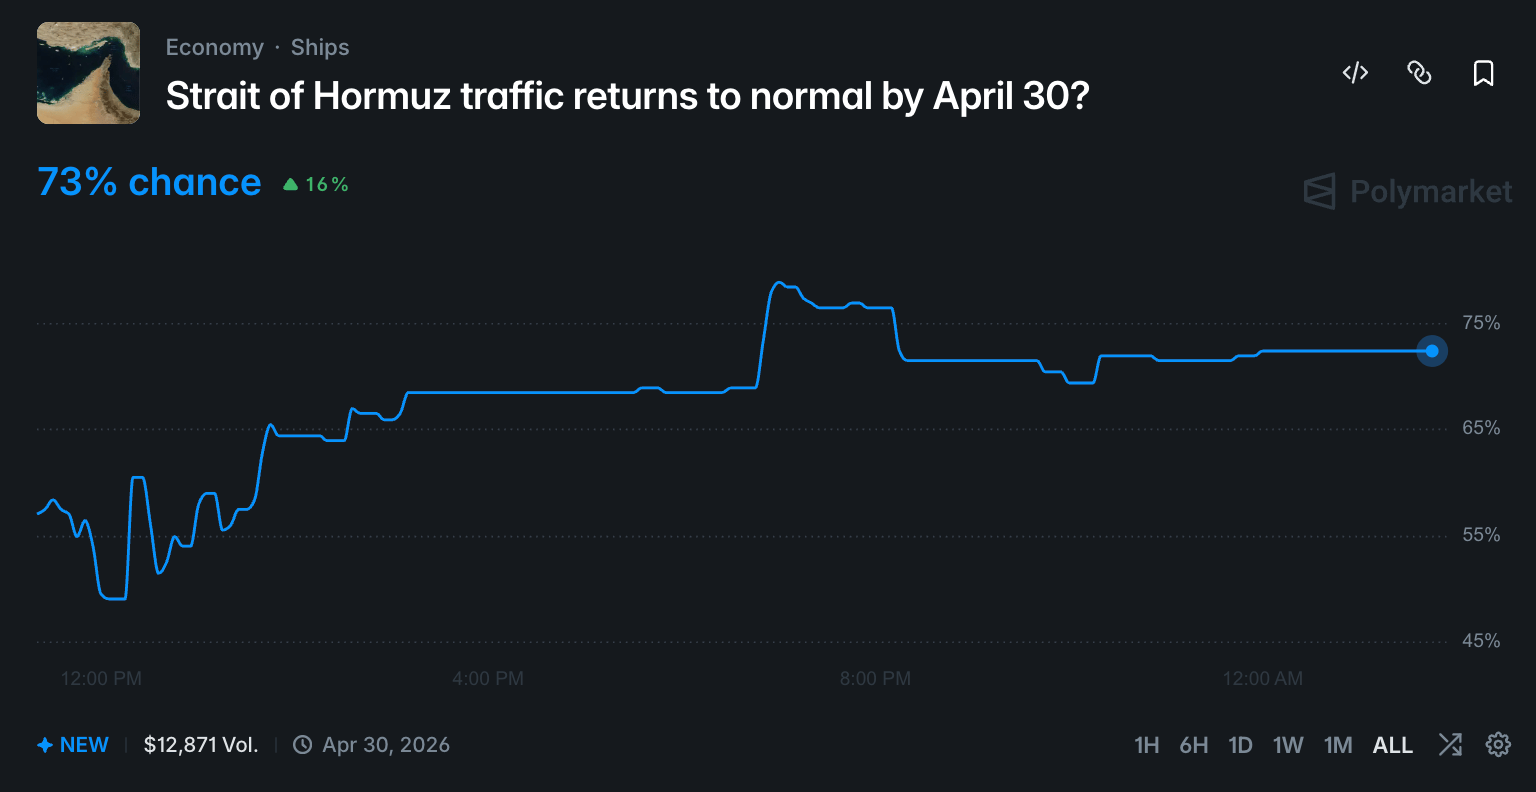
On the Hormuz timeline, Polymarket is still pricing a relatively optimistic path, with the market now implying roughly a 73% chance that traffic normalizes by April 30 (Note: the volumes are just $13k, so it is pretty much a non-burger data point). That may prove correct, but it also means duration risk remains underpriced if de-escalation fails to materialize.
The message from both markets is similar. The panic has eased, but it has not disappeared. Markets are no longer pricing worst-case escalation, yet they are not fully back to normal either. They are waiting for confirmation.
Markets also rallied on de-escalation language that remains far from settled. Trump’s comments helped fuel the rebound, but the broader signaling has remained contradictory, which is exactly why the move should be treated cautiously rather than as proof that the risk has passed.
Wall Street’s TACO trade (Trump Always Chickens Out) has conditioned markets to buy the dip on every escalation, assuming the walkback is coming. That pattern has worked reliably for tariffs, where the cost of reversal is low, and the incentive to back down is high.
Whether it works for a hot war in the Persian Gulf is a different question entirely. Chickening out of a 50% EU tariff is easy. Chickening out of a conflict where the Strait of Hormuz is physically closed and a new Iranian Supreme Leader has no interest in offering an off-ramp is not the same trade.
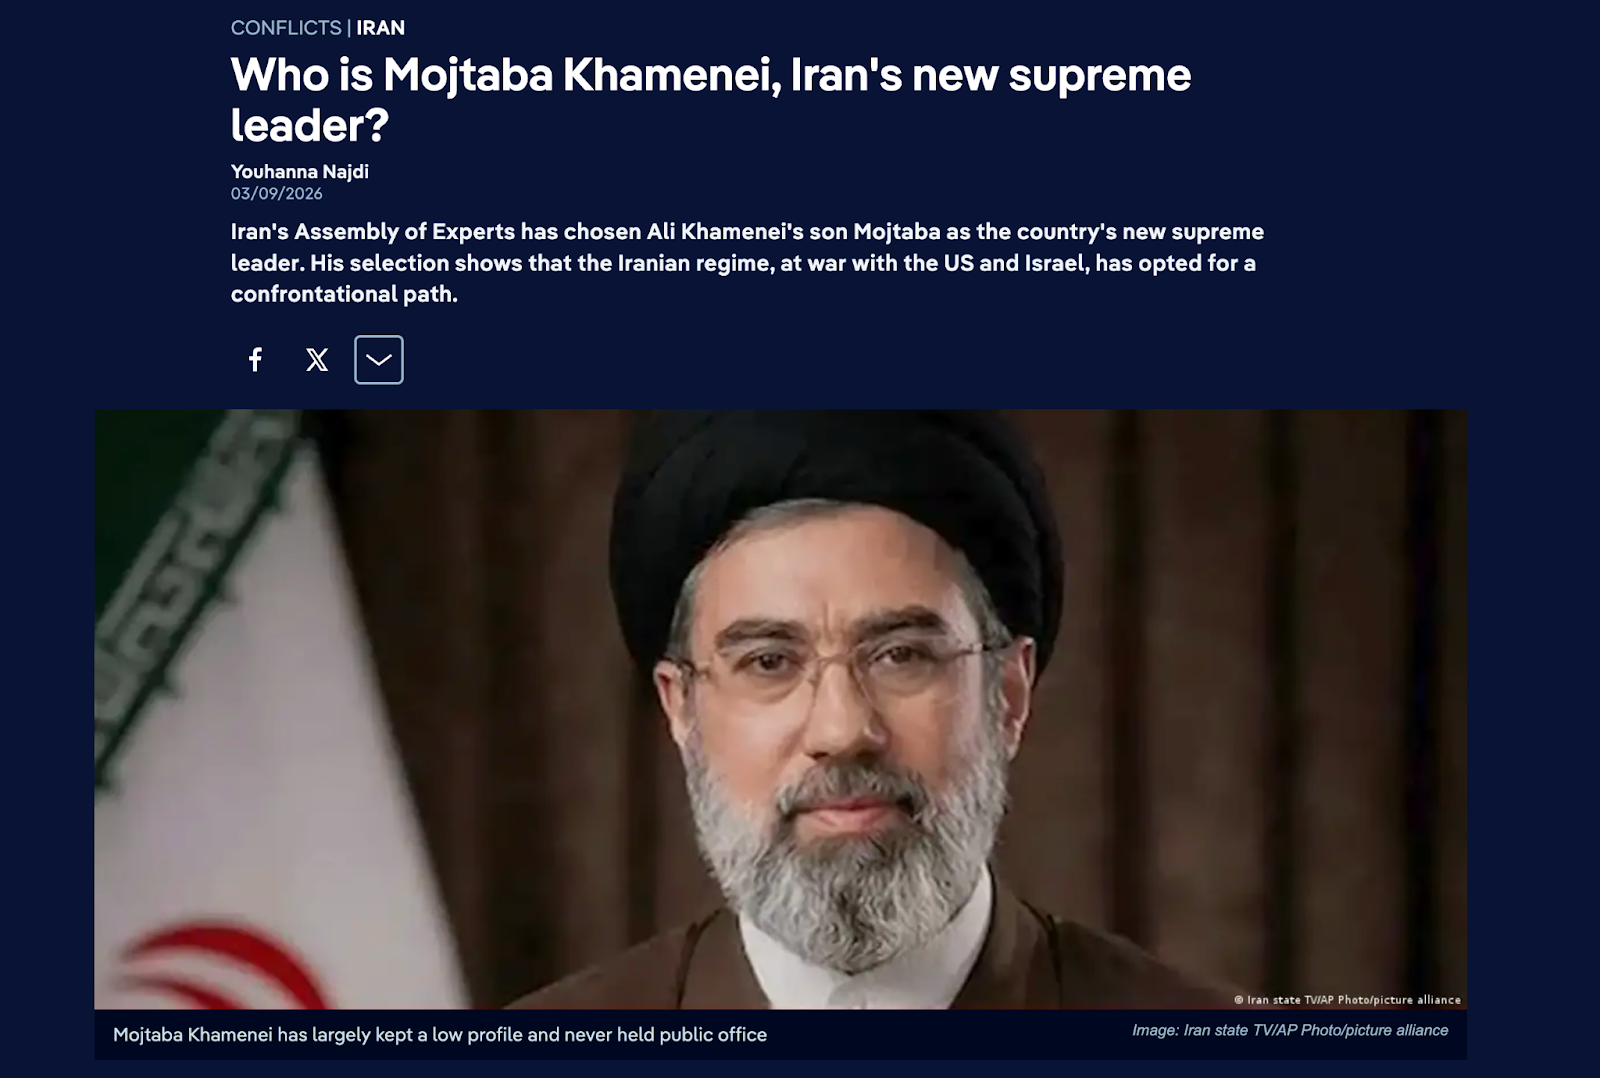
That caution matters because the leadership backdrop in Iran has become less reassuring, not more. Mojtaba Khamenei is widely described as a hardline figure with close ties to the regime’s security apparatus, which reduces confidence in a quick or easy de-escalation path. The market may still be right to expect normalization by late April. It may also be underestimating how quickly a geopolitical risk premium can return if the rhetoric hardens again.
Now Let’s Talk Crypto
Bitcoin’s behavior during the initial shock was more constructive than many expected. On March 2, the day before the KOSPI’s worst session, BTC was up around 5.6% and trading near $69,000 even as oil and currency markets were already reacting to war fears. When the broader selloff deepened on March 3, BTC pulled back to roughly $66,000 before recovering. It has since stabilized and is trading back above $70,000 as of the latest market check.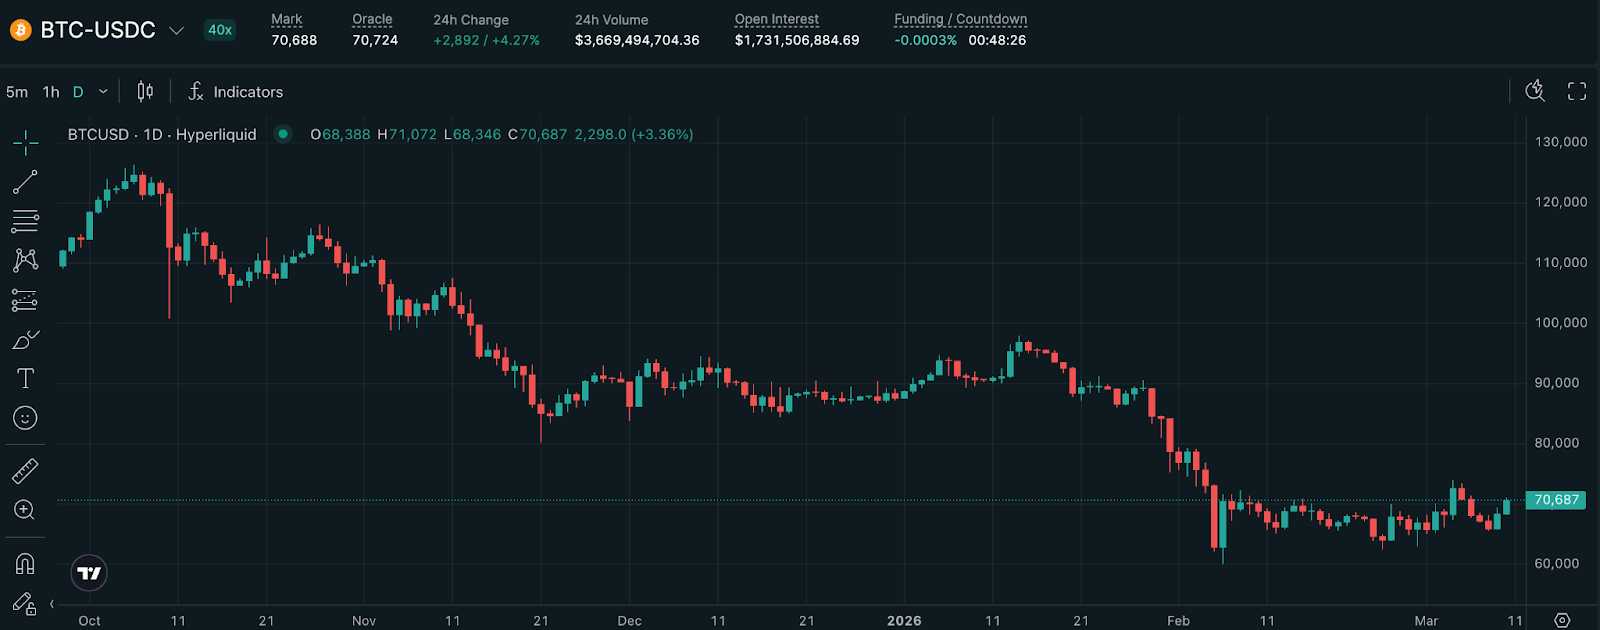
That relative resilience has revived the digital gold discussion, and at a minimum, it is worth taking seriously. BTC held up materially better than Korean equities, Japanese equities, and most regional risk assets during the initial shock. At the same time, the negative flip in the kimchi premium suggests Korean investors were selling crypto to meet margin pressure rather than buying it as a safe haven.
That leaves the signal mixed. BTC’s resilience is notable, but one week is not enough to confirm a regime shift in how markets treat crypto during geopolitical stress.
The more important issue is the liquidation mechanism. BTC entered this period already down roughly 47% from its October 2025 high, and the August 2024 yen carry unwind remains the more relevant template. In that episode, crypto sold off because leveraged investors needed liquidity. If US equities roll over similarly, crypto is still likely to be sold alongside them.
The CLARITY Act would, under normal conditions be a meaningful tailwind for the asset class. In the current environment, however, regulation is a secondary story. Macro is still doing the heavy lifting. Spot demand still does not look urgent, which is another reason to be cautious about calling this the start of a durable move higher.
CRYPTONARY'S TAKE
To sum it up, Korea was one of the most exposed major markets in the world: a parabolic 150% run built on semiconductor concentration and retail leverage, meeting a genuine macro shock. It cracked first because it had the least cushion to absorb the hit. Think about how high-risk memecoins get sold off before BTC enters a correction.So now, the question is whether the forces that broke South Korea find another market that looks similarly fragile. US equities, still trading on stretched valuations with a compressed equity risk premium and growing stagflation risk, are the obvious candidate.
We are not predicting a US market crash as a certain outcome. Whether it does depends on how long the Strait stays disrupted and whether the conflict escalates or de-escalates.
Crypto sits downstream of that test. The structural bull case (e.g., Digital Gold, Capitalism 2.0, etc) has not been destroyed, but it has been suspended by a macro environment that is dominating everything else. BTC’s relative resilience is worth respecting, but if US equities roll over, crypto is still likely to roll with them. More importantly, the market may need clearer evidence of easing financial conditions before a durable recovery can take hold. In practical terms, that likely means waiting for rate cuts, or at least for the market to gain confidence that they are finally coming.
For now, the burden of proof remains on the bulls. We remain cautious and patient, and are not rushing to deploy back in size into the market…
KEY DATES AHEAD
- Mar 17-18: FOMC meeting. Tone on inflation and the rate path will be critical
- Ongoing: Polymarket Hormuz market (currently 73% by April 30) as a real-time de-escalation gauge
- Ongoing: Any credible ceasefire signal or Hormuz reopening announcement is the single most important catalyst to watch
This is a rapidly evolving situation. All data, prices, and market levels are as of late March 9 to early March 10, 2026. Conditions may have changed by the time of publication. We have done our best to capture the most accurate picture available at the time of writing.
Continue reading by joining Cryptonary Pro
$1,548 $1,197/year
Get everything you need to actively manage your portfolio and stay ahead. Ideal for investors seeking regular guidance and access to tools that help make informed decisions.
For your security, all orders are processed on a secured server.
As a Cryptonary Pro subscriber, you also get:
3X Value Guarantee - If cumulative documented upside does not reach 300% during your 12-month membership, you can request a full refund. Terms
24/7 access to experts with 50+ years’ experience
All of our top token picks for 2025
On hand technical analysis on any token of your choice
Weekly livestreams & ask us anything with the team
Daily insights on Macro, Mechanics, and On-chain
Curated list of top upcoming airdrops (free money)
3X Value Guarantee
If cumulative documented upside does not reach 300% during your 12-month membership, you can request a full refund.
Our track record speaks for itself
With over 2.4M tokens and widespread misinformation in crypto, we cut through the noise and consistently find winning assets.
Our track record speaks for itself
With over 2.4M tokens and widespread misinformation in crypto, we cut
through the noise and consistently find winning assets.


Frequently Asked Questions
Can I trust Cryptonary's calls?
Yes. We've consistently identified winners across multiple cycles. Bitcoin under $1,000, Ethereum under $70, Solana under $10, WIF from $0.003 to $5, PopCat from $0.004 to $2, SPX blasting past $1.70, and our latest pick has already 200X'd since June 2025. Everything is timestamped and public record.
Do I need to be an experienced trader or investor to benefit?
No. When we founded Cryptonary in 2017 the market was new to everyone. We intentionally created content that was easy to understand and actionable. That foundational principle is the crux of Cryptonary. Taking complex ideas and opportunities and presenting them in a way a 10 year old could understand.
What makes Cryptonary different from free crypto content on YouTube or Twitter?
Signal vs noise. We filter out 99.9% of garbage projects, provide data backed analysis, and have a proven track record of finding winners. Not to mention since Cryptonary's inception in 2017 we have never taken investment, sponsorship or partnership. Compare this to pretty much everyone else, no track record, and a long list of partnerships that cloud judgements.
Why is there no trial or refund policy?
We share highly sensitive, time-critical research. Once it's out, it can't be "returned." That's why membership is annual only. Crypto success takes time and commitment. If someone is not willing to invest 12 months into their future, there is no place for them at Cryptonary.
Do I get direct access to the Cryptonary team?
Yes. You will have 24/7 to the team that bought you BTC at $1,000, ETH at $70, and SOL at $10. Through our community chats, live Q&As, and member only channels, you can ask questions and interact directly with the team. Our team has over 50 years of combined experience which you can tap into every single day.
How often is content updated?
Daily. We provide real-time updates, weekly reports, emergency alerts, and live Q&As when the markets move fast. In crypto, the market moves fast, in Cryptonary, we move faster.
How does the 3X Value Guarantee work?
We stand behind the value of our research. If the documented upside from our published research during your 12-month membership does not exceed three times (3X) the annual subscription cost, you can request a full refund. Historical context: In every completed market cycle since 2017, cumulative documented upside has exceeded 10X this threshold.
TermsRecommended from Cryptonary


