Save 23% ($351) & Get a Free 1-1 Call with our Team ⏰ : 0d 2h 59m 43s
Mastering strategic accumulation: A guide to DCA and Value Averaging
In crypto, timing the market is tough but accumulating wisely isn't. Whether you're facing bull runs or brutal drawdowns, the right strategy can be the difference between chasing tops and building wealth.

Navigating the cryptocurrency market's volatility requires more than just passive participation, it demands a disciplined, strategic approach to accumulation. With each market rally and price retracement, opportunities emerge for those prepared to execute a structured buying strategy. Among the most effective methods for long-term growth are Dollar-Cost Averaging (DCA) and Value Averaging (VA).
While both strategies involve systematic investments over time, their execution and impact on portfolio growth are distinctly different. DCA follows a consistent investment schedule, accumulating assets at regular intervals, regardless of market conditions. VA, by contrast, adjusts contributions based on market performance, investing more during downturns and less during periods of growth, with the aim of meeting predefined portfolio growth targets.
This guide provides a detailed breakdown of both strategies, supported by a real-world simulation using Solana (SOL). Through quantitative analysis and strategic insights, we identify which method optimally maximises returns across varying market environments. Whether you seek passive consistency or adaptive market positioning, understanding the nuances of DCA and VA can enhance your approach to long-term crypto accumulation.
Understanding Dollar-Cost Averaging (DCA)
Dollar-Cost Averaging (DCA) is a straightforward accumulation strategy widely used by investors to mitigate the effects of market volatility. The concept is simple: invest a fixed amount of capital at regular intervals, regardless of the asset's current price. This approach aims to reduce the emotional bias of trying to time the market, allowing investors to build their positions systematically over time.How DCA works
The fundamental premise of DCA is to buy more assets when prices are low and fewer assets when prices are high, effectively averaging the purchase price over time. This gradual accumulation can help mitigate the effects of market volatility, making it particularly attractive in unpredictable or bearish market conditions.
DCA simulation: $100,000 USDC into Solana (SOL)
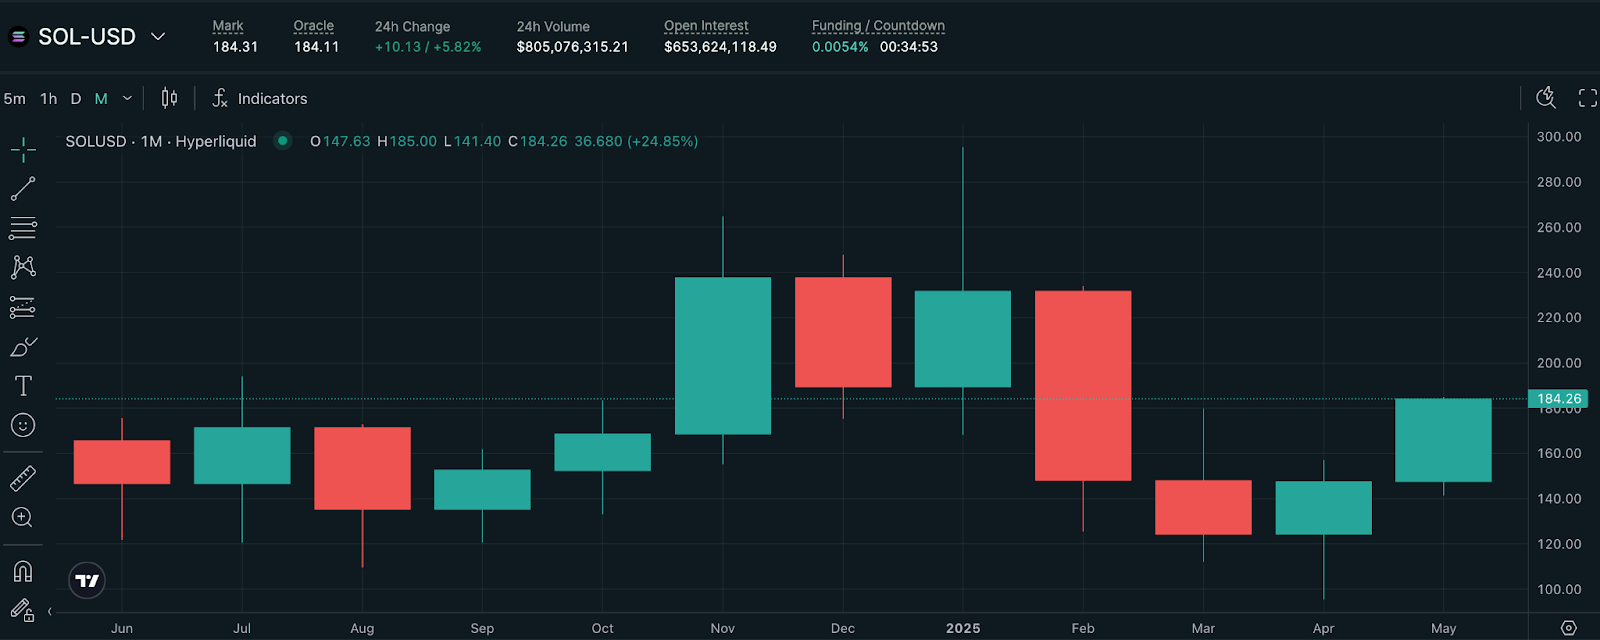
To put theory into practice, we simulated a DCA strategy using Solana (SOL) over a 12-month period from June 2024 to May 2025. Here are the parameters used:- Total Investment: $100,000
- Investment Period: June 2024 to May 2025 (12 months)
- Monthly Investment: $8,333.33
DCA table: Monthly investments in SOL (June 2024 - May 2025)

Results:
- Total SOL Acquired: 617.35 SOL
- Average Cost per SOL: $162.00
- Portfolio Value (May 22, 2025 - at $185.00 per SOL): $114,209.75
- Net Gain: $14,209.75
- ROI: 14.21%
Time-Weighted Average Price (TWAP) comparison
When evaluating the effectiveness of Dollar-Cost Averaging (DCA), a critical benchmark to consider is the Time-Weighted Average Price (TWAP). Unlike DCA, which executes purchases at fixed intervals, TWAP represents the average price of an asset over a specified period, accounting for all price fluctuations weighted by the time spent at each level. It is often used as a measure of market efficiency, capturing the true average cost of acquiring an asset over time.The TWAP of $183.64 was calculated by averaging the daily closing prices of SOL from June 1, 2024, to May 1, 2025, weighted by the time spent at each price level. For the investment period, this indicates that, on average, SOL traded at $183.64 throughout the year.
In contrast, the DCA strategy managed to acquire SOL at an average cost of $162.00, significantly below the TWAP benchmark. This reflects DCA's ability to capture value during market dips, effectively lowering the average purchase cost compared to the market's weighted average.
Did DCA truly outperform?
At first glance, DCA appears to have outperformed the TWAP by securing SOL at a lower average cost. However, this outperformance comes with caveats:- Rigid scheduling during market highs
- Lack of price sensitivity
Key takeaway
In highly volatile markets like cryptocurrency, where price swings are dramatic, a more flexible strategy, one that actively adjusts contributions based on market conditions may significantly boost returns.
In the next section, we will explore Value Averaging (VA), a strategy designed specifically to address DCA's limitations by dynamically adjusting capital deployment based on market performance.
Understanding Value Averaging (VA)
Value Averaging (VA) is a tactical accumulation strategy that dynamically adjusts investments based on market conditions and portfolio performance. Unlike Dollar-Cost Averaging (DCA), which invests a fixed amount at regular intervals, VA sets a specific growth target for the portfolio each month. If the portfolio value falls short of this target, you invest more to meet the shortfall. Conversely, if the portfolio exceeds the target, you invest less or even pause buying entirely. This adaptive approach allows for aggressive accumulation during market downturns and capital preservation during price surges, optimizing the average cost per unit.How VA works
At its core, Value Averaging (VA) is designed to achieve specific growth milestones at regular intervals through strategic capital deployment. In this example, the goal is to grow the portfolio by $8,333.33 per month over a 12-month period, fully investing $100,000 by the end of the cycle. At the start of each month, the portfolio's current value is measured against the predefined growth target:- If the portfolio value falls short, additional USDC is deployed to make up the difference.
- If it exceeds the target, new investments are paused, preserving liquidity for better opportunities.
VA simulation: $100,000 USDC into Solana (SOL)
To evaluate the effectiveness of Value Averaging (VA), a simulation was performed with $100,000 allocated to Solana (SOL) over a 12-month period, spanning from June 1, 2024, to May 1, 2025. The strategy was designed with structured parameters and strict allocation rules aimed at optimizing entry points while preserving capital during market tops.Parameters:
- Total Investment: $100,000
- Investment Period: June 1, 2024, to May 1, 2025 (12 months)
- Target Growth Rate: $8,333.33 increase per month
- Price Below $125: Deploy up to 20% of the total USDC allocation ($20,000 max).
- Price Between $125 and $190: Deploy a balanced amount to meet the target.
- Price Above $190: No deployment to avoid overpaying during speculative rallies.
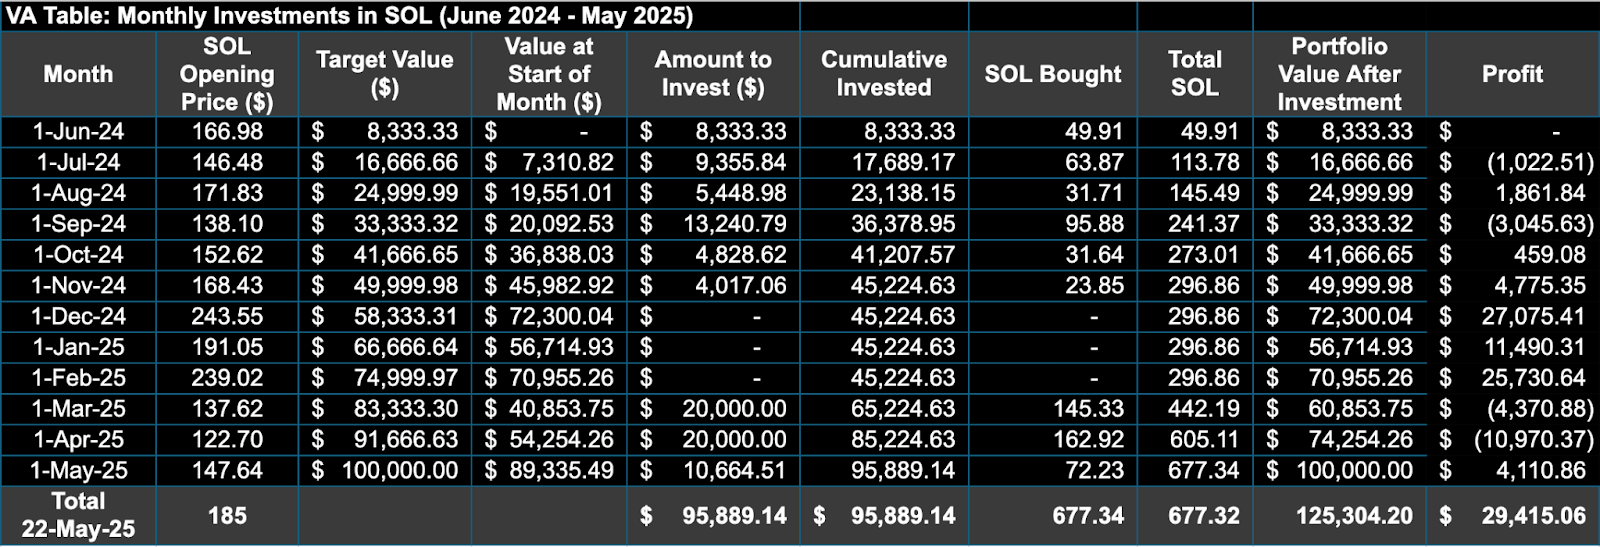
Results:
- Total SOL Acquired: 677.34 SOL
- Average Cost per SOL: $141.574
- Total Capital Deployed: $95,889.14
- Portfolio Value (May 22, 2025 - at $185.00 per SOL): $125,304.20
- Net Gain: $29,415.06
- ROI: 30.68%
Capital deployment insights
Unlike the DCA strategy, which fully deployed $100,000, VA only allocated $95,889.14, keeping over $4,100 in reserve. This efficiency came from avoiding entries during overheated price action-like in December 2024 when SOL spiked to $243.55-preserving liquidity for better opportunities.- April 2025: SOL fell to $122.70, triggering the maximum $20,000 allocation and acquiring 162.92 SOL.
- March 2025: Another $20,000 was deployed when SOL was at $137.62, adding 145.33 SOL to the stack.
Enhancing VA with Strategic Selling (Optional)
While this simulation focused solely on accumulation for clarity, Value Averaging can be further optimized by incorporating strategic selling at predefined price levels. For example, selling 20% of SOL holdings when the price exceeds $250 can lock in profits during euphoric market spikes and free up capital for redeployment during corrections. This enhancement adds a profit-taking layer to VA without compromising its core accumulation objective.Risks of DCA and VA strategies
Though both strategies are designed to optimize returns, each comes with trade-offs:DCA Risks: DCA's rigid schedule ensures consistent exposure but can lead to buying at local tops (e.g., $243.55 in December 2024), inflating the average cost and reducing upside. It also fails to take full advantage of deep market dips due to its fixed cadence.
VA Risks: VA's aggressive deployments during market downturns (e.g., $20,000 in April 2025) can expose investors to short-term drawdowns if the price continues to decline. However, its ability to pause during overheated markets (e.g., above $190) helps preserve capital and manage risk.
Recognising these trade-offs is essential when selecting a strategy that fits your risk tolerance and market outlook.
Visual representation: DCA vs. Value Averaging portfolio growth
To illustrate the performance difference between DCA and VA, the following charts display portfolio growth and profit/loss (PNL) over time for both strategies.
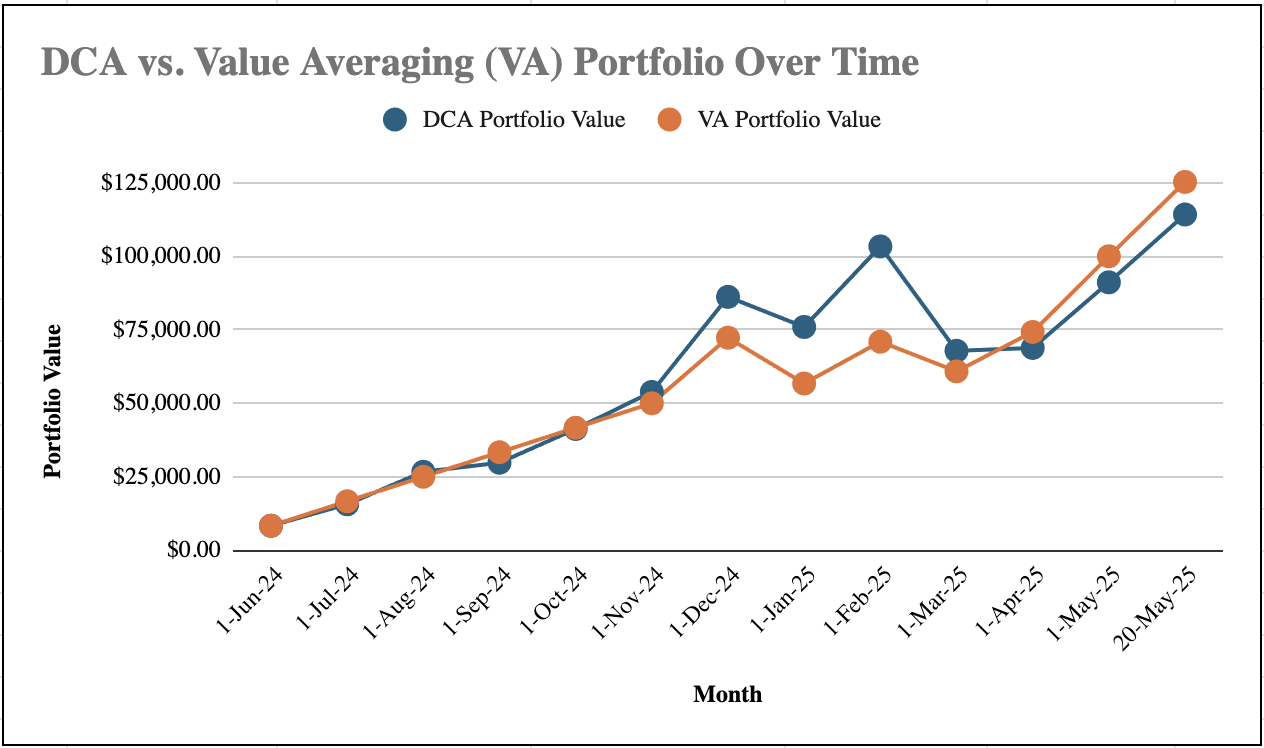

The first chart shows cumulative portfolio value from June 2024 through May 20, 2025. Despite deploying only $95,889.14-compared to DCA's full $100,000-VA consistently pulled ahead. By investing more aggressively during drawdowns and stepping back during overheated conditions, VA captured greater upside with less capital.
This divergence becomes especially clear after February 2025, when VA's heavier allocations during the March and April lows translated into stronger recovery and a higher final portfolio value.
The second chart compares monthly PNL between DCA and VA. While both strategies experienced periods of drawdown, VA rebounded faster and closed the period with a significantly higher realized gain - both in absolute dollars and return on invested capital.
Automating with Jupiter aggregator
For users looking to simplify execution while still capitalizing on volatility, Jupiter Aggregator offers a powerful Recurring DCA Tool that automates stablecoin accumulation into SOL at predefined intervals and price ranges. This tool is particularly useful for long-term investors who want to automate entries, avoid emotional buying, and never miss dips. Unlike traditional DCA, Jupiter lets you set custom price triggers, making it a hybrid between passive investing and tactical accumulation.Optimal setup for Dip-focused accumulation
If you're looking to accumulate SOL specifically during market dips, you can configure the tool to execute only when the price falls within your chosen range. Here's an example configuration: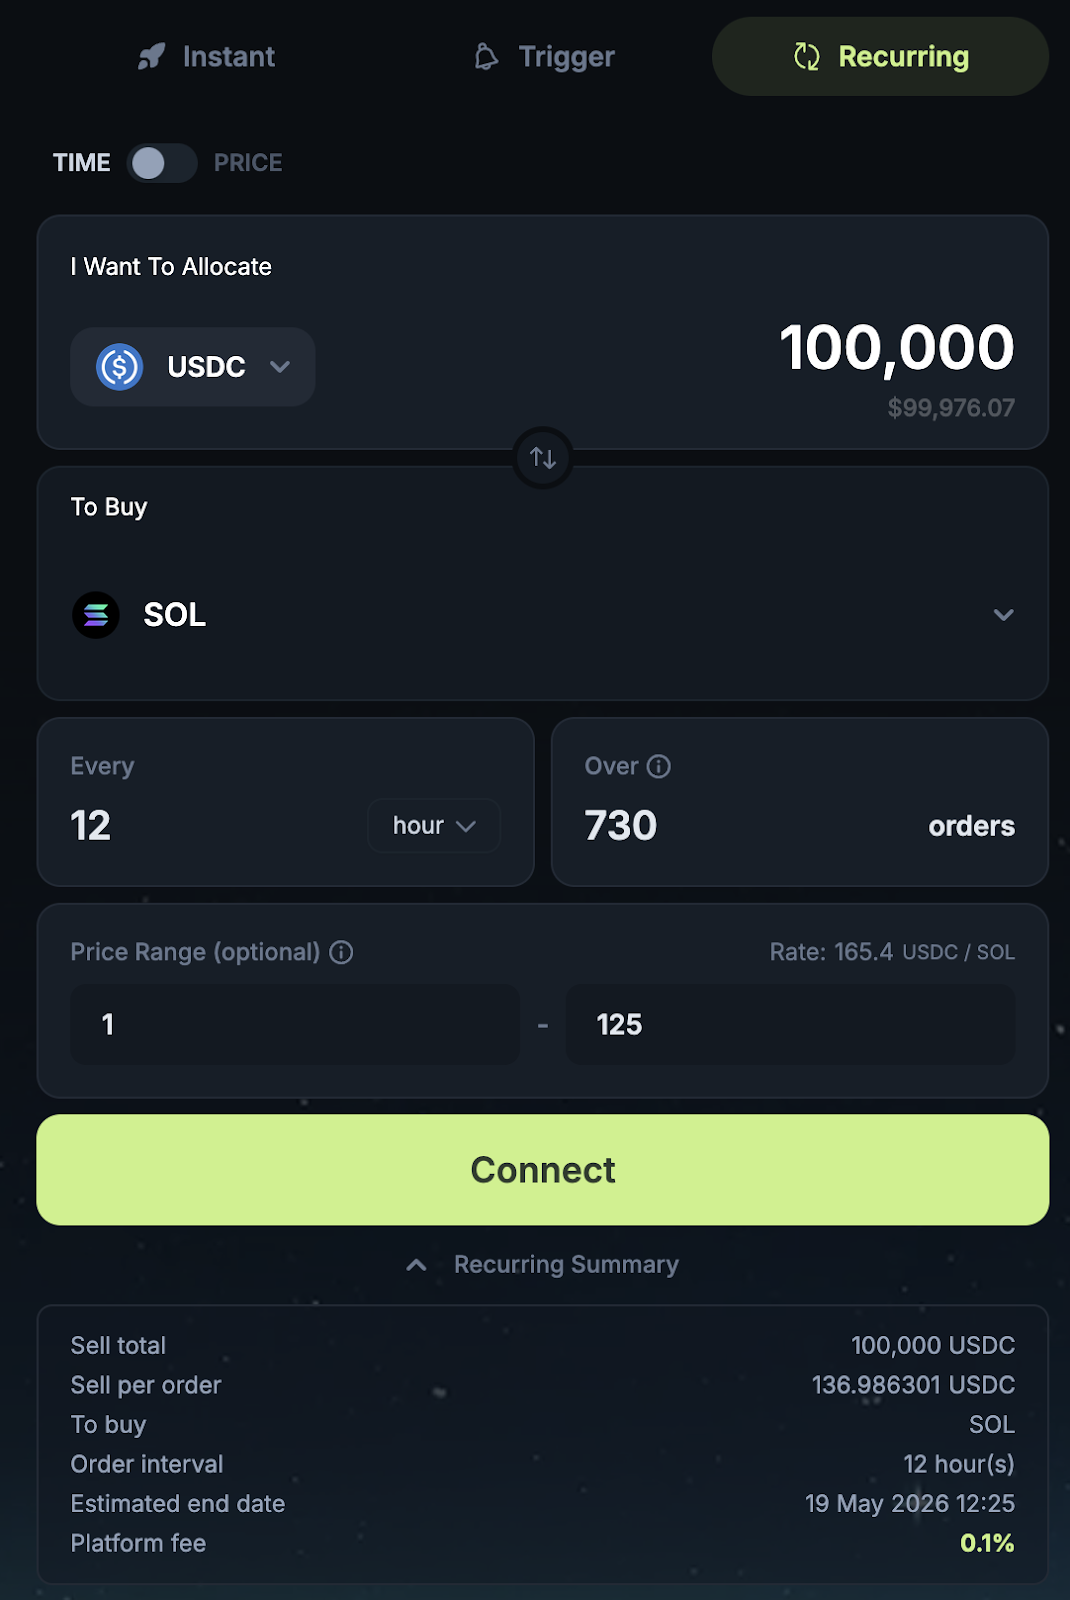
- Min Price: $1: ensures orders are always filled under your $125 ceiling, even during flash crashes.
- Max Price: $125 : avoids deploying capital above the specified threshold.
Why this matters
By combining time-based DCA with price-based filters, this strategy ensures:- Consistent, automated execution without manual intervention.
- Capital efficiency by concentrating buys during favorable price ranges.
Cryptonary's take
When it comes to strategic accumulation, Value Averaging (VA) consistently outperformed Dollar-Cost Averaging (DCA) across every meaningful metric. Despite deploying only $95,889 compared to DCA's full $100,000, VA ended the 12-month simulation with a larger SOL position (677.34 vs. 617.35), a lower average cost basis, and a higher final portfolio value of $125,304.20-delivering a net gain of $29,415.06 versus DCA's $14,209.75.VA's edge lies in its flexibility. By adjusting investments based on market performance, it aggressively allocates during dips and conserves capital during peaks. This allowed it to sidestep poor entries like the December 2024 spike, while doubling down during underpriced periods like March and April 2025. DCA, while consistent and easy to automate, ignores market conditions and often overpays during rallies.
For passive investors, DCA remains a solid baseline-especially when automated via tools like Jupiter Aggregator. But for those looking to actively optimise long-term accumulation and extract more upside from volatility, Value Averaging offers a structurally superior alternative. Both tools can be used to accumulate any other blue-chip asset and not only SOL.
Cryptonary, OUT!
Recommended from Cryptonary


