Log in

Research Report

May 2021: How Bullish for Crypto?

Updated: Aug 31, 2024
Published: May 9, 2021
0
Share:

First we'll start off with a brief summary of the data that communicates the general idea in a very simple manner. If you want to delve deeper into the details we highly recommend reading the full journal.

Post Feature Image

What we've done with this analysis is we have computed the average weekly returns spanning between 2014 and 2020 for BTC, ETH, Total Market Cap index and Alts Market Cap index. We then analysed this data to project which weeks are likely to deliver the most returns given that Q2 is highly bullish. We've created this analysis as we are using it ourselves to pinpoint when we want to start trimming positions and fully rotate out of sh*tcoins (i.e. sell them in full) to avoid bag-holding.

Before you proceed, please note that this data is based on averages and just because it happened in the past, it does not mean it will play out again. With that being said, we personally believe what Mark Twain once stated:

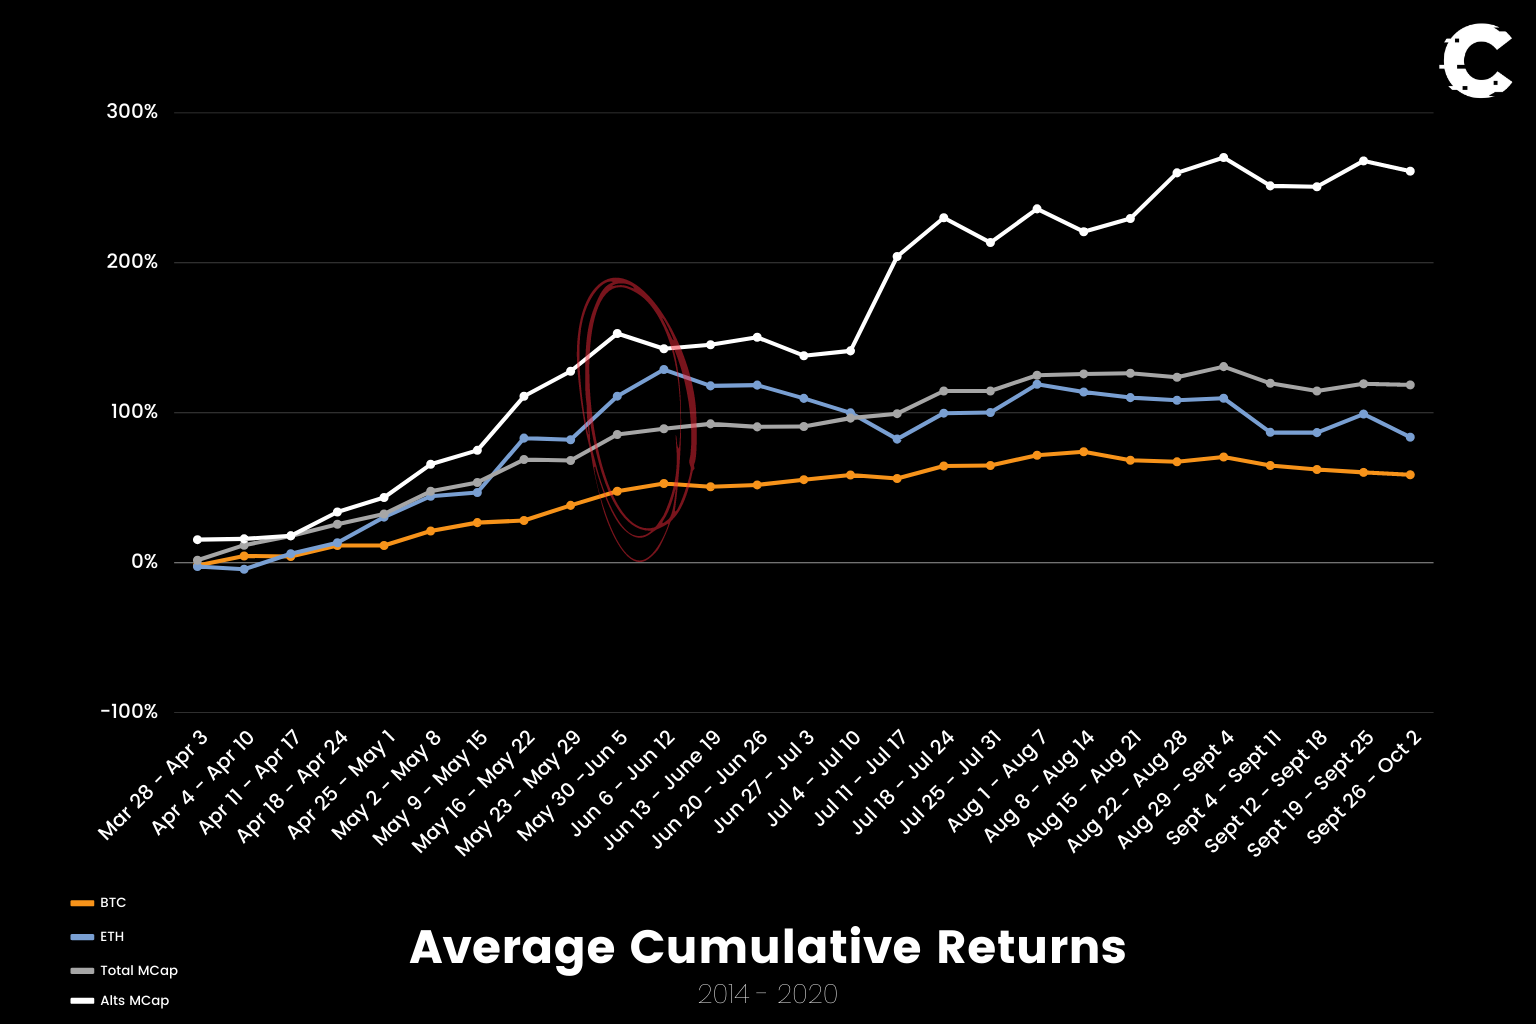
"History doesn't repeat itself but it often rhymes"
As this section is just a summary, we've taken all the data and plotted the "Cumulative Returns" delivered by each of these assets/indexes.
Disclaimer: NOT FINANCIAL NOR INVESTMENT ADVICE. Only you are responsible for any capital-related decisions you make and only you are accountable for the results. Past performance is no guarantee of future results

TLDR

  • The accelerated rallies have happened in May and ended in mid-June.
  • Mid-June till September is where the market tends to see weakness from buyers.
  • Market tends to bounce in July, with Alts rebounding hard (usually mid-July) before stalling again.
  • 2021 volatility was very high which means the periods of stalling showing on the graph below will likely be periods of corrections this year.
  • Q3 correction is likely.
  • Red circled area is where we speculate the top may form.
The most bullish weeks, based on historic data, are:
  • May 16 - May 22
  • May 30 - June 5
aligncenter size-full wp-image-88871

No matter how much data one gathers, it is impossible to determine exactly when the top will form but we can get pretty close to it and that is what we aim to achieve here.


Detailed Analysis

The data will range all the way from April into September to give a prolonged view as to what is most likely to occur over multiple months. We will breakdown the returns on both monthly and weekly timeframes on: BTC, ETH, Total MCap & Alts MCap. 👇

Bitcoin

First and foremost we will start with BTC, the largest cryptocurrency by market cap. Let's start with the monthly returns:

aligncenter size-full wp-image-88777

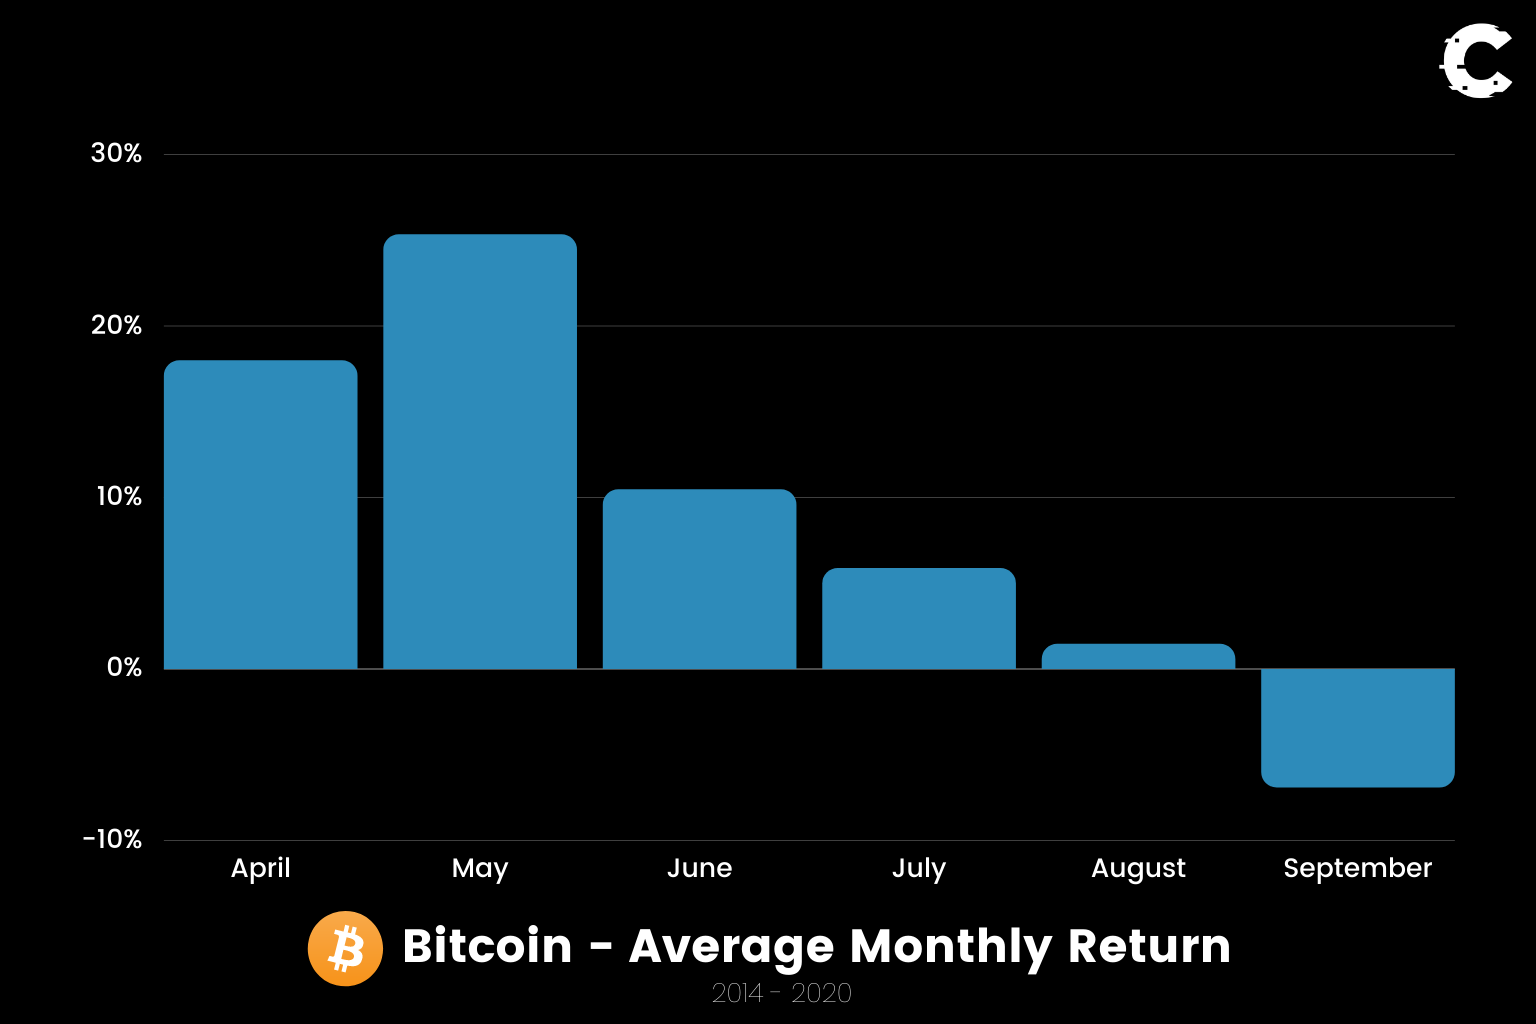
The general consensus is that the second quarter (Q2) which spans from April till end of June is a bullish period for BTC. The most bullish month out of them being May. On the other hand, Q3 is not as bullish and tends to be choppy (stagnation) or bearish. Given the fact that we've seen a very sharp rise in price, the most probable outcome is a Q3 correction between August and September.

Now that we've pin-pointed which months have been the most bullish/bearish, let's zoom in a bit further to see which weeks in particular were responsible for the majority of the returns:

aligncenter size-full wp-image-88771

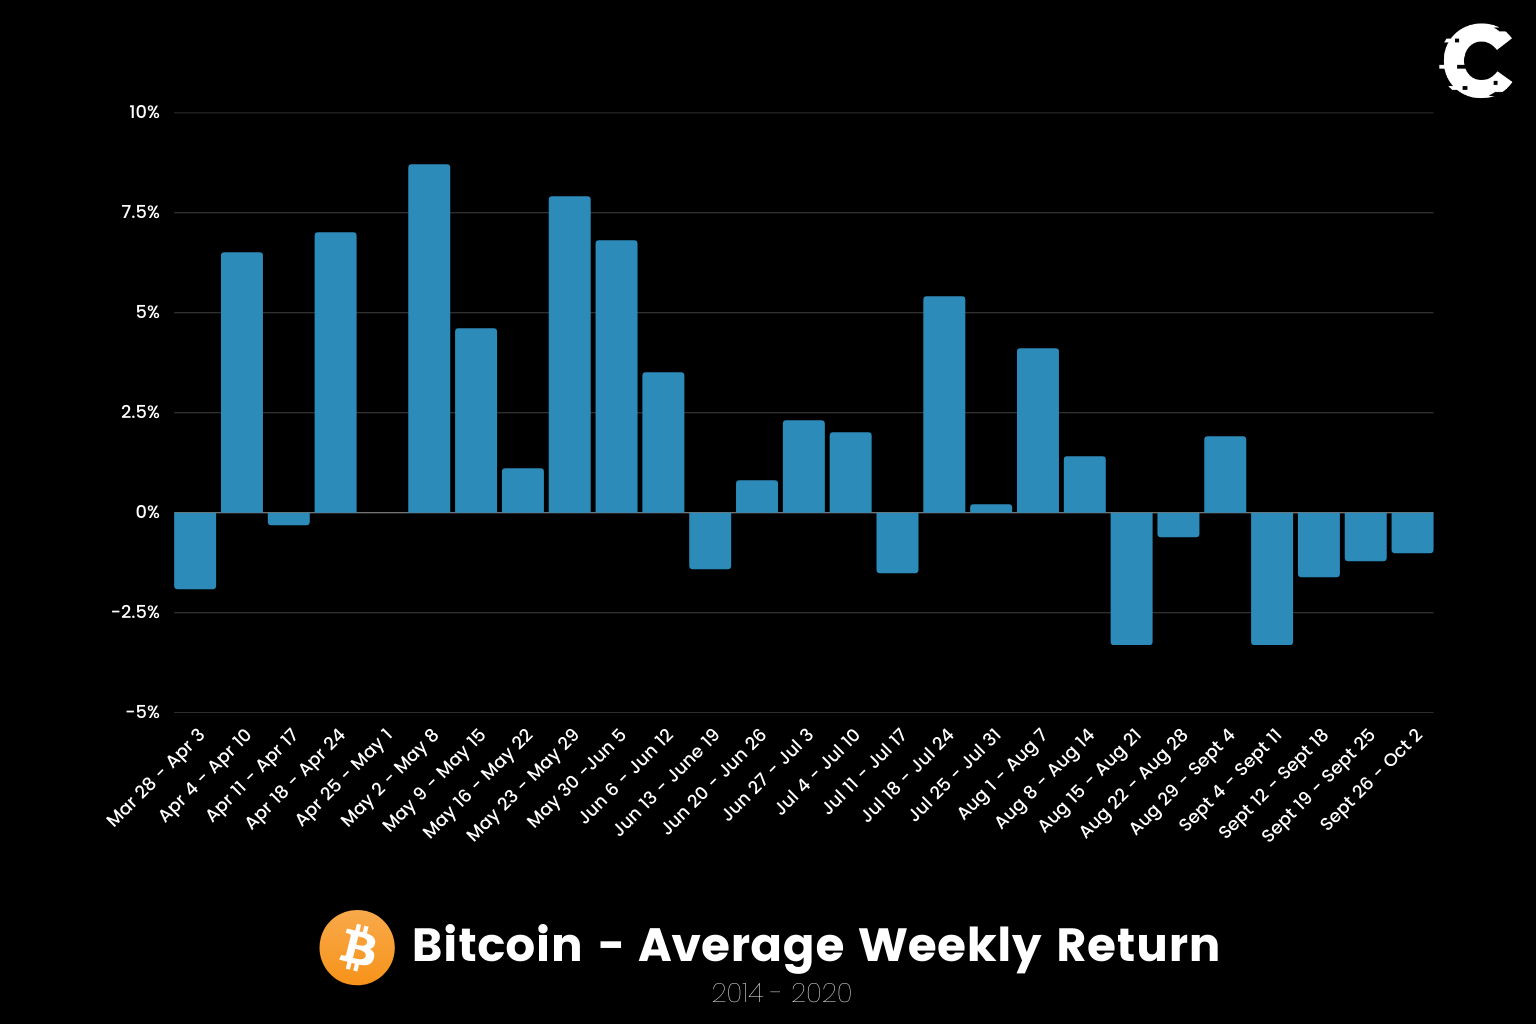
Overall it's obvious that the majority of returns statistically happen before mid-June. It is factually correct that Bitcoin's price does grind up after mid-June slightly but the market strength starts dissipating. We have seen larger than usual returns this year and hence when the strength dissipating it is more likely that the market corrects.

Today is May 9th, the week ahead has historically brought an average of +4.60% for Bitcoin's price. The larger returns spanned between May 23rd till June 12th.

Ether

Next, we will analyse ETH's historic returns; starting with average monthly returns:

aligncenter size-full wp-image-88779

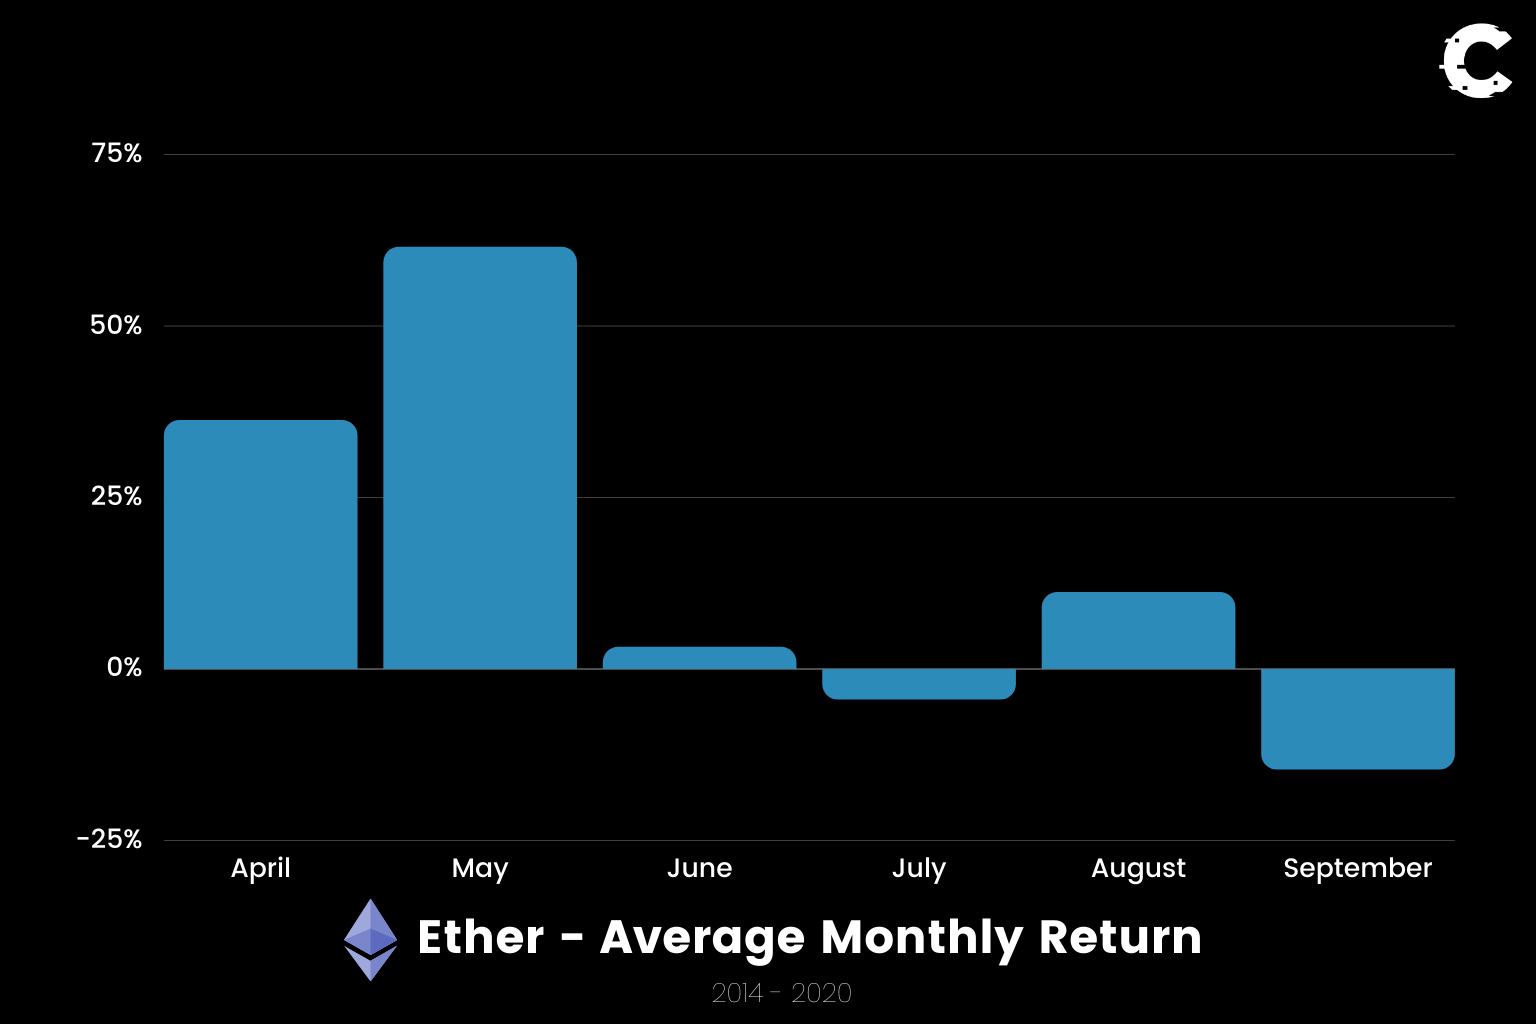
The same conclusion of Bullish Q2 can be stated here for ETH as well, with May being more bullish for price than April - which at this point may have become obvious with ETH approaching $4,000. Q3 is where ETH weakens on average and hence planning accordingly may be beneficial.

Now let's zoom-in using the weekly returns:

aligncenter size-full wp-image-88773

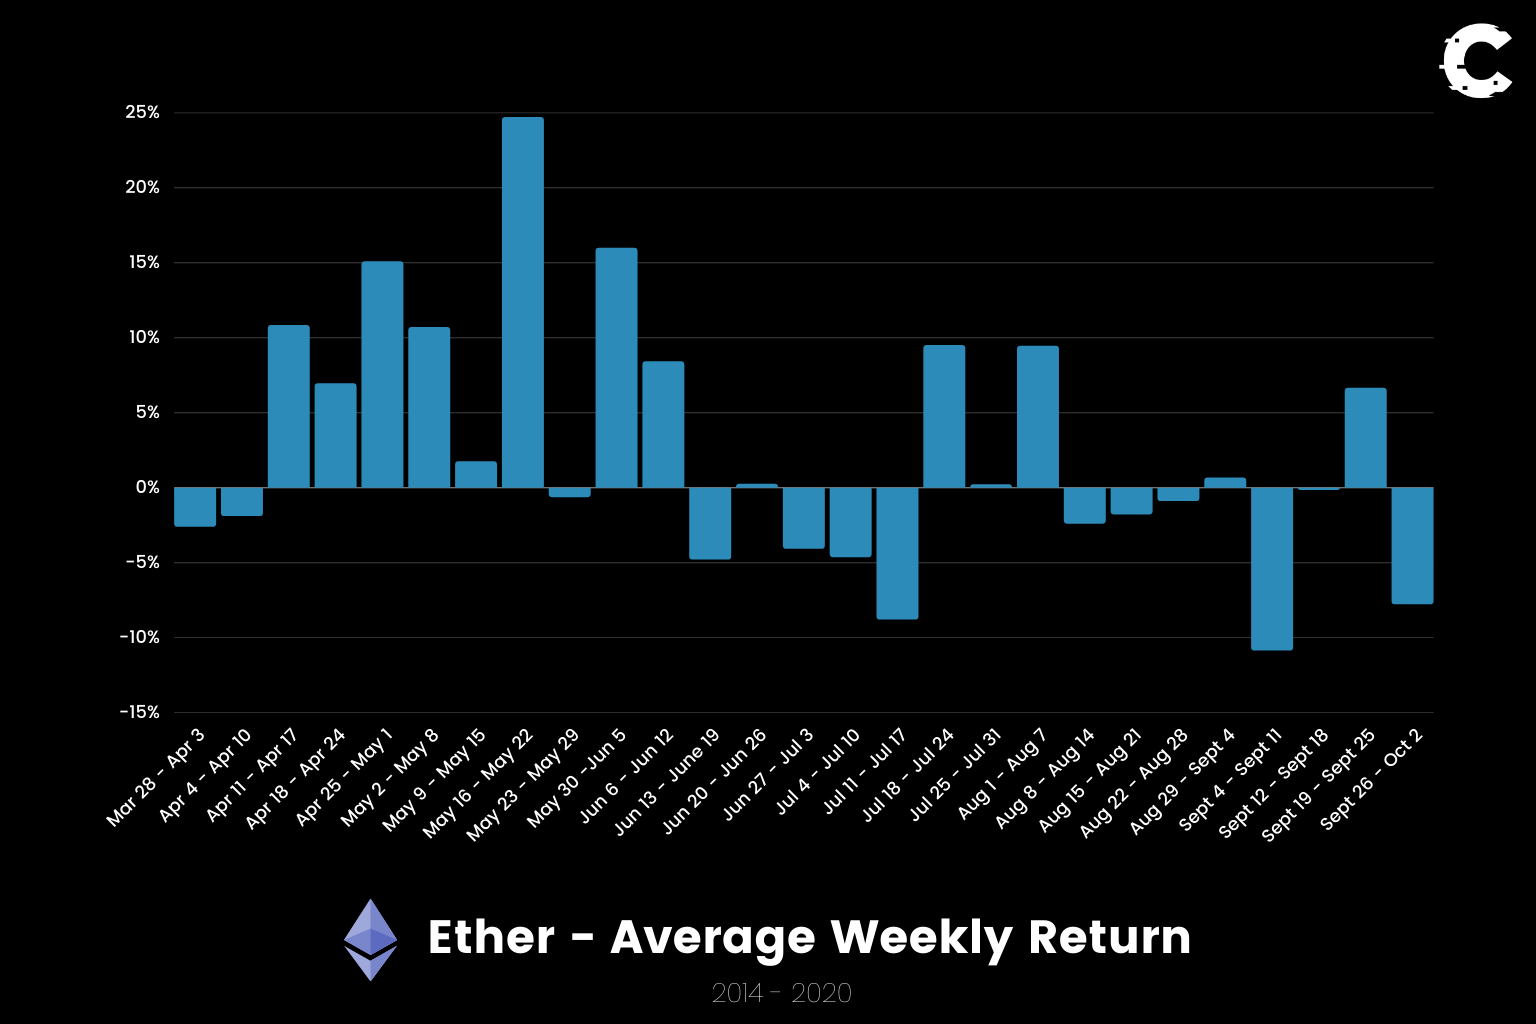
The same observations from BTC can be applied here but let's look at individual weeks (today is May 9th) - we're looking at the most interesting ones only:

  • May 9 - May 15: +2%
  • May 16 - May 22: +25%
  • May 23 - May 29: -1%
  • May 30 - June 5: +16%
  • June 6 - June 12: +8%
  • June 13 - June 19: -5%
This week is likely to be a stagnation week for ETH if we were to base our theory on statistics. The week after it has historically been the most bullish individual week in Q2/Q3 which we're highly looking forward to.

End of May till mid-June will likely be bullish after which price action has historically weakened.

Total Market Cap

Now we will take a look at the entire market through the Total MCap index, starting off with average monthly returns:

aligncenter size-full wp-image-88781

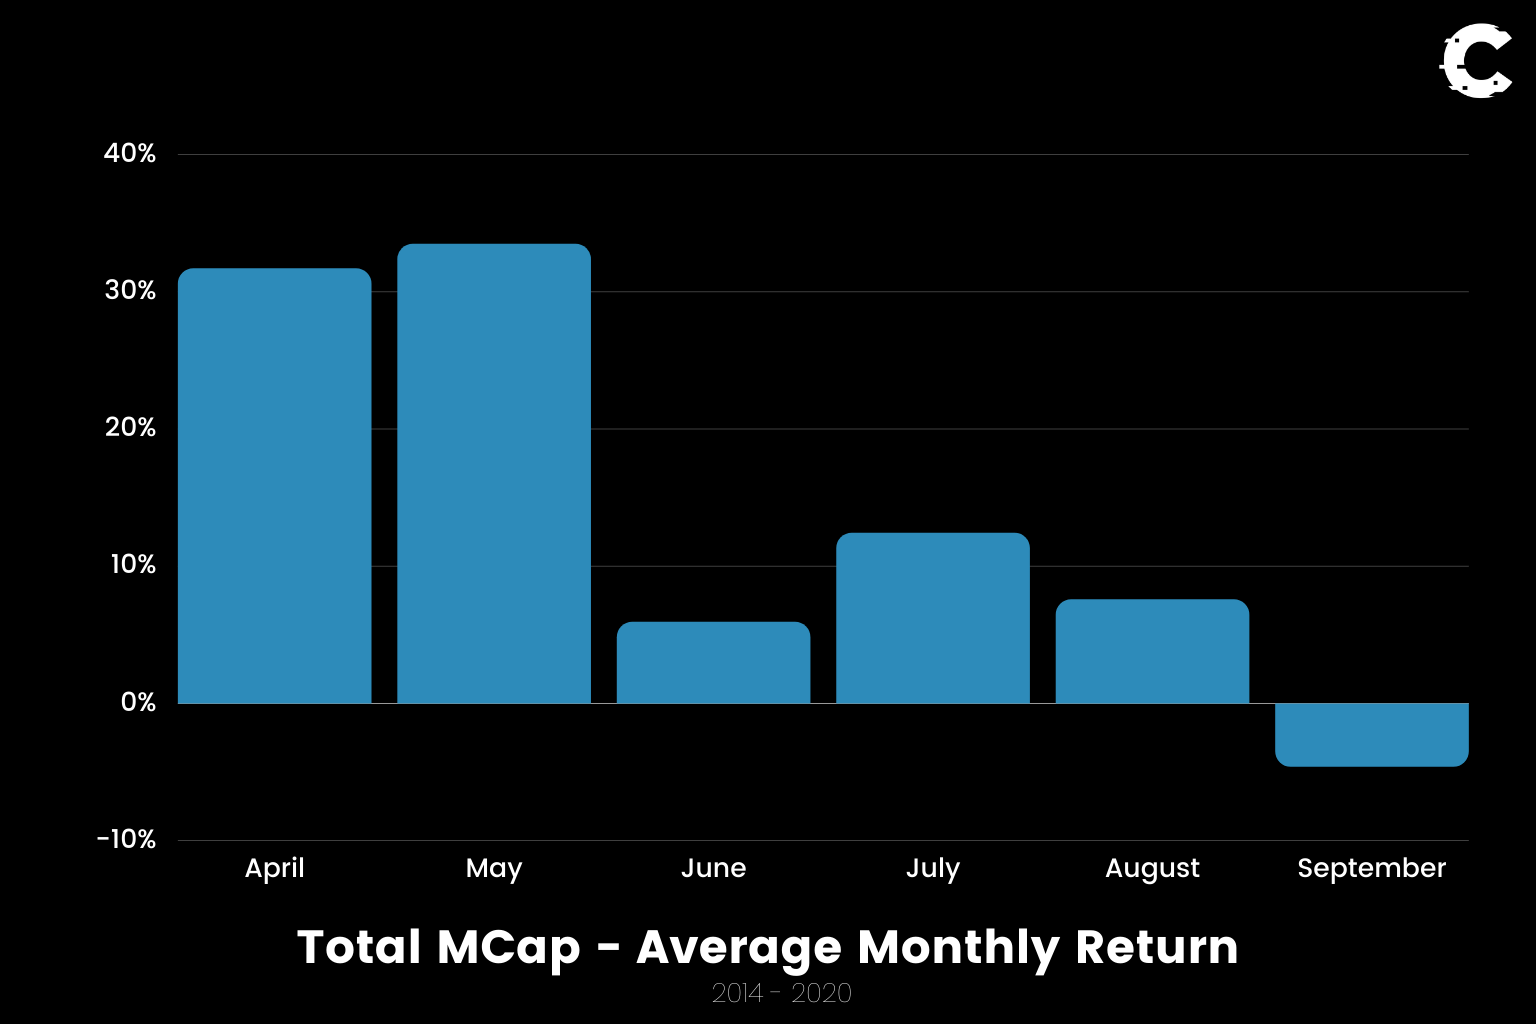
The similarities are very strong, with April/May being very bullish, followed by a weaker June, a rebound in July and weakness showing up again in the market in August and intensifying in September. Now let's zoom in:
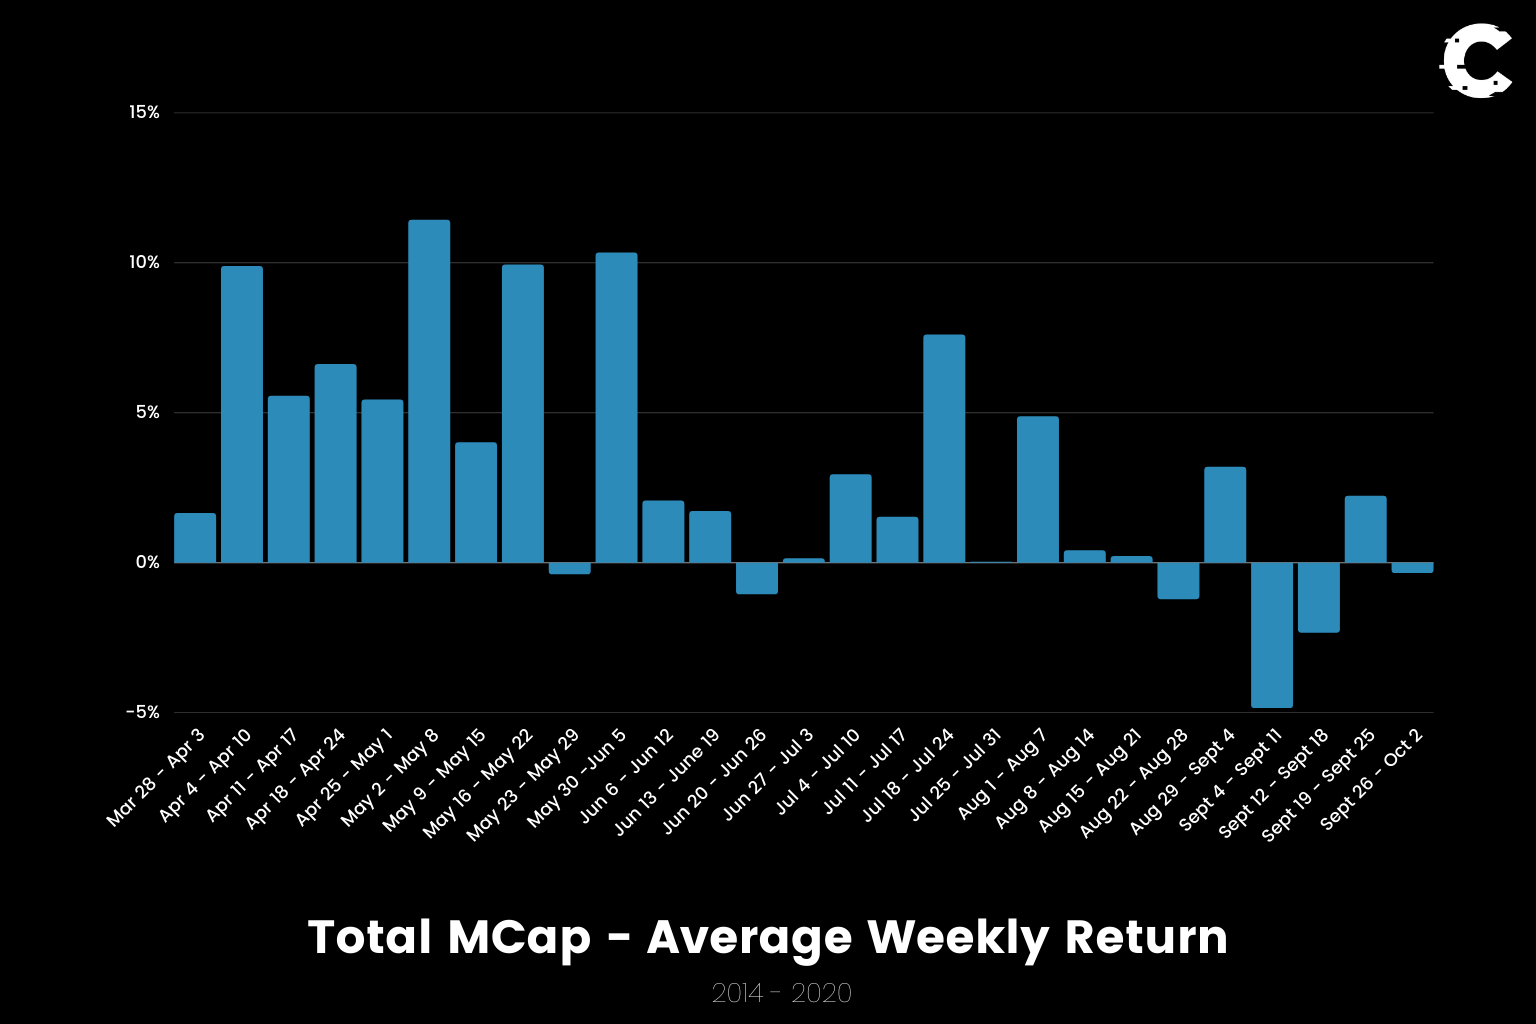
aligncenter size-full wp-image-88775

  • May 9 - May 15: +4%
  • May 16 - May 22: +10%
  • May 23 - May 29: -0.5%
  • May 30 - June 5: +10%
  • June 6 - June 12: +2%
  • June 13 - June 19: +2%
Two weeks stand out for the market overall and that is May 16 till May 22nd and May 30th till June 5th.

Altcoins Market Cap

If we remove Bitcoin from the Total MCap we'll be left with a clear image on what happens to Altcoins on average.

aligncenter size-full wp-image-88783

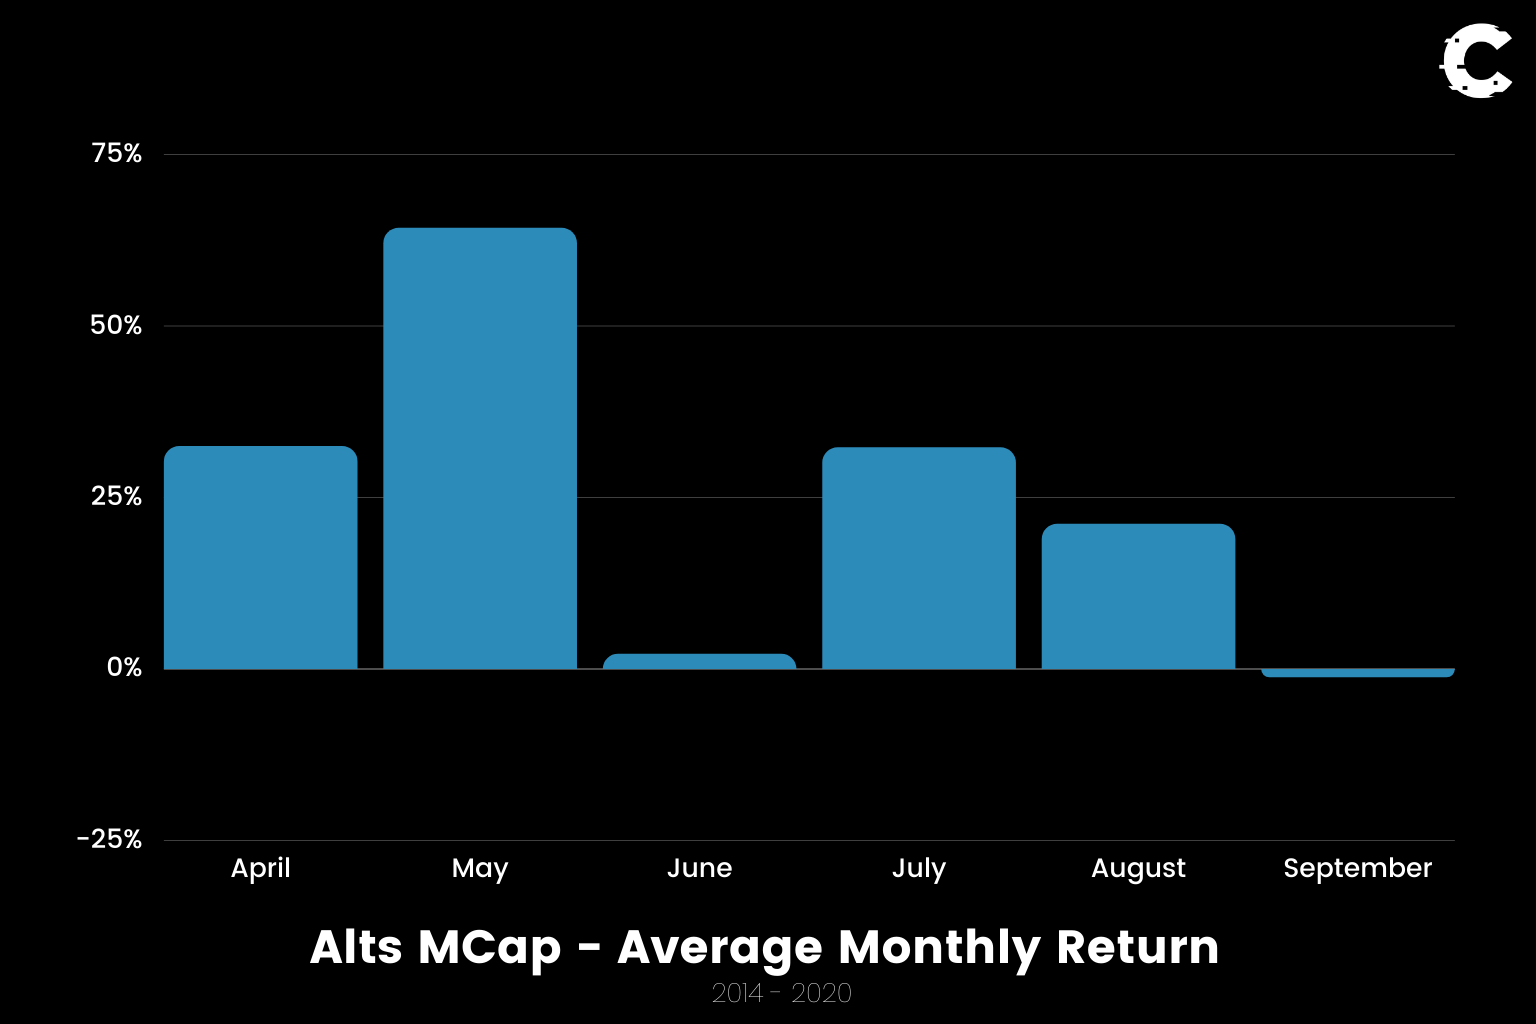
If we were to breakdown this data it would be as simple as: April is bullish, May even more so while June is generally weak with a rebound in July before more weakness. Of course this is an average and not a 100% predictive model.
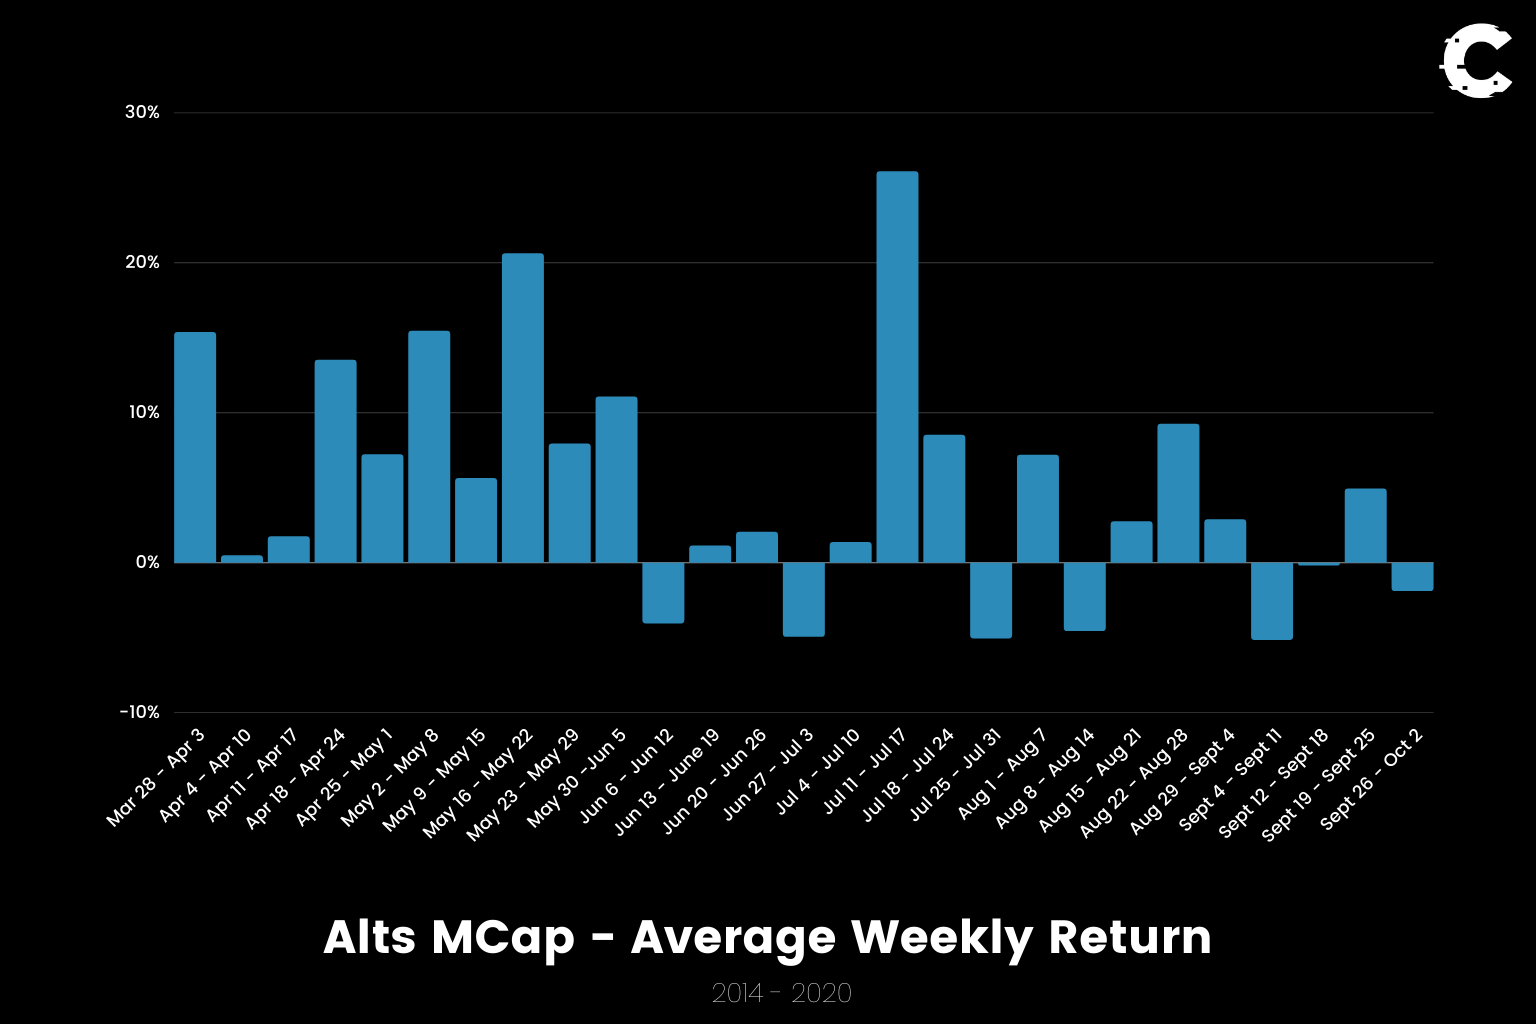
aligncenter size-full wp-image-88769

  • May 9 - May 15: +6%
  • May 16 - May 22: +21%
  • May 23 - May 29: +8%
  • May 30 - June 5: +11%
  • June 6 - June 12: -4%
  • June 13 - June 19: +1%
The same two weeks are highly bullish for Altcoins based off of history but two other particular weeks stand out: 11-17 & 18-24 July with a +26% and +9% return respectively. If we overlay this with the Total MCap returns, we know that July is usually a rebound/bounce period but it is now clear that Alts have historically delivered an outstanding return in those weeks compared to BTC or even ETH.

For the conclusion and summary please scroll up and read the TLDR section at the start of the journal.

100% Success Money Back Guarantee

If our approach doesn’t outperform the overall crypto market during your subscription, we’ll give you a full refund of your membership. No questions asked. For quarterly and monthly subscribers this is applicable once your subscription runs for 6 consecutive months.

Terms & Conditions apply

Star

Trusted by 300,000+ traders

Take your next step towards crypto success

Save 50%

$799/year

Get everything you need to actively manage your portfolio and stay ahead. Ideal for investors seeking regular guidance and access to tools that help make informed decisions.

VisaCardImageMsCardImageCoinbaseCardImageSolanaCardImage

For your security, all orders are processed on a secured server.

What’s included in Pro:

  • Success Guarantee, if we don’t outperform the market, you get 100% back, no questions asked

  • 24/7 access to experts with 50+ years’ experience

  • All of our top token picks for 2025

  • Our latest memecoins pick with 50X potential

  • On hand technical analysis on any token of your choice

  • Weekly livestreams & ask us anything with the team

  • Daily insights on Macro, Mechanics, and On-chain

  • Curated list of top upcoming airdrops (free money)

Our track record speaks for itself

With over 2.4M tokens and widespread misinformation in crypto, we cut
through the noise and consistently find winning assets.

/images/advertorial/corpcomm3.webp
/images/advertorial/corpcomm4.webp
/images/advertorial/corpcomm5.webp

Frequently Asked Questions

Yes. We've consistently identified winners across multiple cycles. Bitcoin under $1,000, Ethereum under $70, Solana under $10, WIF from $0.003 to $5, PopCat from $0.004 to $2, SPX blasting past $1.70, and our latest pick has already 200X'd since June 2025. Everything is timestamped and public record.

No. When we founded Cryptonary in 2017 the market was new to everyone. We intentionally created content that was easy to understand and actionable. That foundational principle is the crux of Cryptonary. Taking complex ideas and opportunities and presenting them in a way a 10 year old could understand.

Signal vs noise. We filter out 99.9% of garbage projects, provide data backed analysis, and have a proven track record of finding winners. Not to mention since Cryptonary's inception in 2017 we have never taken investment, sponsorship or partnership. Compare this to pretty much everyone else, no track record, and a long list of partnerships that cloud judgements.

We share highly sensitive, time-critical research. Once it's out, it can't be "returned." That's why membership is annual only. Crypto success takes time and commitment. If someone is not willing to invest 12 months into their future, there is no place for them at Cryptonary.

Yes. You will have 24/7 to the team that bought you BTC at $1,000, ETH at $70, and SOL at $10. Through our community chats, live Q&As, and member only channels, you can ask questions and interact directly with the team. Our team has over 50 years of combined experience which you can tap into every single day.

Daily. We provide real-time updates, weekly reports, emergency alerts, and live Q&As when the markets move fast. In crypto, the market moves fast, in Cryptonary, we move faster.

If our approach to the market doesn’t beat the overall crypto market during your subscription, we’ll give you a full refund of your membership fee. No questions asked. For quarterly and monthly subscribers this is applicable once your subscription runs for 6 consecutive months.

Recommended from Cryptonary
The Crypto Handicap: CZ and Binance vs. Hyperliquid
Research Report
The Crypto Handicap: CZ and Binance...Earlier this month, we called BNB as the asset most likely to outperform BTC. This week, we’re calli...
9 min read
Oct 20, 2025
State of the Market: October 2025
PRO
Research Report
State of the Market: October 2025Crypto just endured one of the largest liquidation events in its history, with more than $19B in pos...
23 min read
Oct 15, 2025
CPro picks update: Diversifying with major asset + trade setup
PRO
Research Report
CPro picks update: Diversifying wit...You can debate decentralisation, you can question regulation, but you can't ignore performance. This...
16 min read
Oct 9, 2025