Save 23% ($351) & Get a Free 1-1 Call with our Team ⏰ : 0d 2h 59m 43s
Rigged rallies: Decoding market manipulation in new token launches
The cryptocurrency market is rife with manipulated token rallies designed to trap unwary traders and investors. Our trading analysts have spent months identifying these patterns and developing strategies to navigate this volatile landscape. In this report, we'll reveal how to spot and potentially profit from these manipulated moves while avoiding costly mistakes. Let's dive in.

Disclaimer: This is not financial or investment advice. You are responsible for any capital-related decisions you make, and only you are accountable for the results.
Spotting the signs of market manipulation
Before diving into what market manipulation looks like, we first want to talk about what it really is and the thought process behind it. Market manipulation in crypto involves deliberate actions to distort a token's price or volume, creating a false perception of demand or value to deceive traders and investors. Typically skewed to the upside, it often sees market makers corner a significant portion of a token's supply (a task made easy with low-float coins). With their grip tightened, they deploy minimal buying power to ignite massive price surges, crafting the illusion of organic momentum.This slick move pays off in multiple ways. If the market maker is aligned with the token's insiders, it paves the way for those insiders to dump their holdings at inflated prices. It also entices traders to "go long," jumping aboard what looks like an unstoppable pump. Most crucially, the soaring price and volume create the perfect smokescreen for market makers to offload their substantial holdings at a hefty profit, often leaving latecomers stuck when the inevitable crash lands.
So now that we have a little more context as to why and how these things happen, let's take a peak at what the charts tell us about how these things tend to work. For this part, we are going to go through 5 super recent examples.
The first example we want to look at is AERGO. As we can see from the chart below it went up for over a week straight just to drop 80% and retrace the whole pump. That is market manipulation.
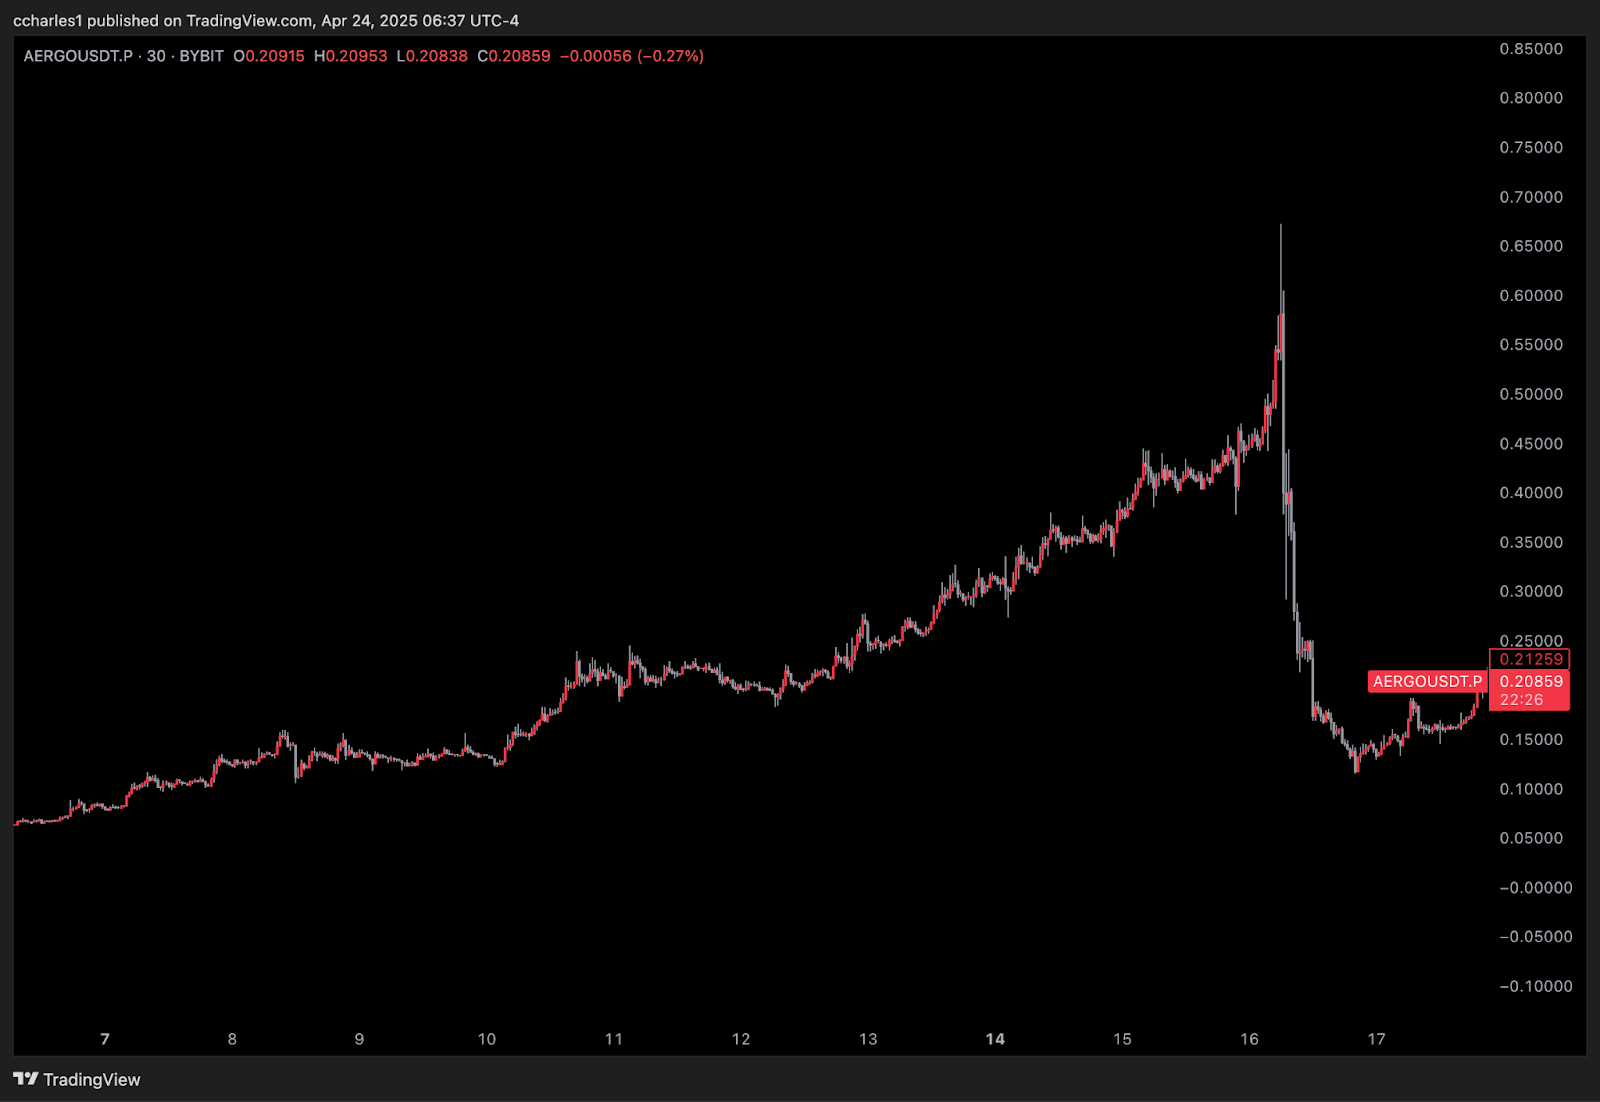 AERGO price chart demonstrating classic pump and dump pattern[/caption]
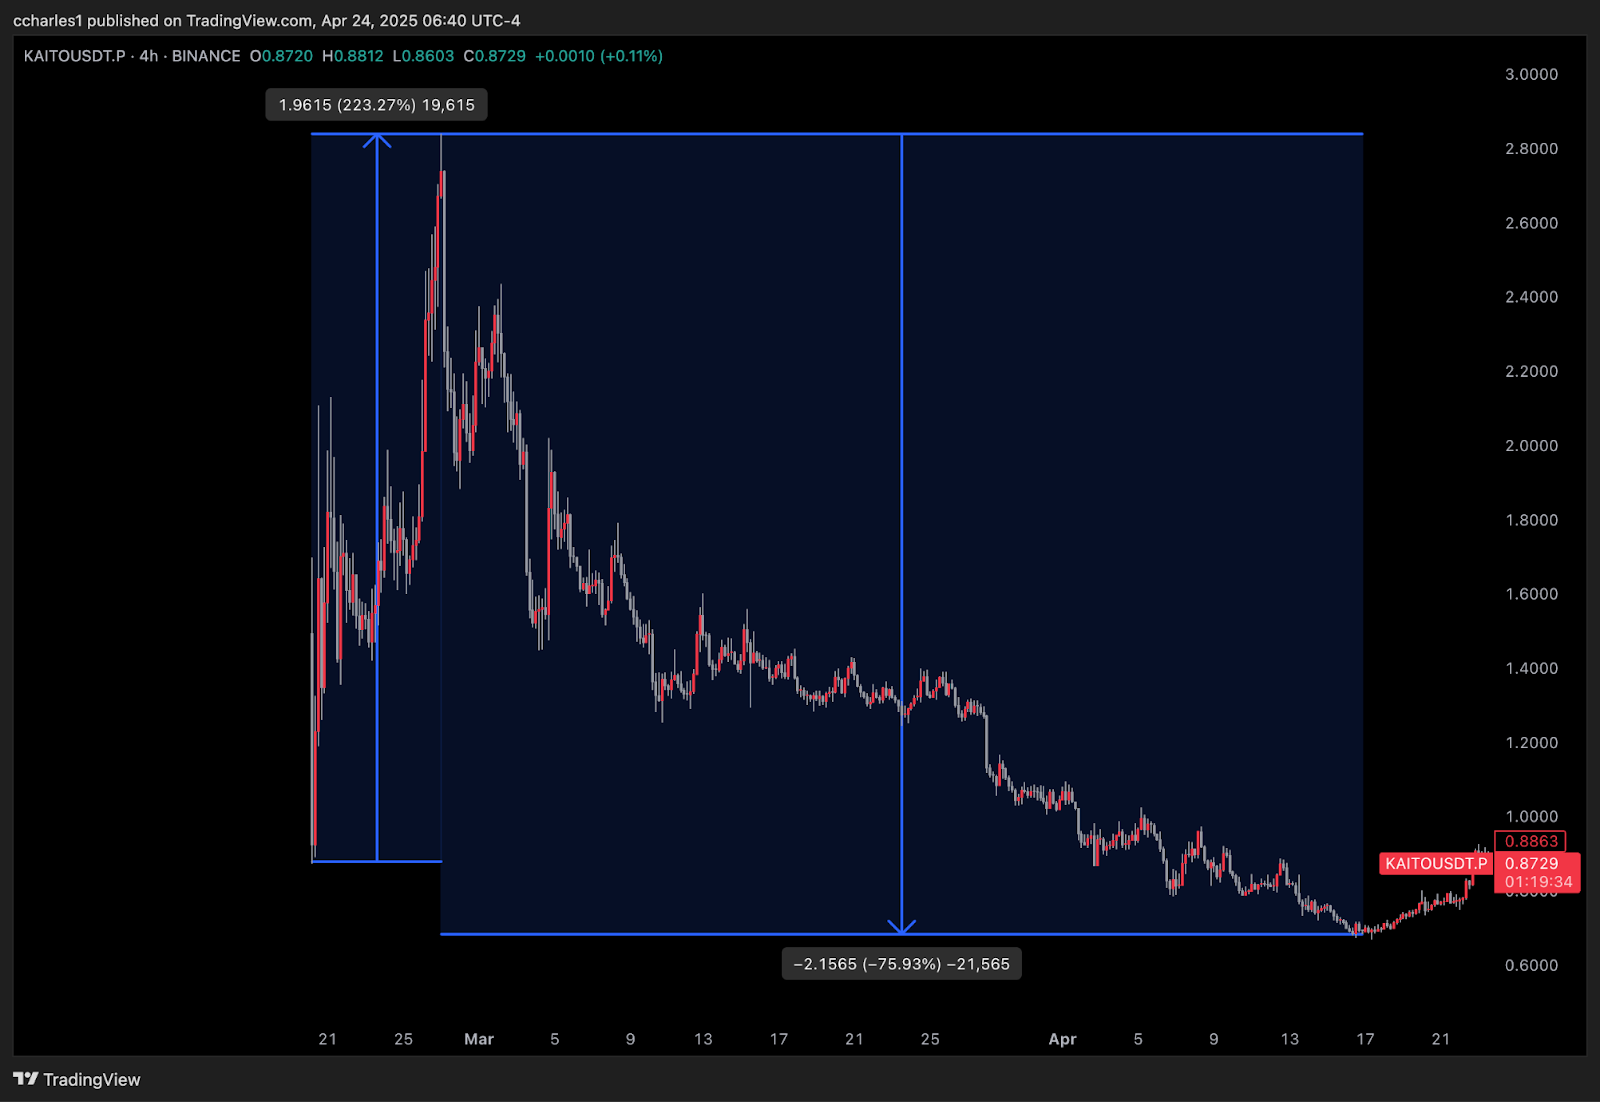
How the pros cash in on these moves
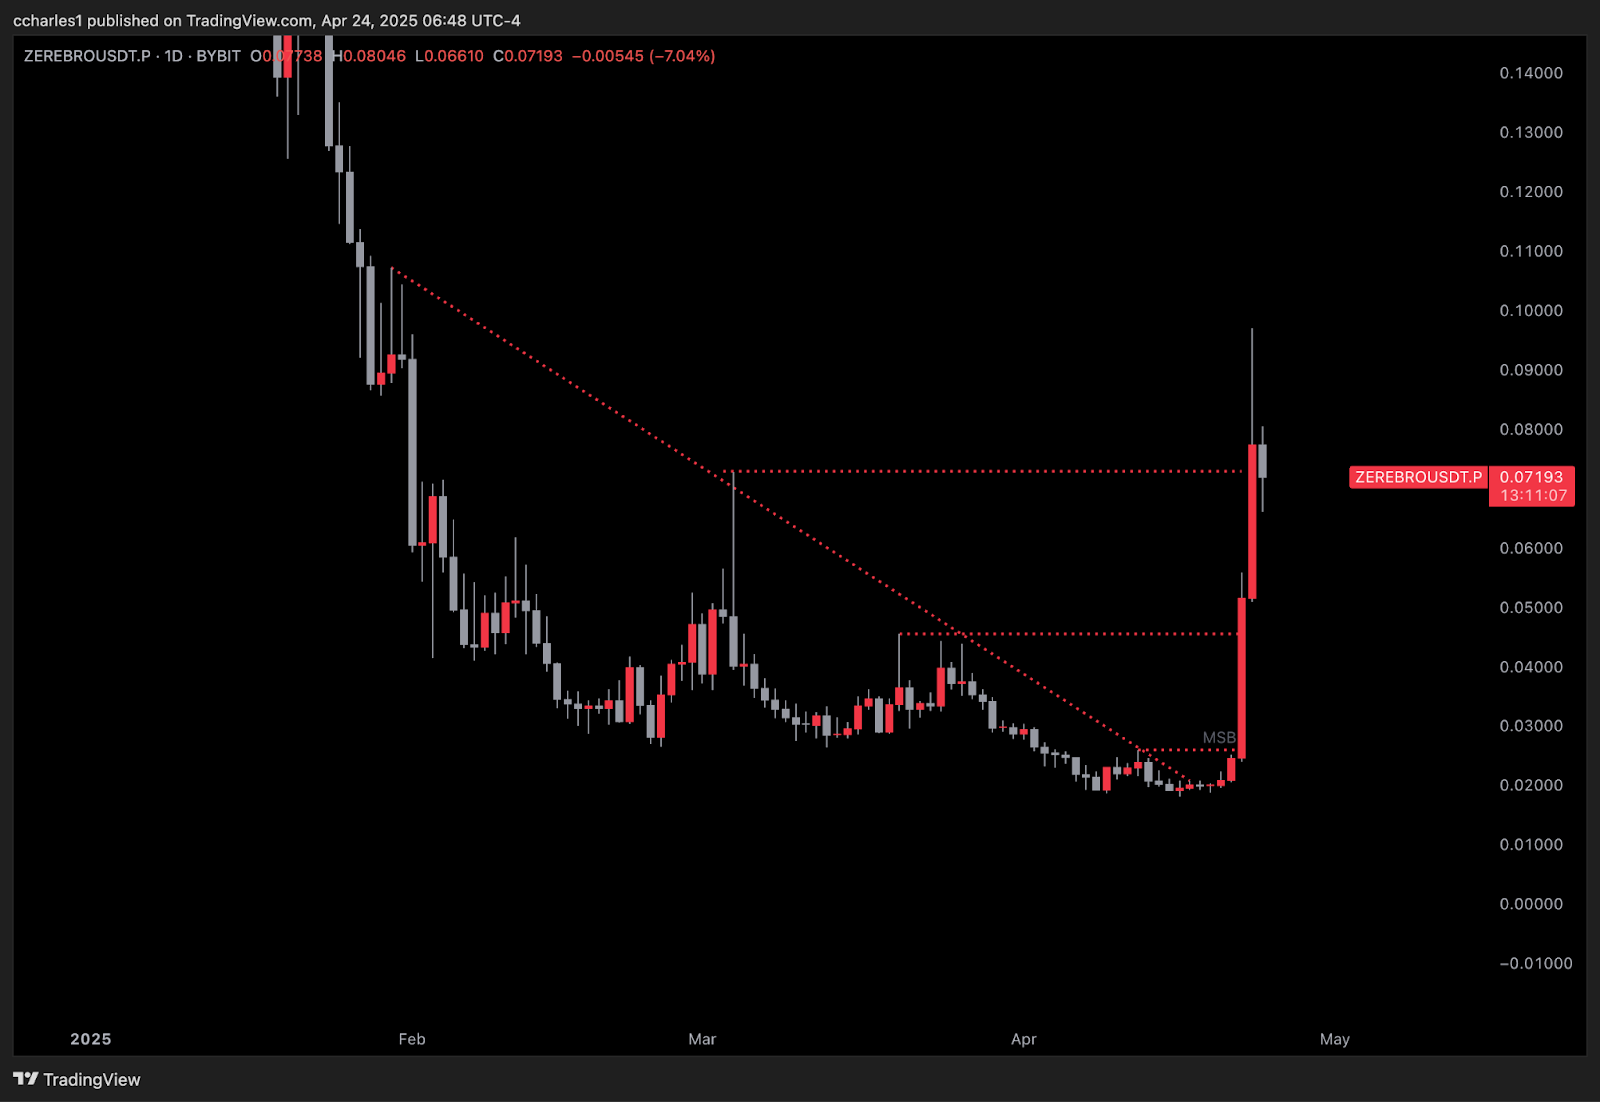
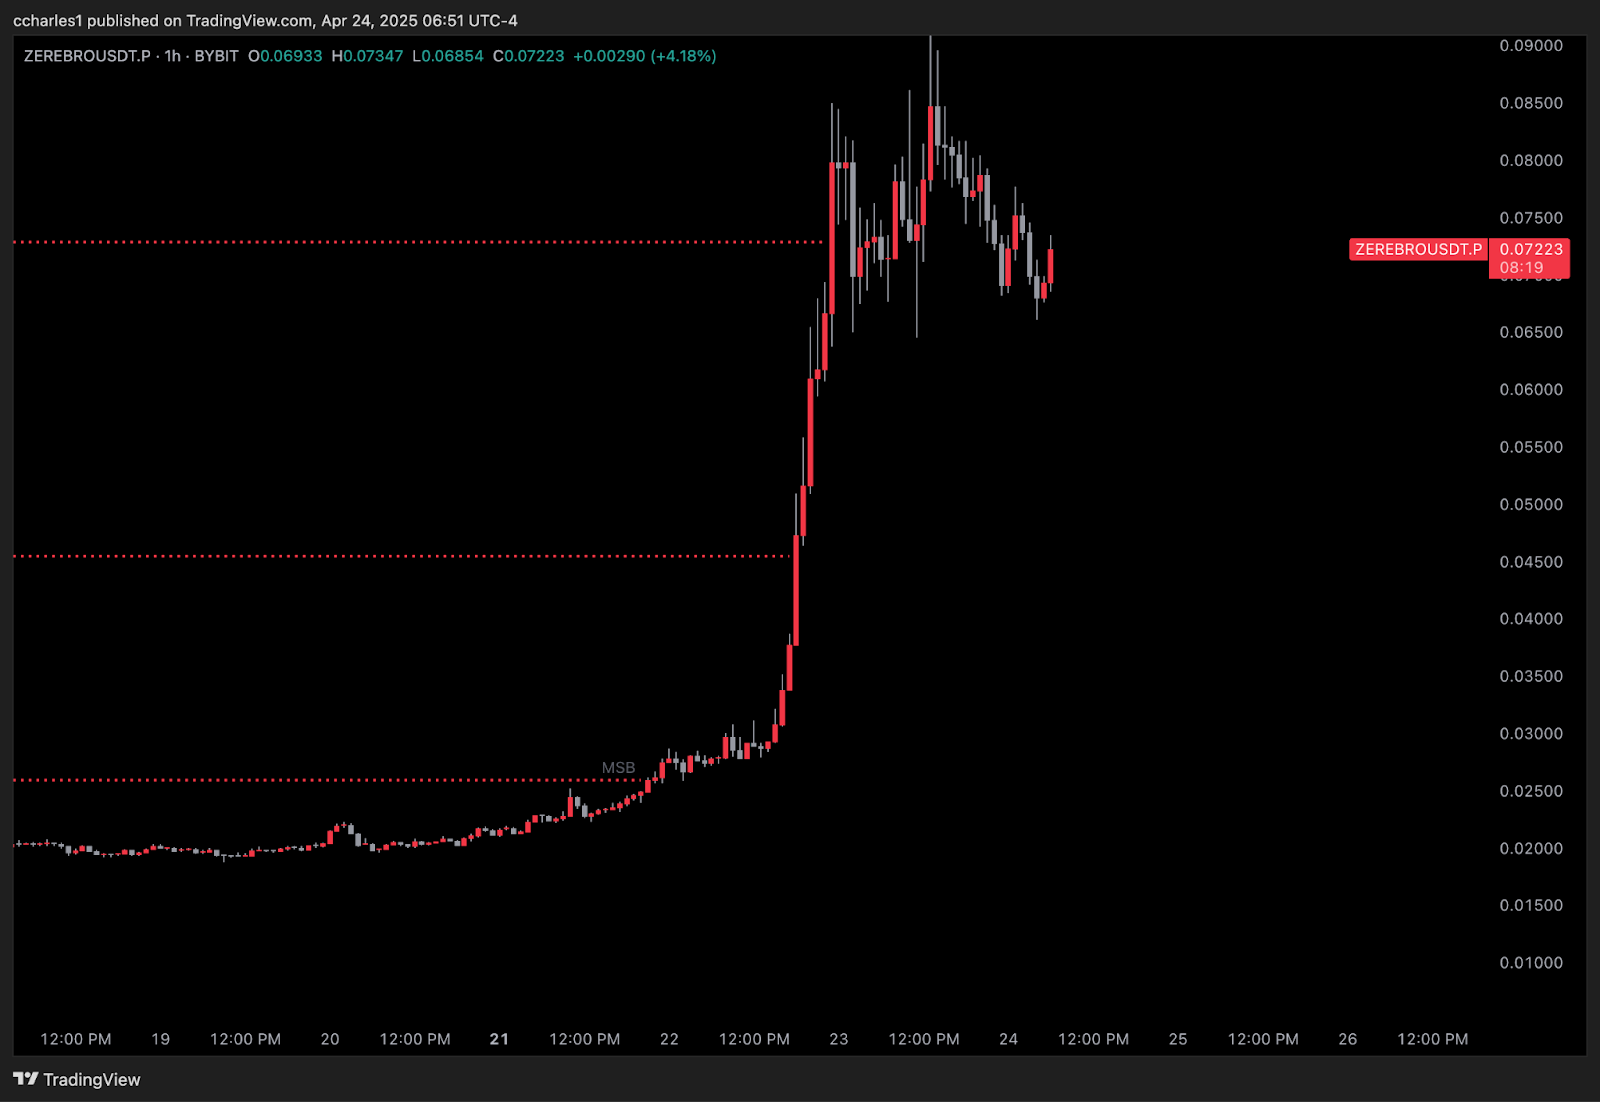
The first way is from longing, and the easiest way to do this is by determining when a dead ALT or memecoins makes a HTF market structure shift. Next, we can assume a run up backed by manipulation.And what better way to show this than by showing you a recent example of the memecoin ZEREBRO. As we can see from the chart below, we had that shift in market structure on the 22nd and within the same day price pumped 133%. And the day after it went up 90% more.
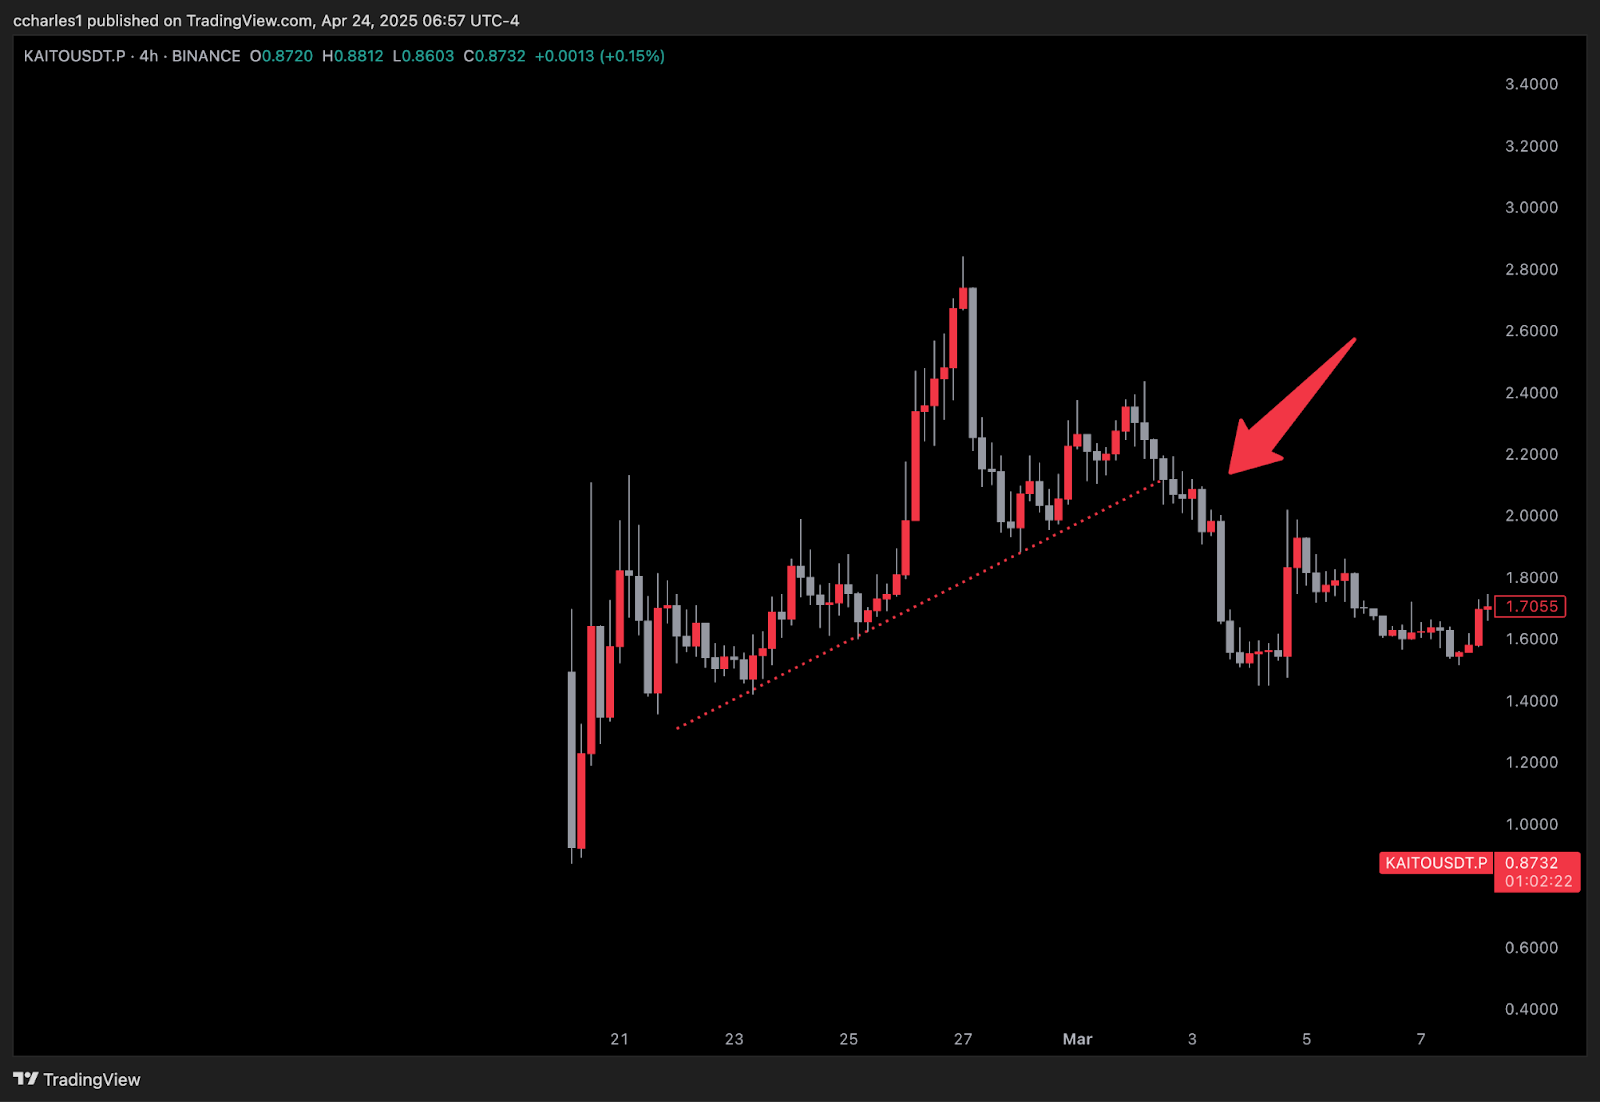
The second way smart money profits from these manipulated coins is through shorting, and just like longing the easiest way to do this is also by breaks in market structure. To show you we will also display a recent example from the coin KAITO.
As we can see in this first chart, the price ran up holding a pretty clear uptrend line. But then, on the 3rd of March, we can see that we aggressively lost that up trend. Now as we learnt before, smart money could be long this coin up to when market structure breaks down, so that being said what's their next move here?

Staying safe in manipulated markets
Before we give you the sauce on how to make money off these coins, we first want to echo a bit of a warning. This warning is because with coins like this, the risk in trading them is higher because of how hard they pump and how quick they fall.If you short too early without using proper risk management, and the pump keeps going you can lose a lot of your trading portfolio and vice versa. Therefore, we strongly recommend not risking more than 1% of your trading capital on each trade and to always follow what our analysts are saying.
Analysts and traders in CPRO have experience trading these manipulated assets, and even if they are wrong or you personally get a trade wrong, you will only lose a very small amount and will have enough bullets in the chamber to try again.
Lastly, remember that markets can remain irrational longer than most participants can stay solvent so managing your risk is the backbone of making these strategies work.
Now that you are a bit more updated with the risks, let's get into the gold, how you can make money off these manipulated assets.
Your playbook to profit from manipulated tokens
As we mentioned earlier, smart money typically profits from longs and shorts precursored by shifts in market structure. With that in mind then we should then in theory try and replicate those strategies into our own playbooks so that we can also profit the same way.That being said, the way we want to show you how to do this will be through using a couple new examples for each side, be it long or short. Through these examples we can walk you though some basic entry and exit techniques along with some pointers on targets and stop loss placement.
Lets start with the long side, for this we want to first look at IP. On this chart we want to bring our attention to the key swing highs noted on the chart and the market structure break that happened on the 17th of February.
After that market structure broke, we can then see how we turned the previous resistance zone into support and then it was off to the races towards those key highs.

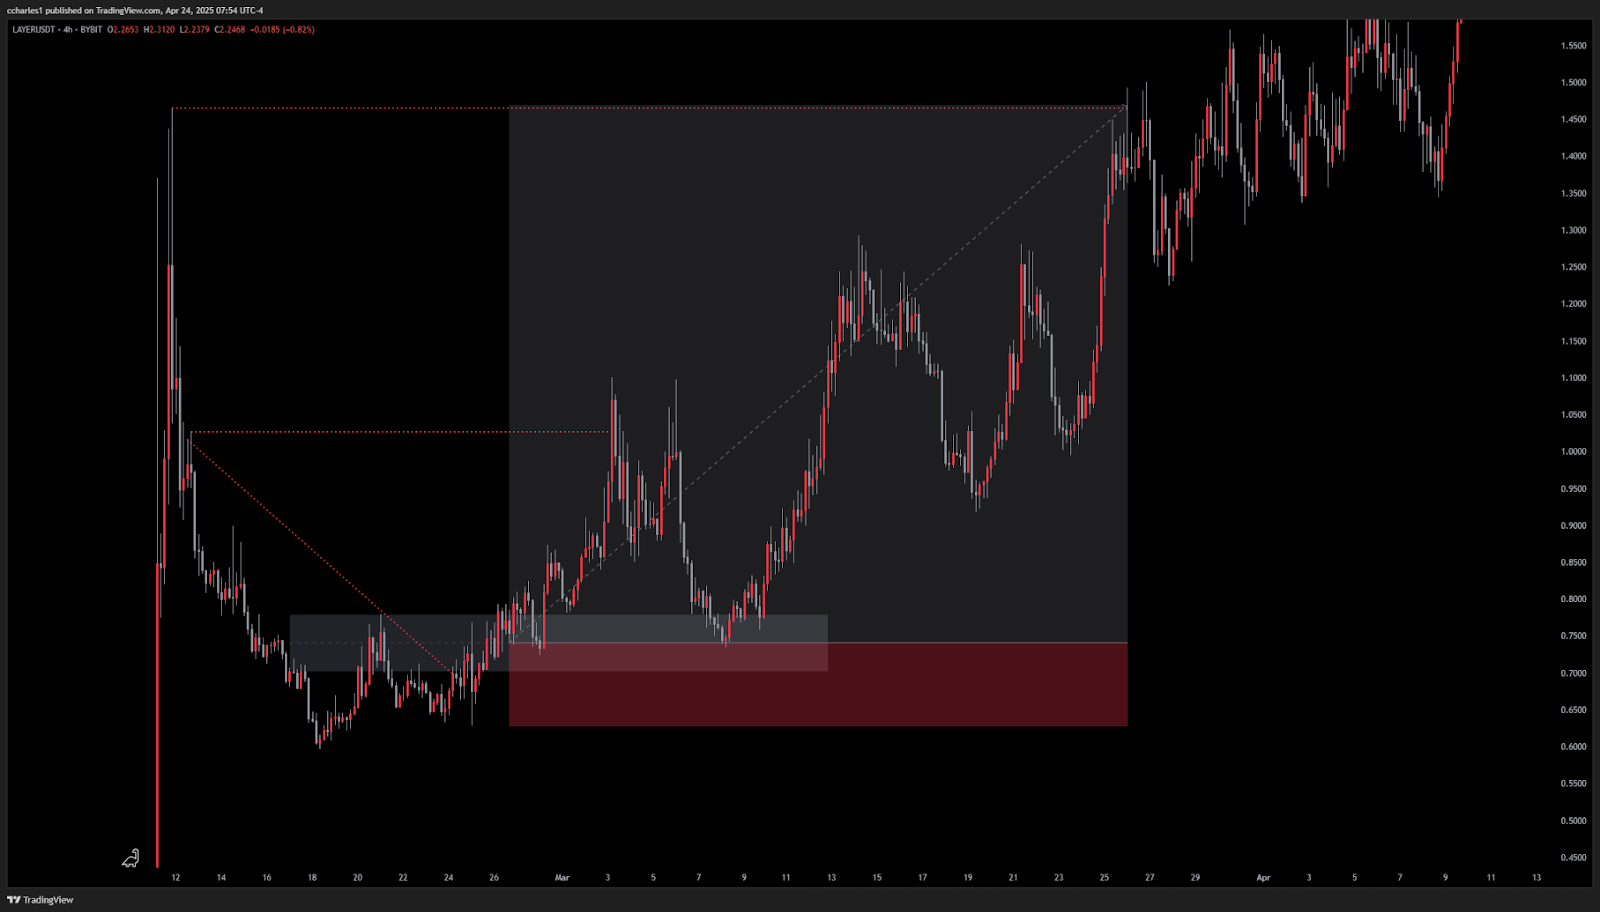
Lets do another long example, this time looking at LAYER. As we can see from the chart something very similar happened! We had the clear downtrend broken, we had a breakout of the old resistance zone. Retested it as support, and then flew towards those key swing highs.
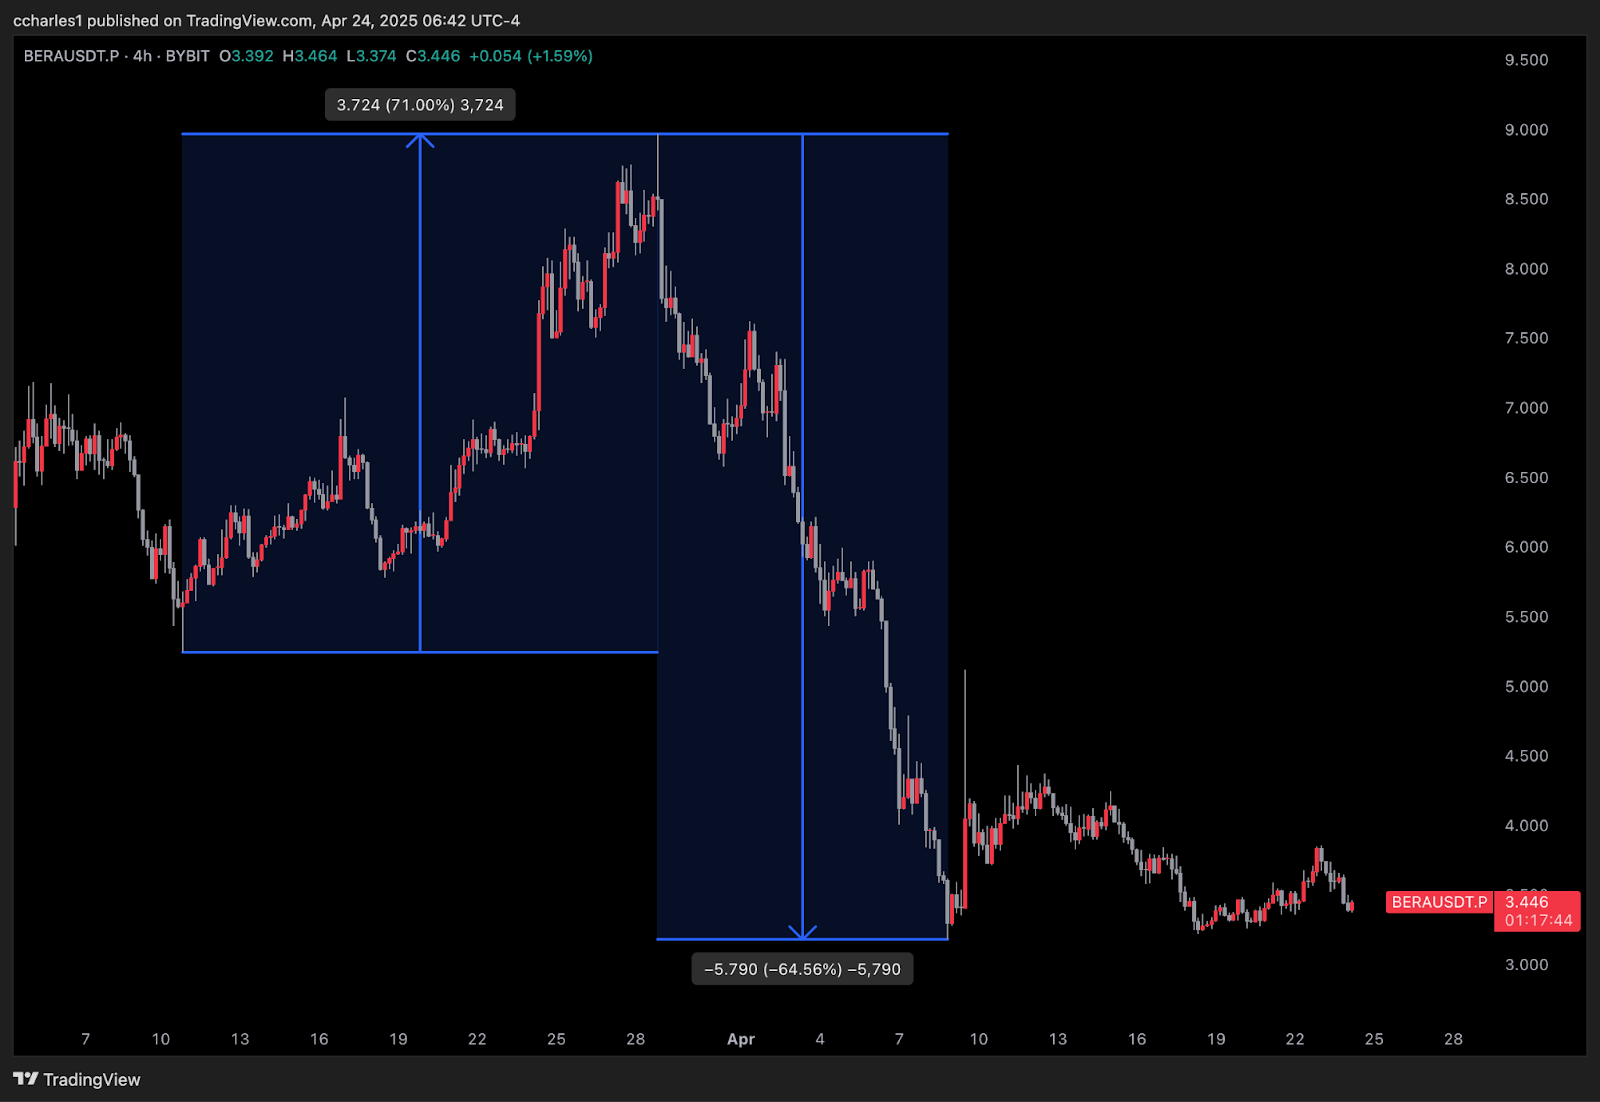
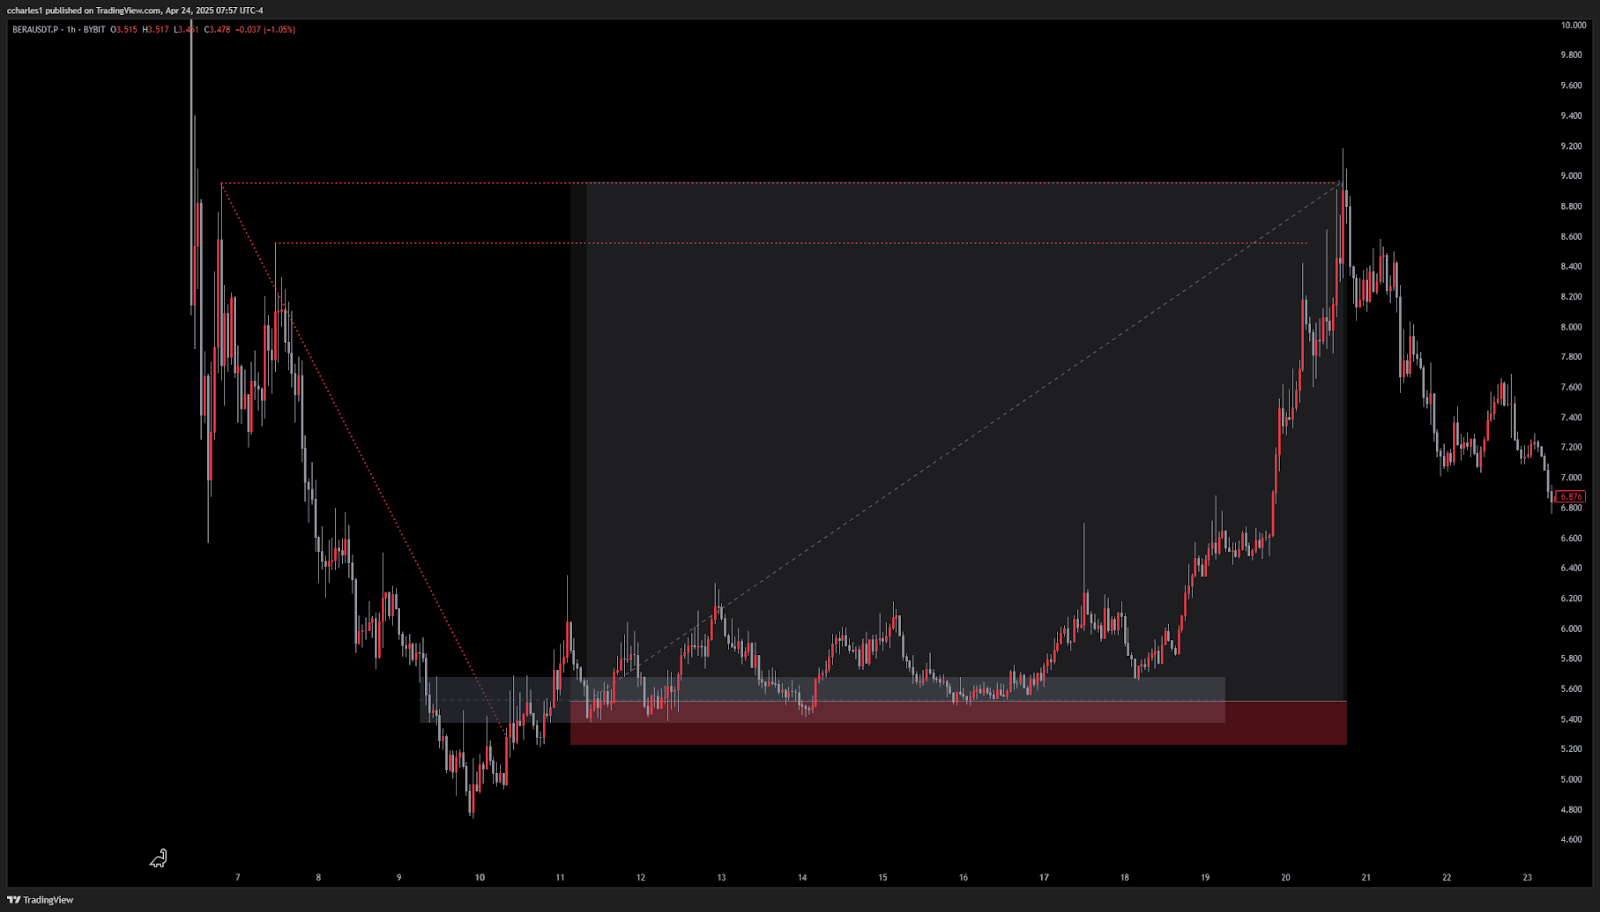
Let's do one more example just to send this home using BERA. As we can see from this chart, the exact same thing happened. We had the clear downtrend broken. We then see that the resistance gets flipped into support. After that price holds the support line perfectly then moves sharply towards the highs. Seeing the pattern yet?
First lets take a look at BERA, as we can see here the similar thing happened to the short side but in the reverse. We can see that there was a very clear run up but then we aggressively traded downwards. After trading downwards, we ended up testing the old support and then plummeting down towards the old lows.

The next chart we will look at is KAITO. As seen on the chart, it's the same story again. We wait for structure to break, we plot out the old support that's been traded through and and then anchor the stop to the last high.

- Market structure broken?
- Resistance broken?
- Key swing highs to target?
- Risk managed?
We also want to quickly touch on which coins are most likely to become manipulated and luckily these fall into two categories: new tokens and old meme / alt coins. But it's a bit more deeper than that. When a token has no PMF or community, or supporting narrative, and it just trades up-only without any substantial pullbacks, that is not organic, and the token is also likely to be manipulated.
Lastly, new token launches listed on CEX's (like Binance and Bybit for example) are also prone to manipulations as the orderbooks are hidden making it easier for market makers to scam-pump the market.
Cryptonary's take
Unfortunately, market manipulation in new and existing token launches remains a persistent reality in the crypto space, but it's a double-edged sword that savvy traders can turn to their advantage. By mastering the art of spotting manipulation — through telltale signs like abrupt pumps in low-float altcoins, unnatural price surges without fundamentals, or rapid retracements after parabolic moves—you can position yourself to profit from both the ups and downs.The key lies in a disciplined approach: leveraging market structure breaks, targeting key swing levels, and anchoring trades with tight risk management (never risking more than 1% of your capital per trade). Whether you're longing breakouts in manipulated memecoins or shorting overextended pumps, the checklist is clear—confirm structure shifts, validate support/resistance flips, and always protect your downside.
New tokens on CEXs and dormant alts with no product-market fit are prime candidates for these schemes, making them fertile ground for strategic trades. Approach with caution, stay sharp, and let the market makers' games fuel your gains.
Stay safe, trade smart, and never chase.
Cryptonary, OUT!!
Recommended from Cryptonary


