Save 23% ($351) & Get a Free 1-1 Call with our Team ⏰ : 0d 2h 59m 43s
Tron trade review
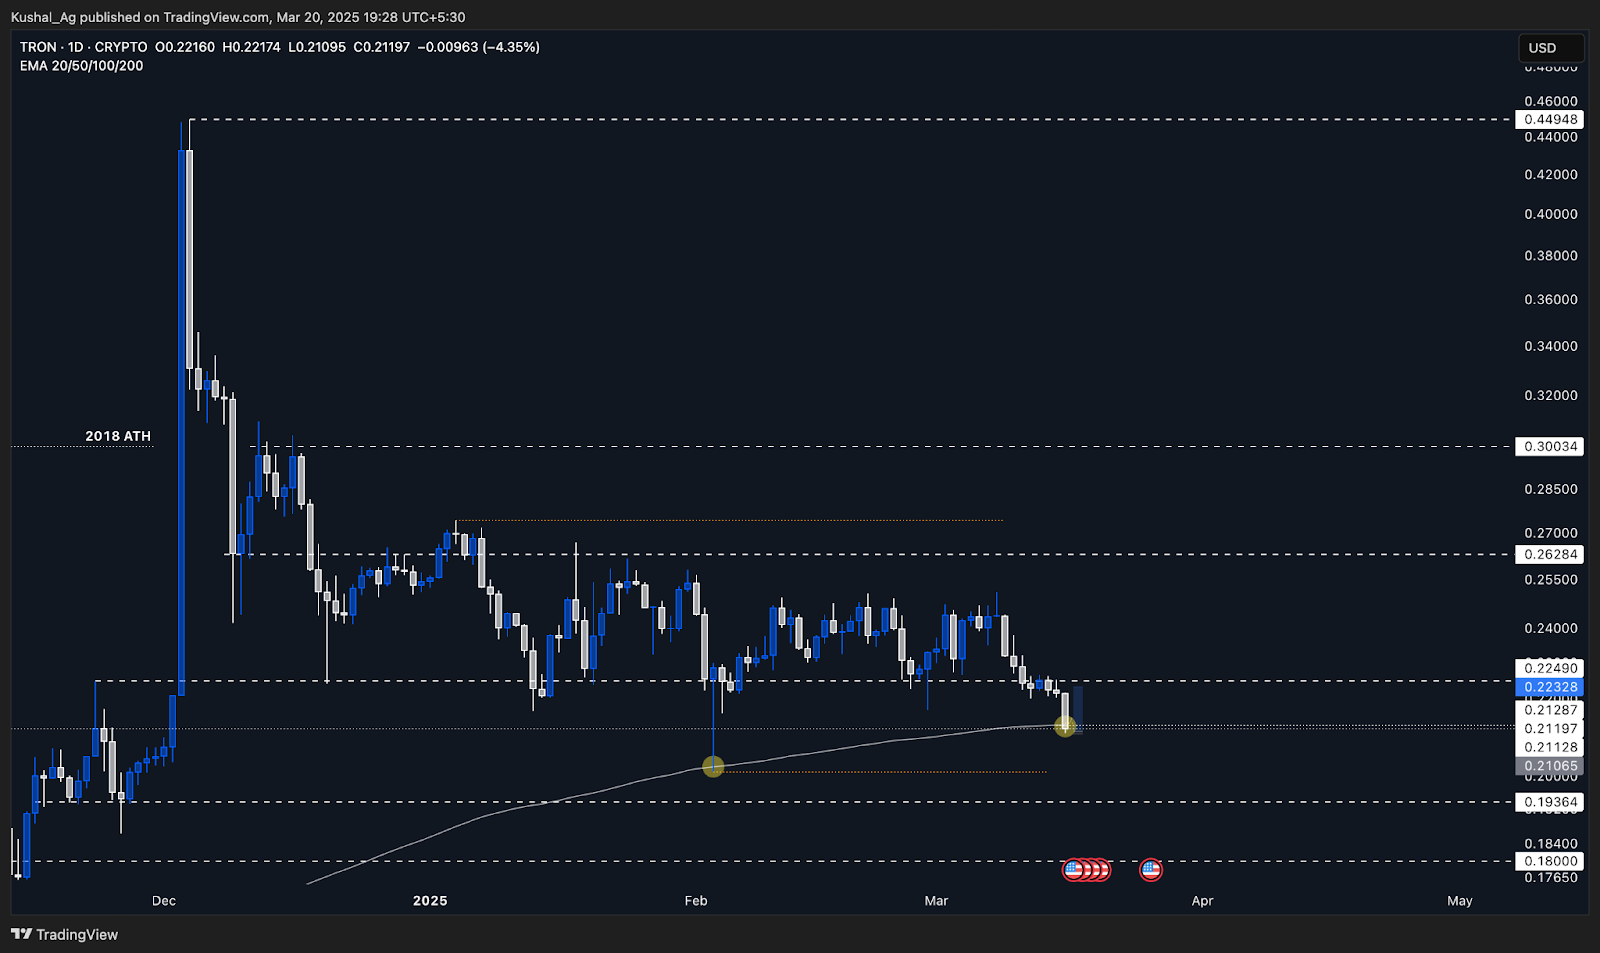
While TRX worked below the range once, it bounced strongly off the 200 EMA on the daily timeframe, a reliable dynamic support indicator on higher timeframes (daily/weekly). This quick reclaim back inside the range after testing the 200 EMA validated it as a significant support level.
Disclaimer: This is not financial or investment advice. You are responsible for any capital-related decisions you make, and only you are accountable for the results.
Why TRX? Strength in a weak market
TRX had been range-bound for months, making it a standout candidate when compared to other altcoins that were bleeding to new lows. The key takeaway? Strong assets that hold their structure in bearish conditions tend to outperform once the market stabilizes.Knowing this, we marked the 200 EMA region (~$0.212) as a high-interest level for a potential entry.
Trade execution: lower timeframe confirmation & BTC confluence
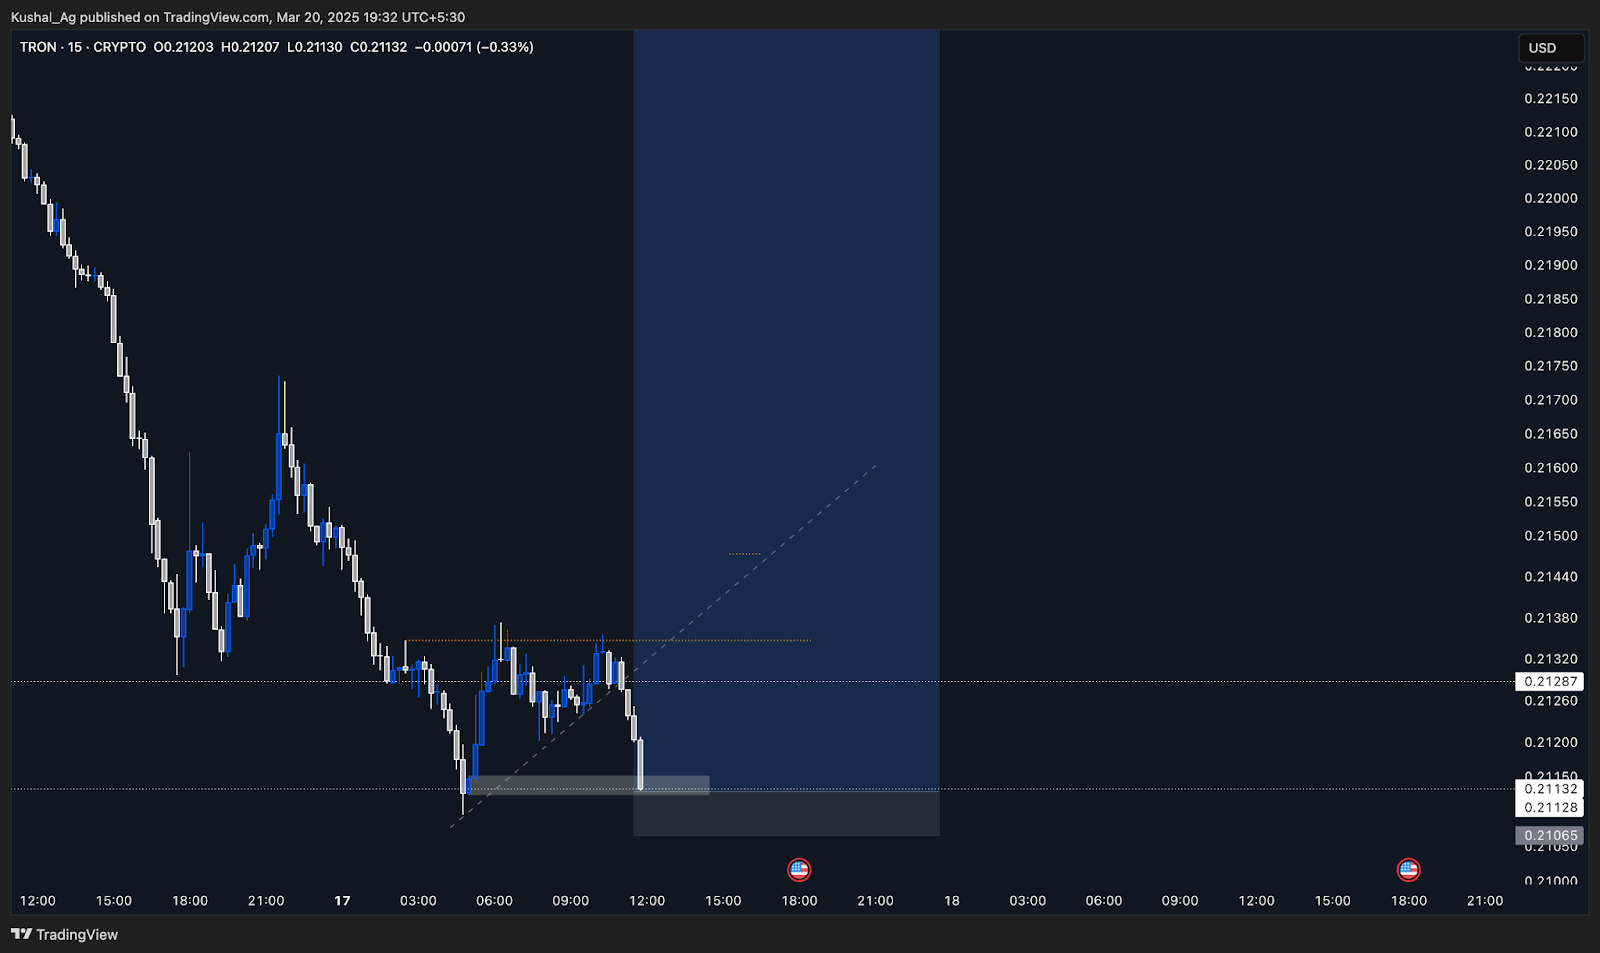
Once TRX approached the 200 EMA ($0.212), We dropped to the lower timeframes (15m) to look for signs of reversal. At the same time, BTC's structure was key to determining TRX's short-term probability of bouncing.- BTC had taken liquidity below the Feb 28th low of $78,200 after a sharp decline from $85,700 in 1h timeframe.
- Post-liquidation, BTC stabilized and began consolidating ~1,200 points below the $85,700 supply zone.
- This suggested that BTC was likely to retest $85,700, which would provide a tailwind for TRX's upside potential.

15-minute price action & entry strategy
As TRX tapped the 200 EMA region ($0.212), the 15m timeframe displayed an impulsive move from the point of interest (POI), leaving behind a trendline liquidity buildup marked by an orange dotted line.This impulse also left a defined POI between $0.21112 - $0.21115, which became the preferred entry zone.
- Why this POI? Because short-term liquidity buildup would have been grabbed if the price went to the POI, indicating a potential reversal.
- Risk Management: My invalidation was set at $0.2106, a tight 0.3% stop-loss from entry ($0.2112).
Confirmation, upside expansion and trade management
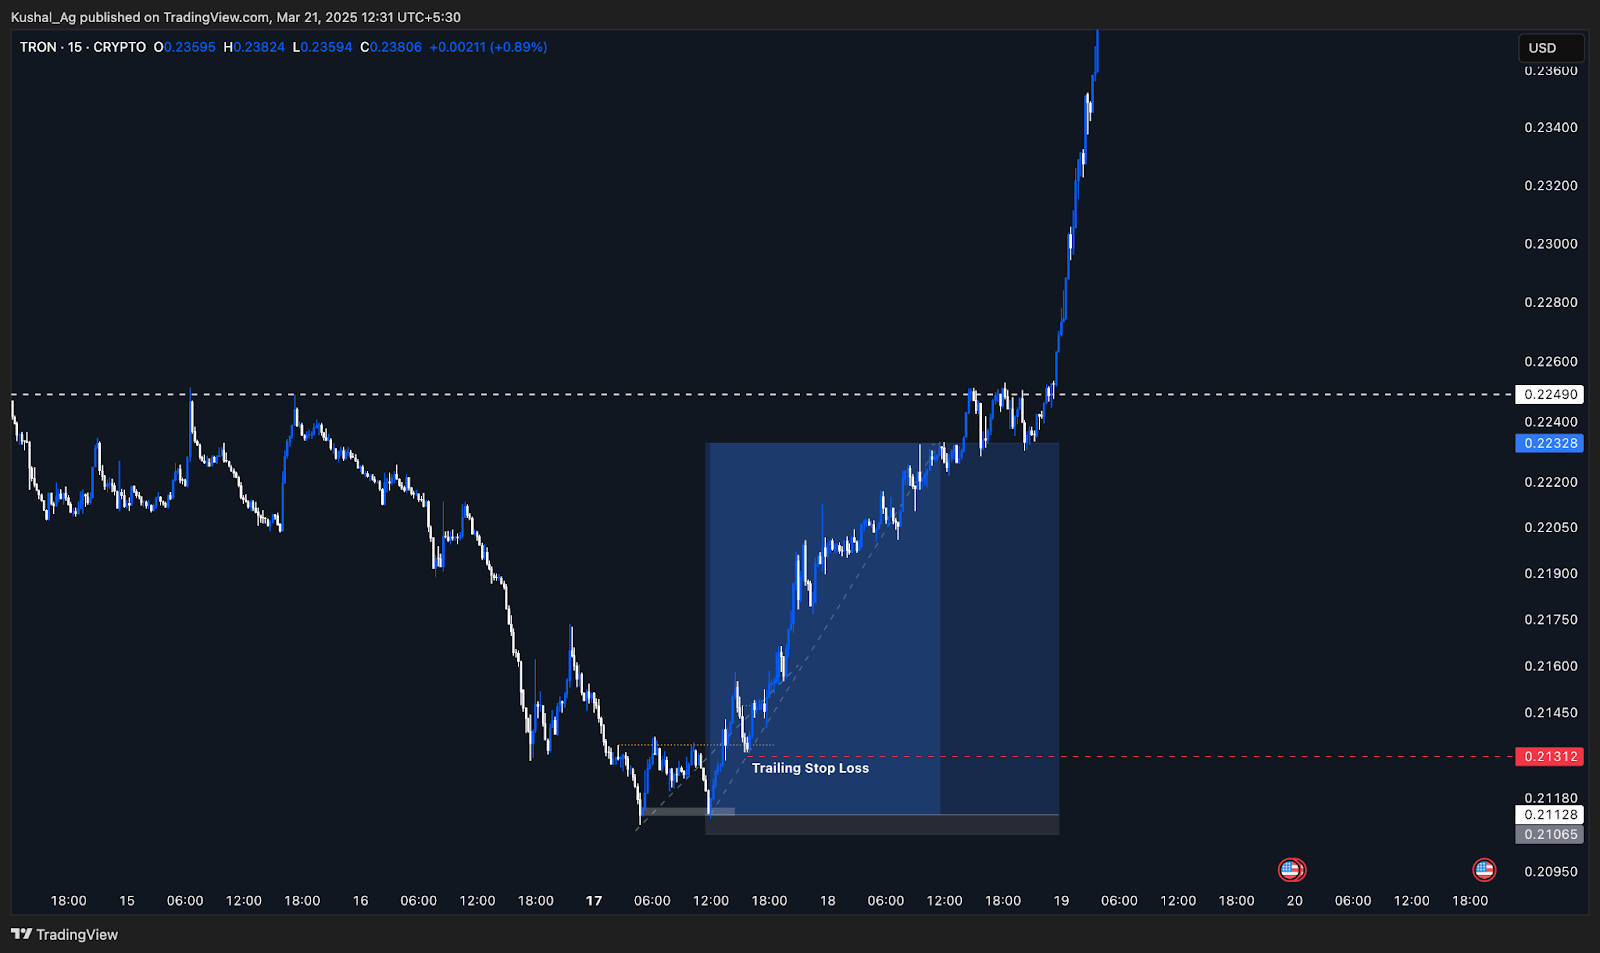
For confirmation, $0.2135 was the key level to flip to validate a short-term bullish structure shift.- Once TRX broke and flipped $0.2135, it moved aggressively, confirming strength.
- Relative strength started showing immediately, and TRX began outperforming other assets.
Additionally, trailing the stop-loss to the next higher low formed ($0.2131, marked in the chart below) after the shift in structure is another advanced technique. This locks in partial gains and ensures that if the market does reverse, you exit with profits rather than giving them back. It's a blend of discipline and adaptability which is important for maximizing RR on high-quality trades like this.
Exit strategy & risk management
- Planned Target: $0.2249 (previous range bottom).
- Scaled Out: Started taking partial profits at $0.22 to secure gains before major resistance.
- Final Exit: $0.223, fully closing the position before the final TP to avoid front run sellers.
Post-trade reflection
What worked?
- Multi-timeframe confluence: The setup was built on strong foundations, the 200 EMA on the daily timeframe, an impulsive 15m POI entry, and BTC's liquidity sweep. All layers aligned perfectly.
- Tight stop-loss (0.3%): This allowed a very high risk-to-reward profile. With 10x leverage, the margin risk was controlled to just 3%, which gave room for sizing up comfortably in the trade.
- Scaling out risk-free: Exiting partials around $0.22 before the major resistance at $0.2249 helped sidestep the risk of frontrunning by early sellers.
What could've been improved?
- Leaving a runner: TRX continued its move and reclaimed the higher timeframe range low it broke and pushed even higher, honestly didn't expect such relative strength. Keeping even a small position (10/20%) running could have captured a great deal of more upside.
Cryptonary's take
From a pure risk-reward perspective, this was a 1:20 RR trade with 0.3% risk with a 5.7-6% upside. These are the kinds of trades that don't show up every day, but when they do, proper positioning and management can deliver outsized returns.We already have some high quality setups on our radar just like this one which are ready to be capitalised on.
Recommended from Cryptonary


