Save 23% ($351) & Get a Free 1-1 Call with our Team ⏰ : 0d 2h 59m 44s
3 months to the halving: Macro set to trigger a crypto rollercoaster
Since our last monthly report was posted in early December, we've seen some meaningful macro changes. On-chain data suggests that prices have potentially peaked in the short term, and several Bitcoin Spot ETFs have been approved.

In this report, we will assess:
- Macro data and what effects this may have on risk assets (crypto)
- The most recent QRA from the Treasury and its impact on liquidity
- The Fed's actions and the potential effects on crypto
- Factors that may influence the depth of market pullback
- Evaluating price action before and after previous Bitcoin halvings
- How to position for profits
Disclaimer: Not financial or investment advice. You are responsible for any capital-related decisions you make, and only you are accountable for the results. "One Glance" by Cryptonary sometimes uses the RR trading tool to help you quickly understand our analysis. They are not signals, and they are not financial advice.
Macro data and its effect on risk assets
Since our last report in early December, we've had a lot of macro data out, which has begun to change the narrative around rate cuts, despite the market pricing for cuts not changing yet – but to our advantage here, potentially being ahead of the curve. Let's look at the data before diving into what it means.Inflation data
The positive of the inflation data is that the 6-month Core PCE is annualising at 1.8%. The Fed likes this data point; hence, we place a certain level of importance on it. 1.8% is below the Fed's mandated target of 2.0%, which is positive, and the Fed will be pleased by this.However, when we look at other inflation data points, the numbers have come down considerably from 18 months ago but seem to have stalled or even increased slightly over the last few months. Inflation Rate YoY
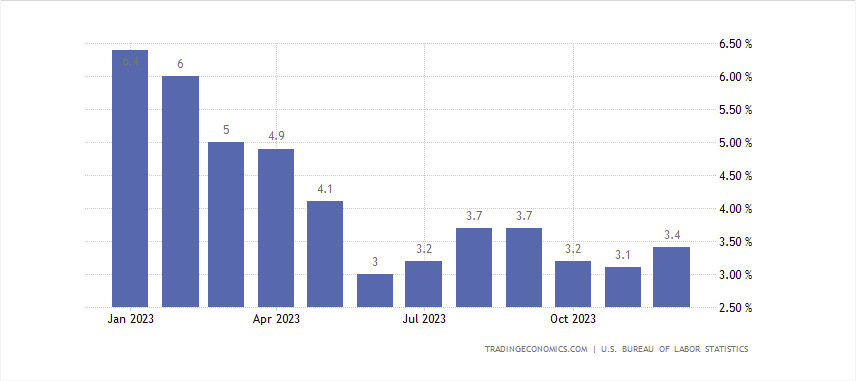
Core Inflation Rate YoY
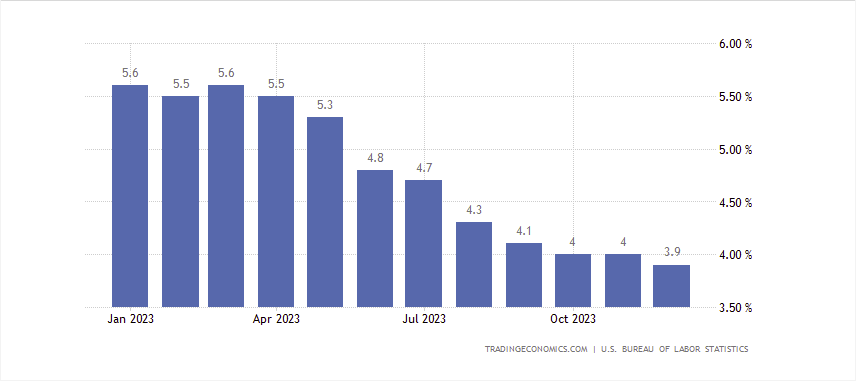
Most of the disinflation (reduction of the rate of inflation, not prices decreasing – they're just not going up as much as they were) has been due to Goods inflation coming down as supply chains have opened back up following Covid. However, we now have conflict in the Middle East and the Red Sea with Iranian-backed proxies targeting Western ships. This forces Western ships to take the route around the bottom of Africa, avoiding the faster route through the Suez Canal. This has seen the costs of shipping quadruple. The Fed will be wary of this beginning to show up in the inflation numbers over the coming months and quarters.
When you pair this with a strong economy – economic growth expected to remain above 2.0% in 2024 – along with the labour market remaining remarkedly robust, this does suggest that inflation could rear back up again in the coming months and quarters. Let's look under the hood of the labour market data.
Labour market data
Firstly, we'll look at the labour market from an employer's viewpoint and their appetite to employ more workers. For this, we look at the JOLT's Job Openings data. JOLT's Job Openings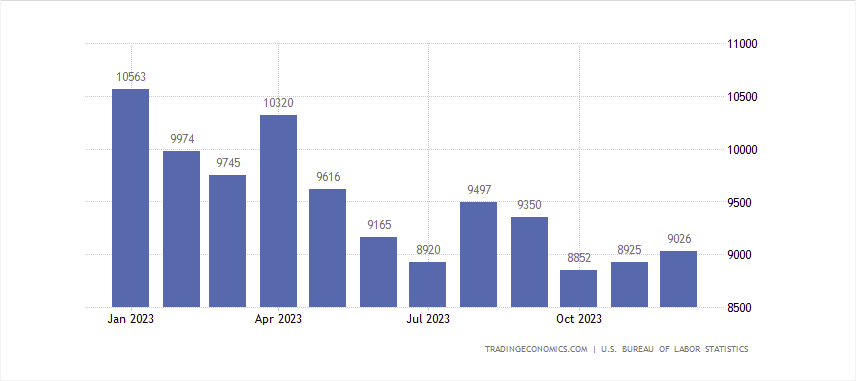
In the most recent data, the number of advertised Job Openings was up to 9.026m, above the prior month's reading of 8.925m and well above the consensus going into the last month of 8.690m. This is a big beat to the upside, showing employers are still looking to take on more staff.
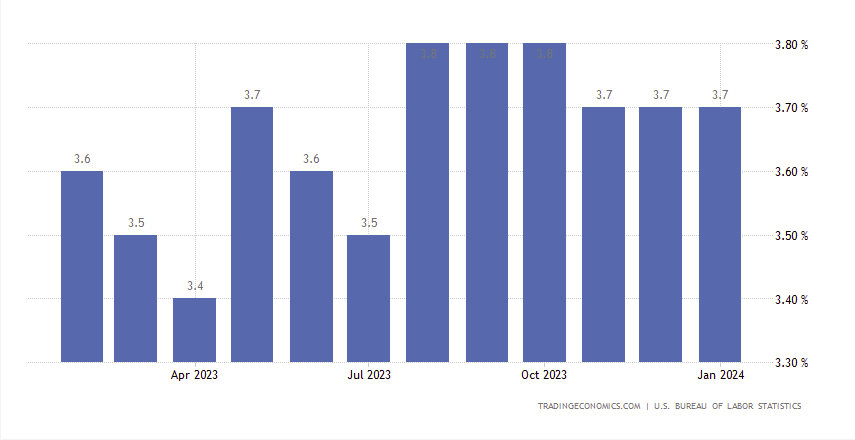
If we then look at the Unemployment Rate and Non-Farm Payrolls (the number of jobs added in the US), we can see that the Unemployment Rate came in at 3.7%, below the 3.8% consensus and the prior month's reading of 3.9%.
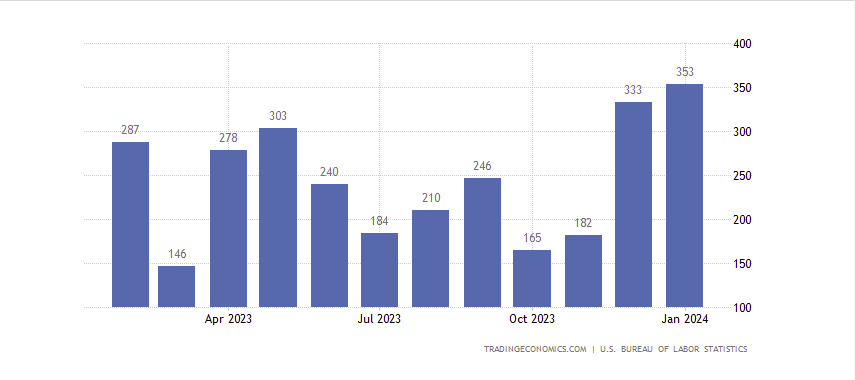
Alongside this, we saw a hot Non-Farm Payrolls print. The expectation was for 175k jobs to be added in the US in January, in line with prior months. However, the US added 353k jobs in January, with December's numbers also being revised higher to 333k jobs added.
A phenomenal number of jobs are being added and the likely reason why the Unemployment Rate fell.
Non-Farm Payrolls
Unemployment Rate
Concerns about the job data
Recently, however, it's worth noting some concerns with the jobs data.Firstly, 'Average Hourly Earnings MoM' came in at 0.6%, meaning wages are rising relatively rapidly. A 0.6% MoM rate puts the Year-on-Year figure at 4.5%, well above the Fed's 2.0% mandated target. This is, of course, inflationary and something the Fed will have a close eye on. If this continues, the Fed will have to find a way to remain restrictive or increase restrictiveness in their Real Rate (the difference between the Interest and Inflation rates).
Doing this would be particularly difficult if inflation rears up again, as the way to become more restrictive would be to raise Interest Rates again, which would be terrible for markets, or it would be for financial conditions to tighten. This would likely require liquidity to worsen to see economic conditions tighten.
If we look at the type of jobs being added, they are mostly government and part-time jobs. The Government jobs make sense, of course. We are in an election year, and the Democrats and Biden want to be re-elected, so they'll employ more people within government to help flesh out these monthly job gains numbers.
But we can also see that since February 2023, if we look at jobs added by part-time and full-time, we can see that the number of full-time jobs added has decreased, and part-time jobs have been responsible for the job gains.
Job Changes: Since February 2023
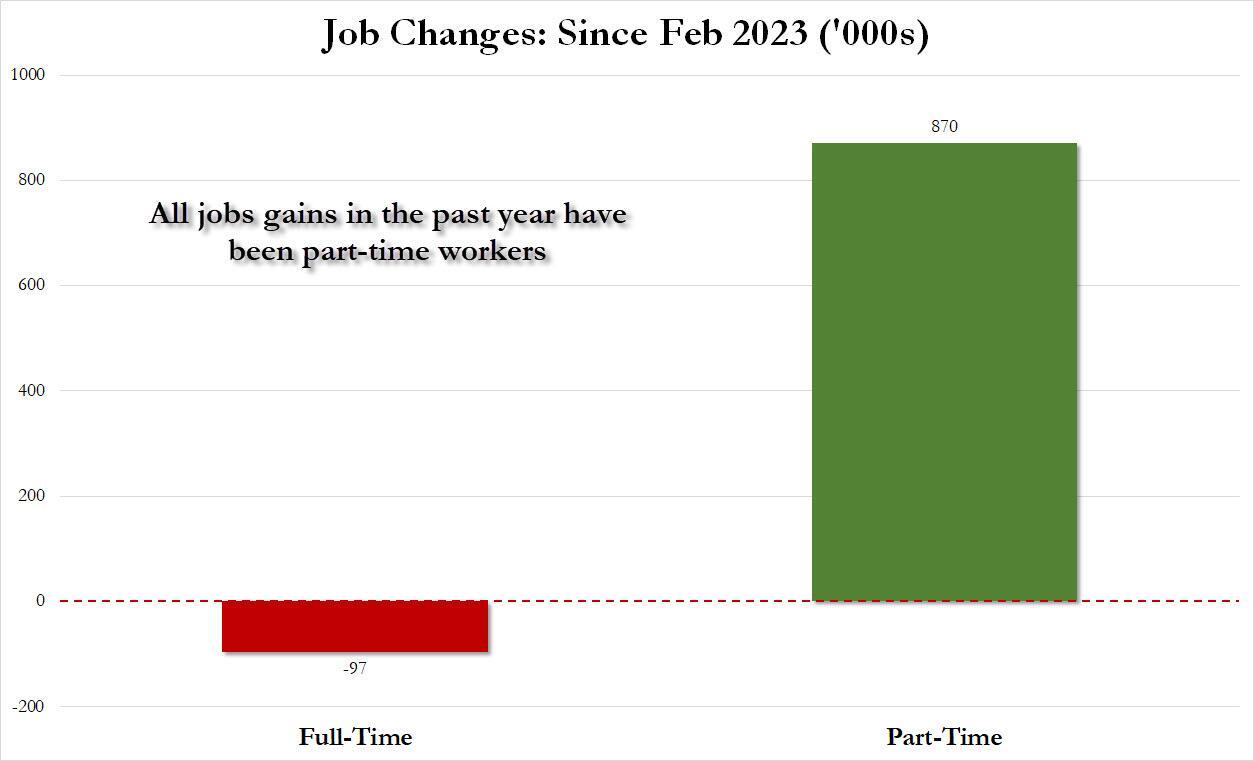
Source: ZeroHedge
The above hints at some underlying weakness in the jobs market despite employers' propensity to hire still.
However, the cause for the major increase in jobs added is most likely due to more people taking second jobs, likely due to the increased pressures of keeping up with the new, more expensive standard of living.
With the above economic data contextualised above, we will now consider what this means for the Fed.
But firstly, we'll look at the most recent Quarterly Refunding Announcement by Yellen and the Treasury, as this adds greater context to Powell and the Fed's decision-making going forward, which then affects our risk assets – Crypto.
The Treasury's most recent QRA
The previous QRA was released on November 1st, and it essentially showed that issuance of longer-duration Treasuries (these bonds with a duration between 10 and 30 Years) would be less than expected. There were still many issuances; it was just less than the market had been initially forward-guided. It was, in fact, the front end of the Yield curve (Treasuries with a duration of less than 12 months – known as Bills) where the issuance increased.The result of this was longer duration Bonds got a bid, sending the price of the US10Y and US30Y Bonds higher, and Yields plunged. In contrast, the Bills (Treasuries with a duration of less than 12 months) were funded by the RRP (the Reverse Repo Facility), which went from $1.0 trillion to $600 billion in reserves over the past few months. This was a $400 billion liquidity injection into the markets over a few months, which also helped to offset the liquidity withdrawal effect of QT.
In response, risk assets soared, particularly as longer-duration Bonds were bid – this is a significant easing in financial conditions.
Last Wednesday (January 31st), the Treasury released a new QRA. This showed that issuance was again going to be slightly less than expected but still large overall. Most importantly, the bulk of the issuance would come from Coupons (Treasuries with a duration of 2-10 Years).
Q2 was also guided that not much issuance ($202b) would be issued – seen positively by markets. Q2 is when taxes roll in, so the Treasury can afford to issue less debt.
However, what's very important is that the issuance of Bills was heavily reduced. This is because the Reverse Repo has drained down to the $500b/$600b mark, and there essentially isn't much cash left to fund the purchases of these newly issued Bills. Therefore, the Treasury issues far less and puts the bulk of the debt issuance into Coupons.
This takes the pressure off the Reverse Repo to continue funding the issuance of Bills, meaning that the Reverse Repo should remain flat at $500b/$600b level. The running down of the Reverse Repo added liquidity into the system.
Now, that won't be happening. Most of the drivers of higher asset prices will be from the increased fiscal spending rather than from the running down of the Reverse Repo. But the positive here is that the Treasury is potentially helping to avoid a liquidity issue that may have arisen if the RRP were depleted to $0.
Overall, liquidity should remain positive (due to fiscal spending) but now be slowing down somewhat as the RRP no longer declines. This is still constructive for risk assets, just not as stimulative as the November through January period was, as the drop in RRP injected liquidity into markets.
With this context added, we will now move on to the Fed and how its actions may likely affect risk assets over the coming months.
The Fed's actions and the effects on crypto
The Fed currently finds themselves having raised Interest Rates by 500 basis points, inflation has come down, and the economy has barely weakened at all, bar the Regional Banks Crisis approximately nine months ago, where they then set up the Bank Term Funding Program to help bail out these Regional Banks.In December, Powell delivered an extremely dovish press conference where he essentially forward-guided rate cuts were on the near-term horizon. Since then, financial conditions have eased significantly as the markets have priced in 6 rate cuts for 2024, and risk assets have moved higher.
However, the Houthis (an Iranian proxy) have altered global shipping, and Western ships now have to go around the bottom of Africa rather than through the Suez Canal. This has seen shipping rates quadruple, which is inflationary and will likely begin to show up in the data in the coming months.
Now, most of the disinflation we have seen has been due to falling Goods prices. With this situation in the Red Sea, it's likely Goods inflation will rear up again. The Fed will be aware of this, which may be one reason why Powell and the Fed have opted to push back on a March rate cut in their most recent FOMC (last Wednesday).
But, with strong economic data and the economy potentially looking as if it'll re-accelerate rather than stagnate, risks of inflation moving up again are increasing, particularly while the US has a labour market that is robust with wage inflation also on the up.
This is beginning to put the Fed between a rock and a hard place.
- How can they cut rates when they're not even sure the current rate is restrictive enough?
- With a strong economic outlook, why do they need to cut Interest Rates?
If the economy or, say, the labour market begins to weaken materially, that's when the Fed will consider cutting rates. Fed Member Kashkari supported this towards the back end of last week.
What does this mean for rates and the markets?
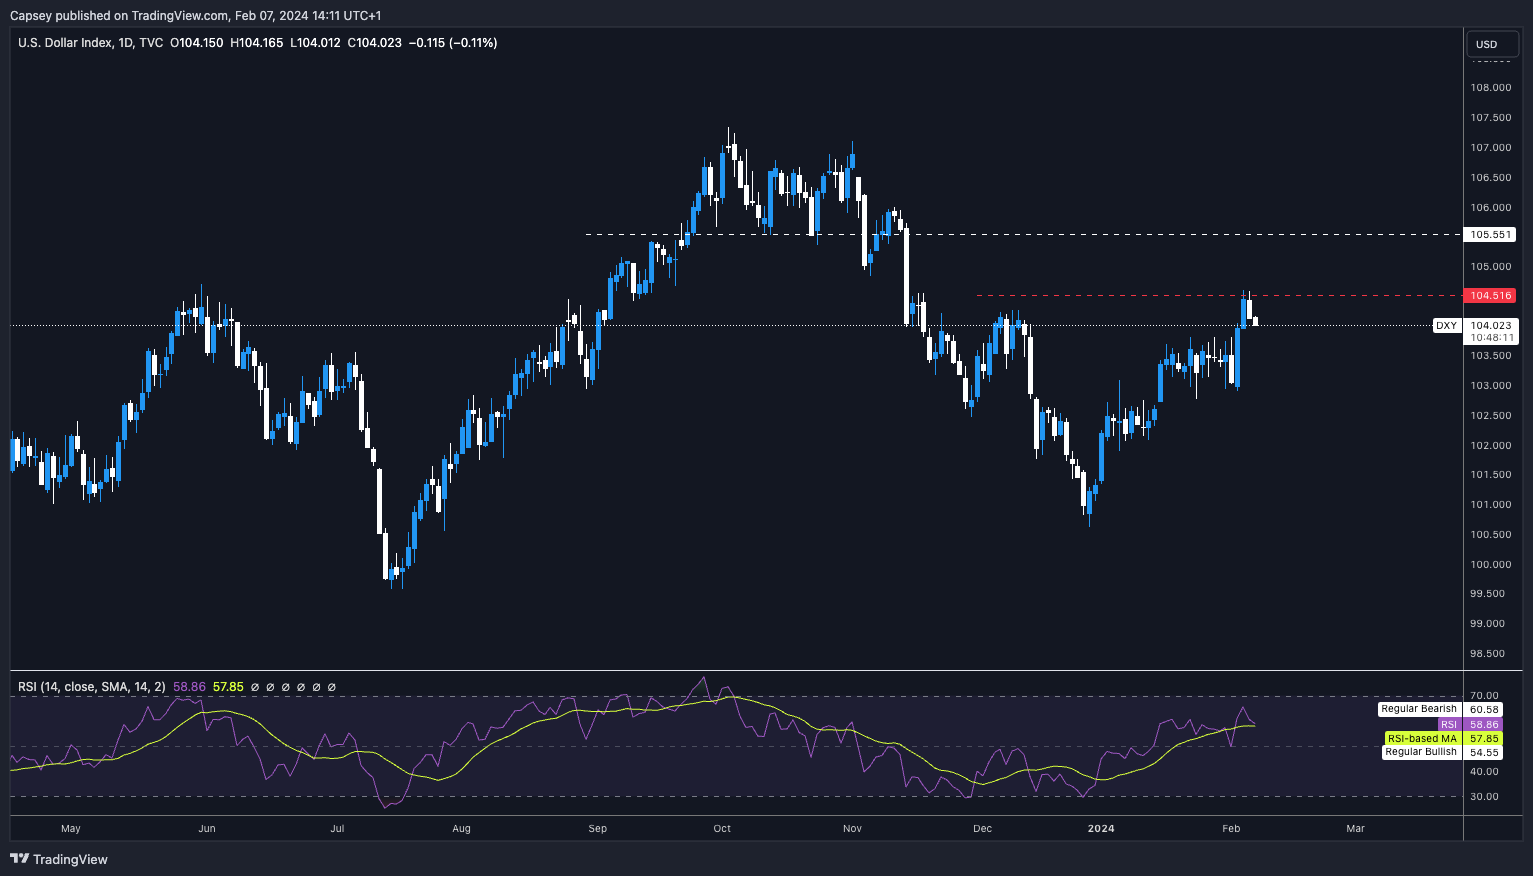
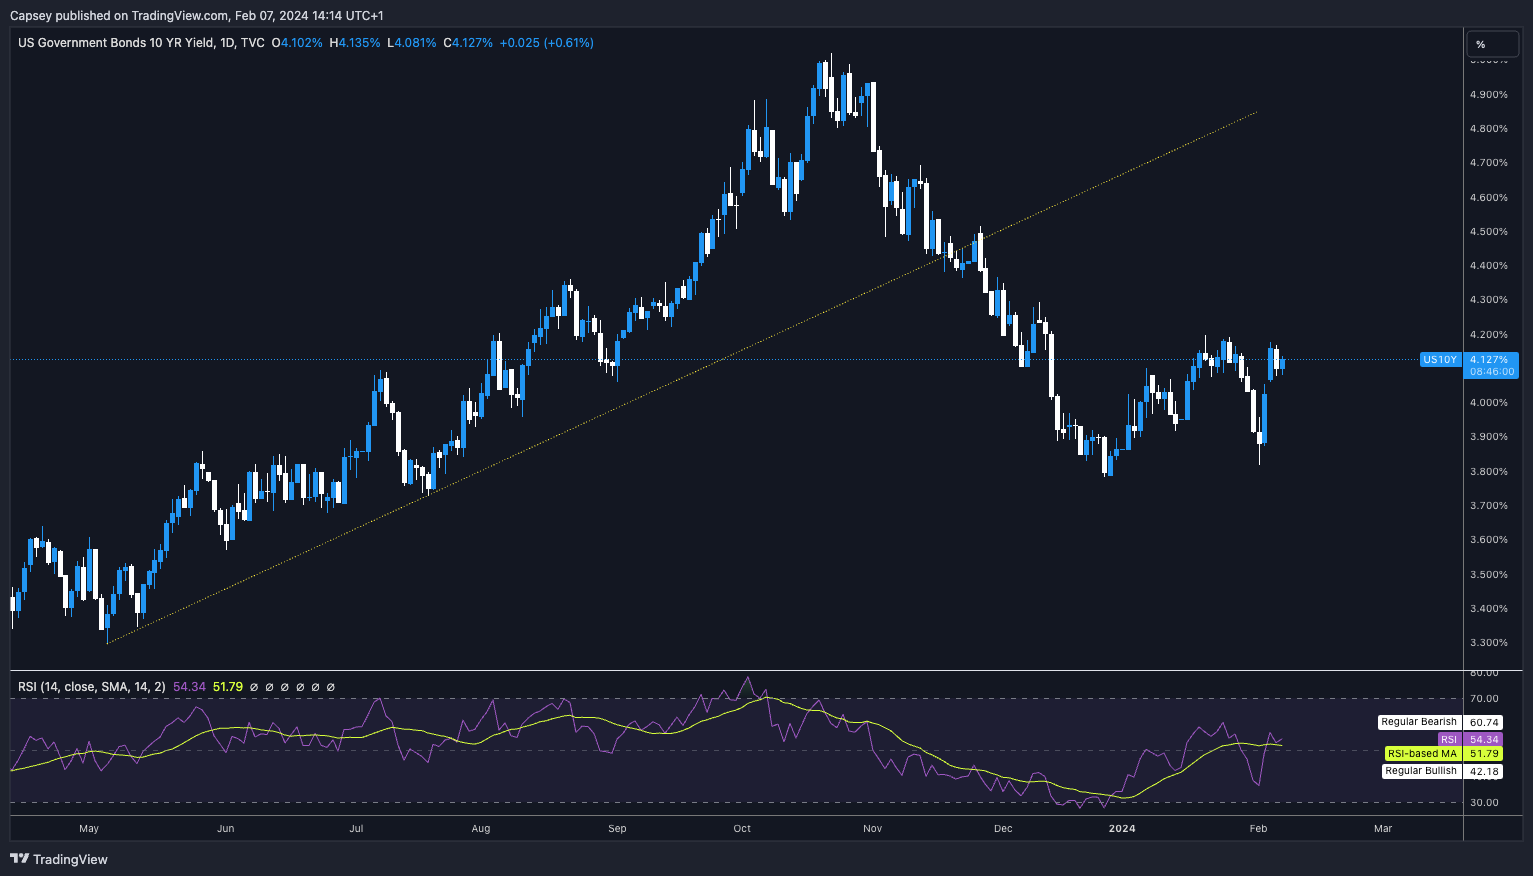
The market is now eyeing the Fed to cut rates at their next meeting on May 1st.However, in our opinion, we think the Fed will look to push rate cuts out to either the June or July meeting. If inflation does rear up again over the coming months, this will only go to pushing rate cuts out even further – worth being aware of this. If we're right and rate cuts get pushed out to, at the earliest, June or July, we're likely to see the DXY (the Dollar Index) and Bond Yields move higher.
We can already see that both have begun re-rating higher.
DXY 1D
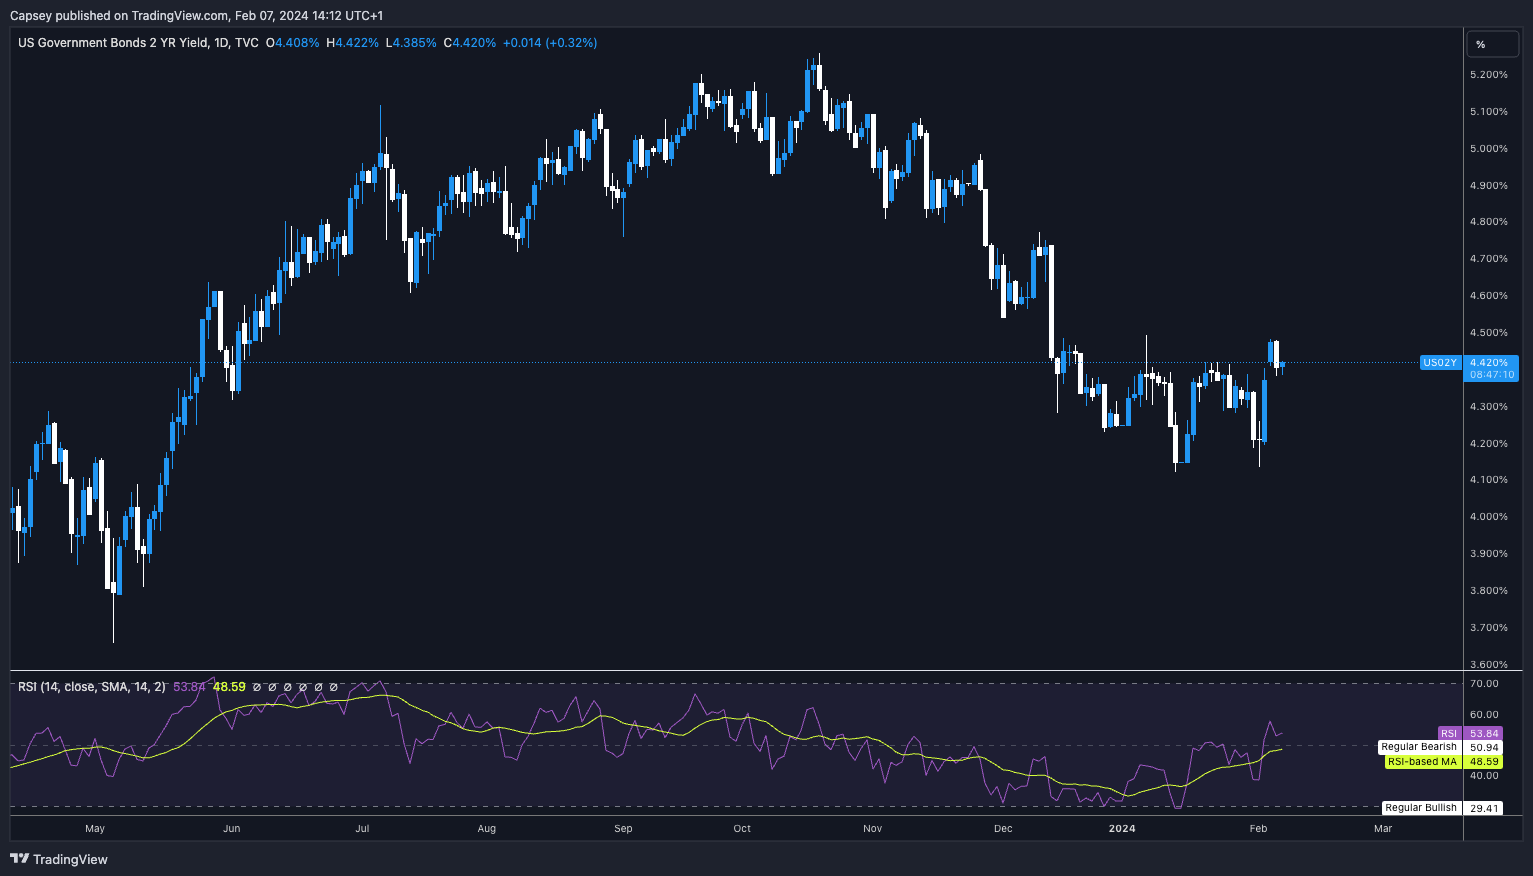
US2Y 1D
US5Y 1D

US10Y 1D
US30Y 1D
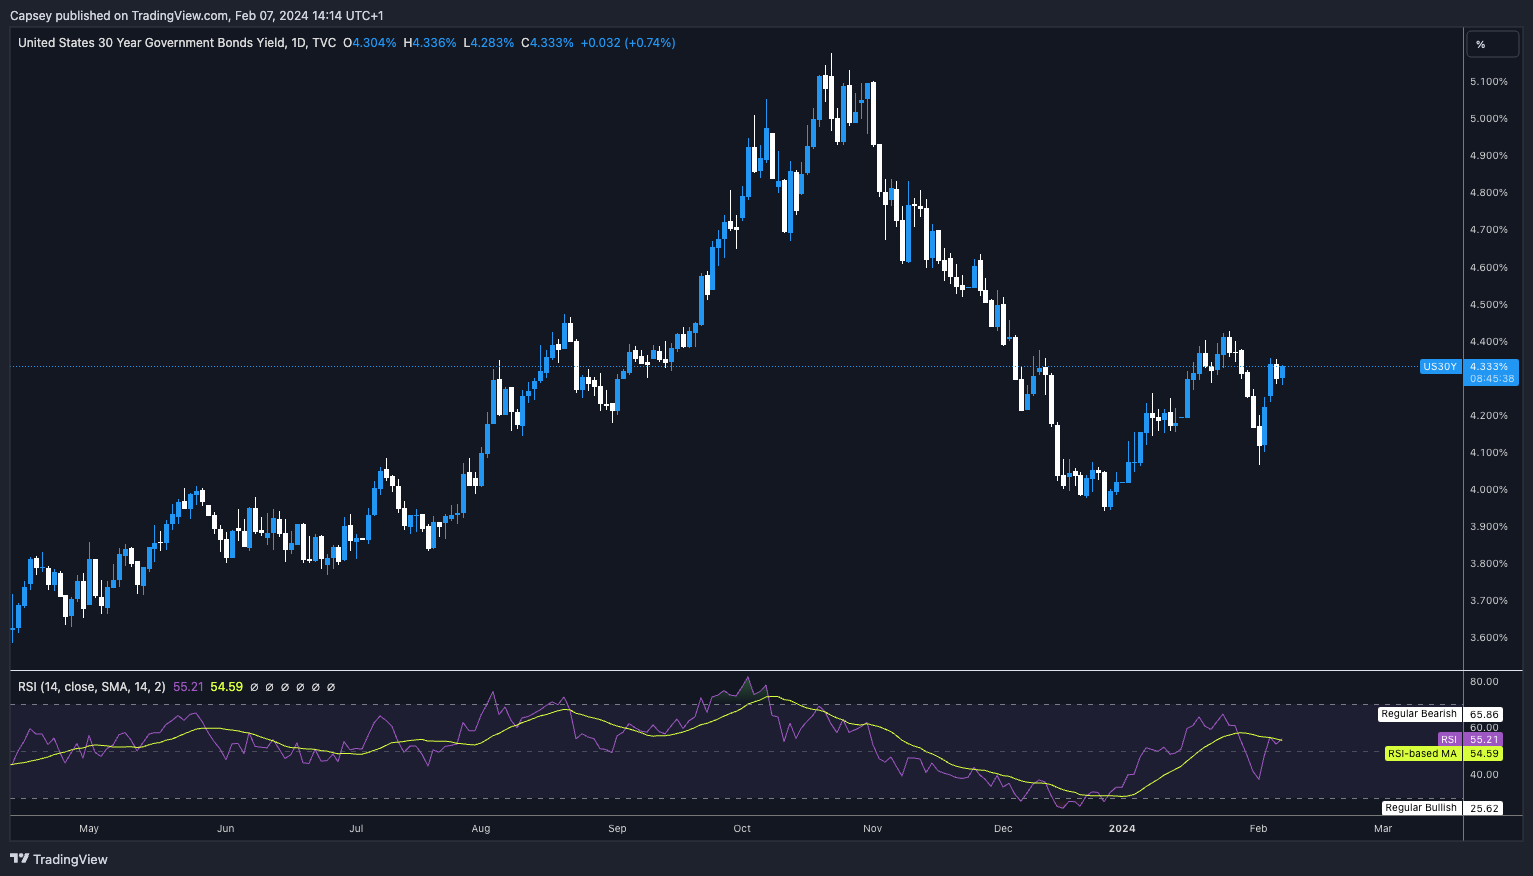
The above is already beginning to show that the middle of the curve (Treasuries with a duration between 2 and 10 Years) are selling off – sending the Yields higher, as this is where the bulk of the debt issuance is.
More supply = prices go lower.
You'd expect that with rising Bond Yields in the very short term, equities/risk assets may begin to sell down slightly.
Crypto would likely not be immune to this. Therefore, crypto may pull back in the coming month or two as the markets price out some of the rate cuts they've priced back in.
But how deep that pullback will be, just a few months before a Bitcoin halving, is the real question.
In the below, we will investigate several crypto-related elements to help us assess this question of how deep a pullback may be.
Factors that may influence the depth of market pullback
ETF flows
Following the approval of several Spot Bitcoin ETFs in early/mid-January 2024, the market saw what almost looked like a blow-off top. This happened as the smart money had already sold large amounts of Bitcoin, and the leverage market was extremely overheated. This selloff left Bitcoin and many altcoins ripe and vulnerable for a flush out.Our Head of Analysis had been calling for this in our channels the week before the ETFs launched and on the actual launch day. It felt like a lonely call at times, with many others calling for $60k imminently when Bitcoin traded at $48k. Ten days later, Bitcoin pulled back to $38,600. The euphoria of the ETFs has now subsided (finally), but this will be a key metric in the future in tracking net flows into/out of these investment vehicles.
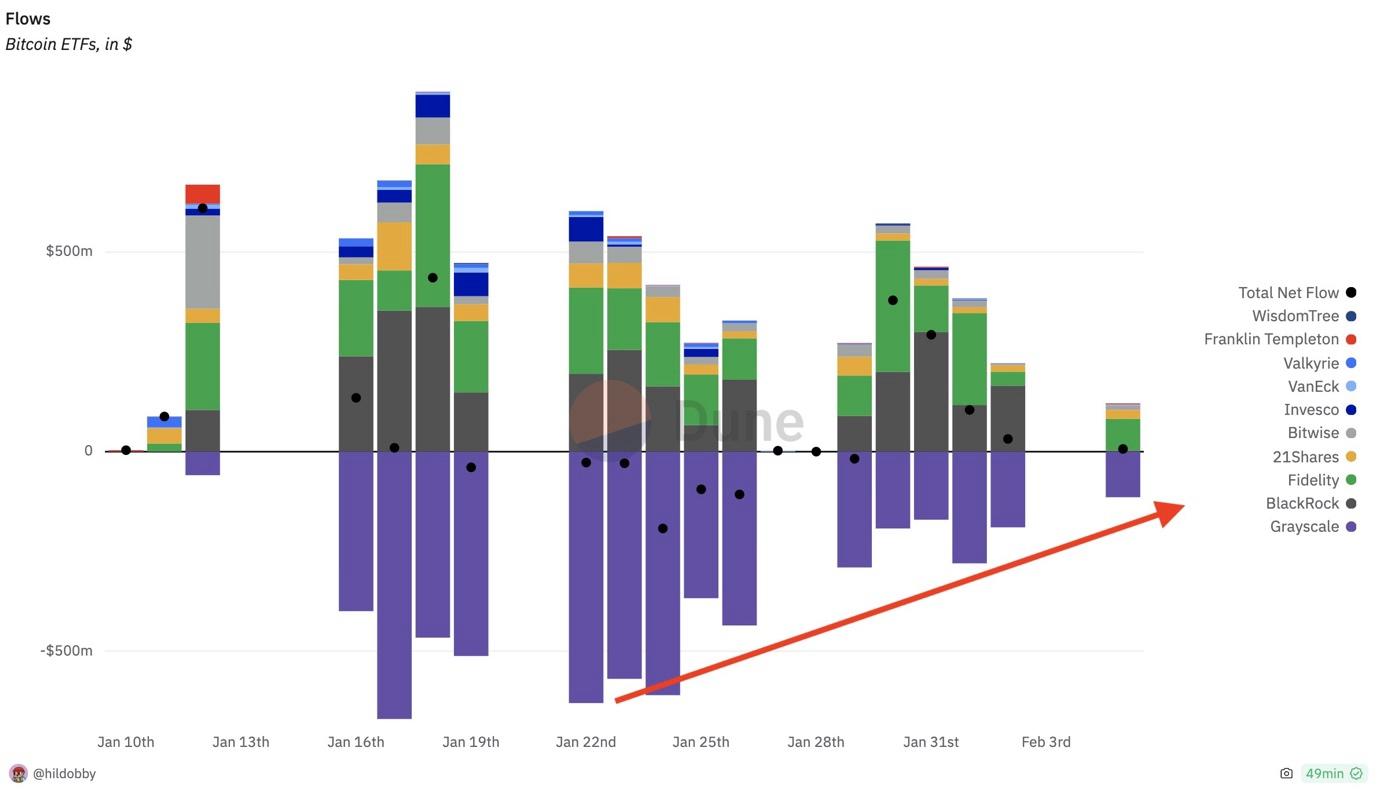
In the first week of trading, we saw the Grayscale ETF recording large outflows. This was mostly due to Grayscale converting their product to an ETF, allowing investors to finally sell their Bitcoin, having been unable to do so for three years.
These large outflows offset the inflows into other ETF products. However, we're now beginning to see that the Grayscale selling is decreasing in dollar terms, which is positive.
But, the inflows into other products are also slowing down. This is likely due to early inflows being rewarded by having to pay reduced fees.
But, when the capacity or cap on these early, reduced fee inflows is reached, that's when more genuine demand will be needed.
The image below showcases this.
Bitcoin ETF – Total Net Flows
Going forward, we will need to assess these metrics continually. We expect bullish signals to come in the form of reduced outflows and increased inflows.
On-chain data
On-chain analysis evaluates blockchain data such as transactions, trades, and wallet address holdings to understand the actions of market participants.We use this data to help us understand what smart money and… 'other' money is doing. We then look to emulate what 'smart money' is doing.
Below, we will look at some different metrics and use them to help us build a thesis on how price may perform in the coming months.
Over the past month, we were essentially of the opinion that the current market looked similar to that of the summer of 2019.
However, the summer of 2019 was approximately ten months before the next Bitcoin halving, whereas now (from the start of this year), we were just four months out from the next Bitcoin halving.
So, there are some slight differences to be aware of.
In the images below, we will look at some market indicator on-chain metrics that currently show setups similar to those of the summer of 2019.
Closely compare the metrics values of now and the summer of 2019.
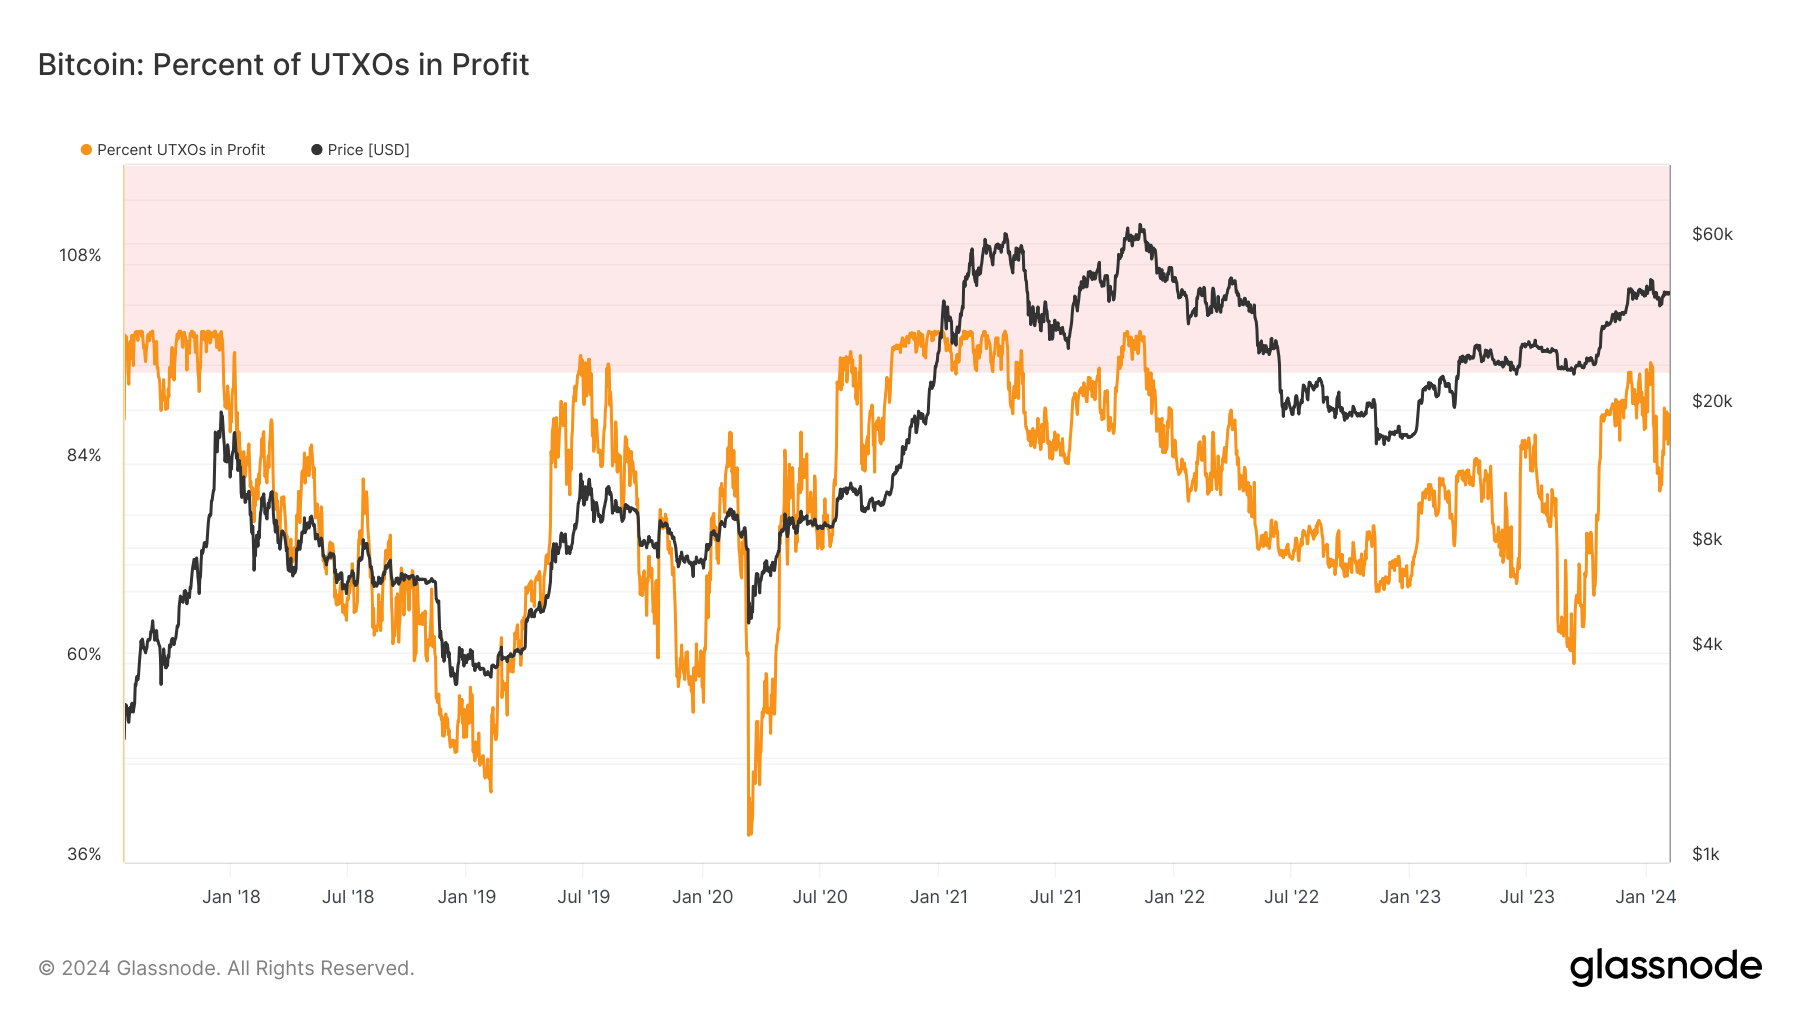
Percent of UTXO's in Profit:
The percentage of unspent transaction outputs whose price at creation time was lower than the current price.
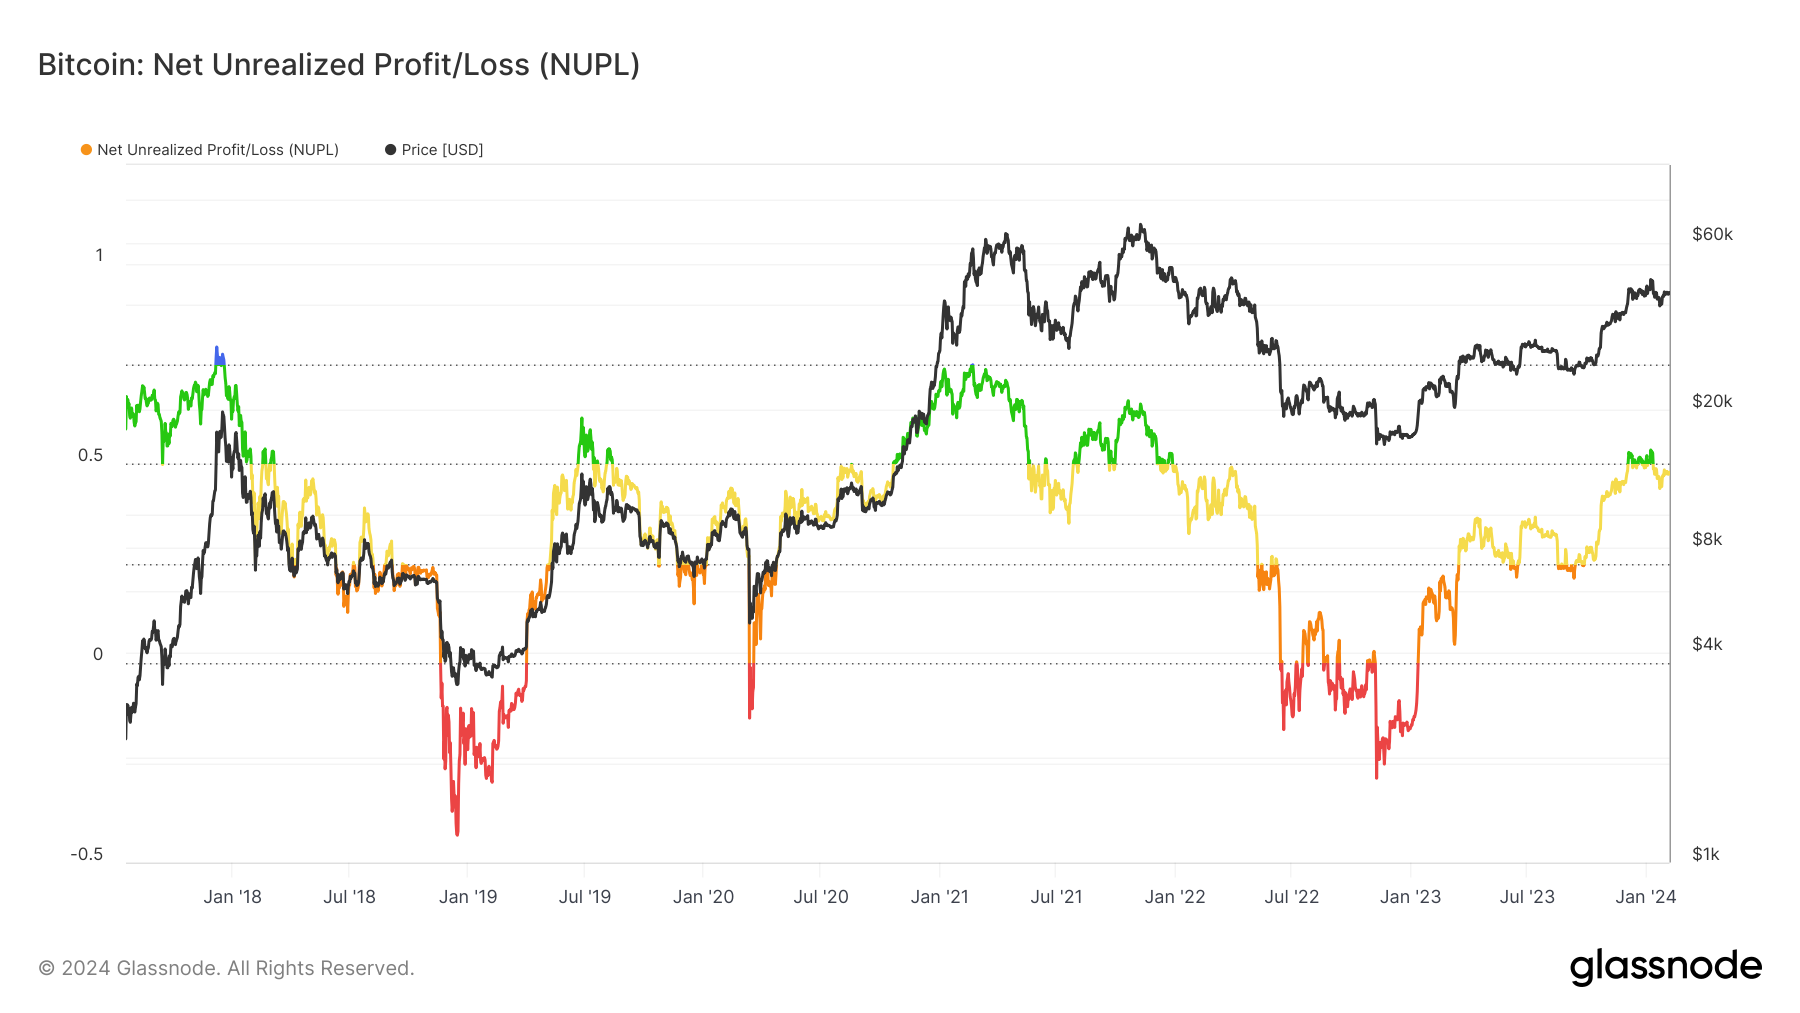
Net Unrealised Profit/Loss:
The Net Unrealised Profit/Loss is the difference between Relative Unrealised Profit and Relative Unrealised Loss.
Net Realised Profit/Loss:
The Net Realised Profit/Loss is the net profit or loss of all moved coins and is defined by the difference between Realised Profit – Realised Loss.
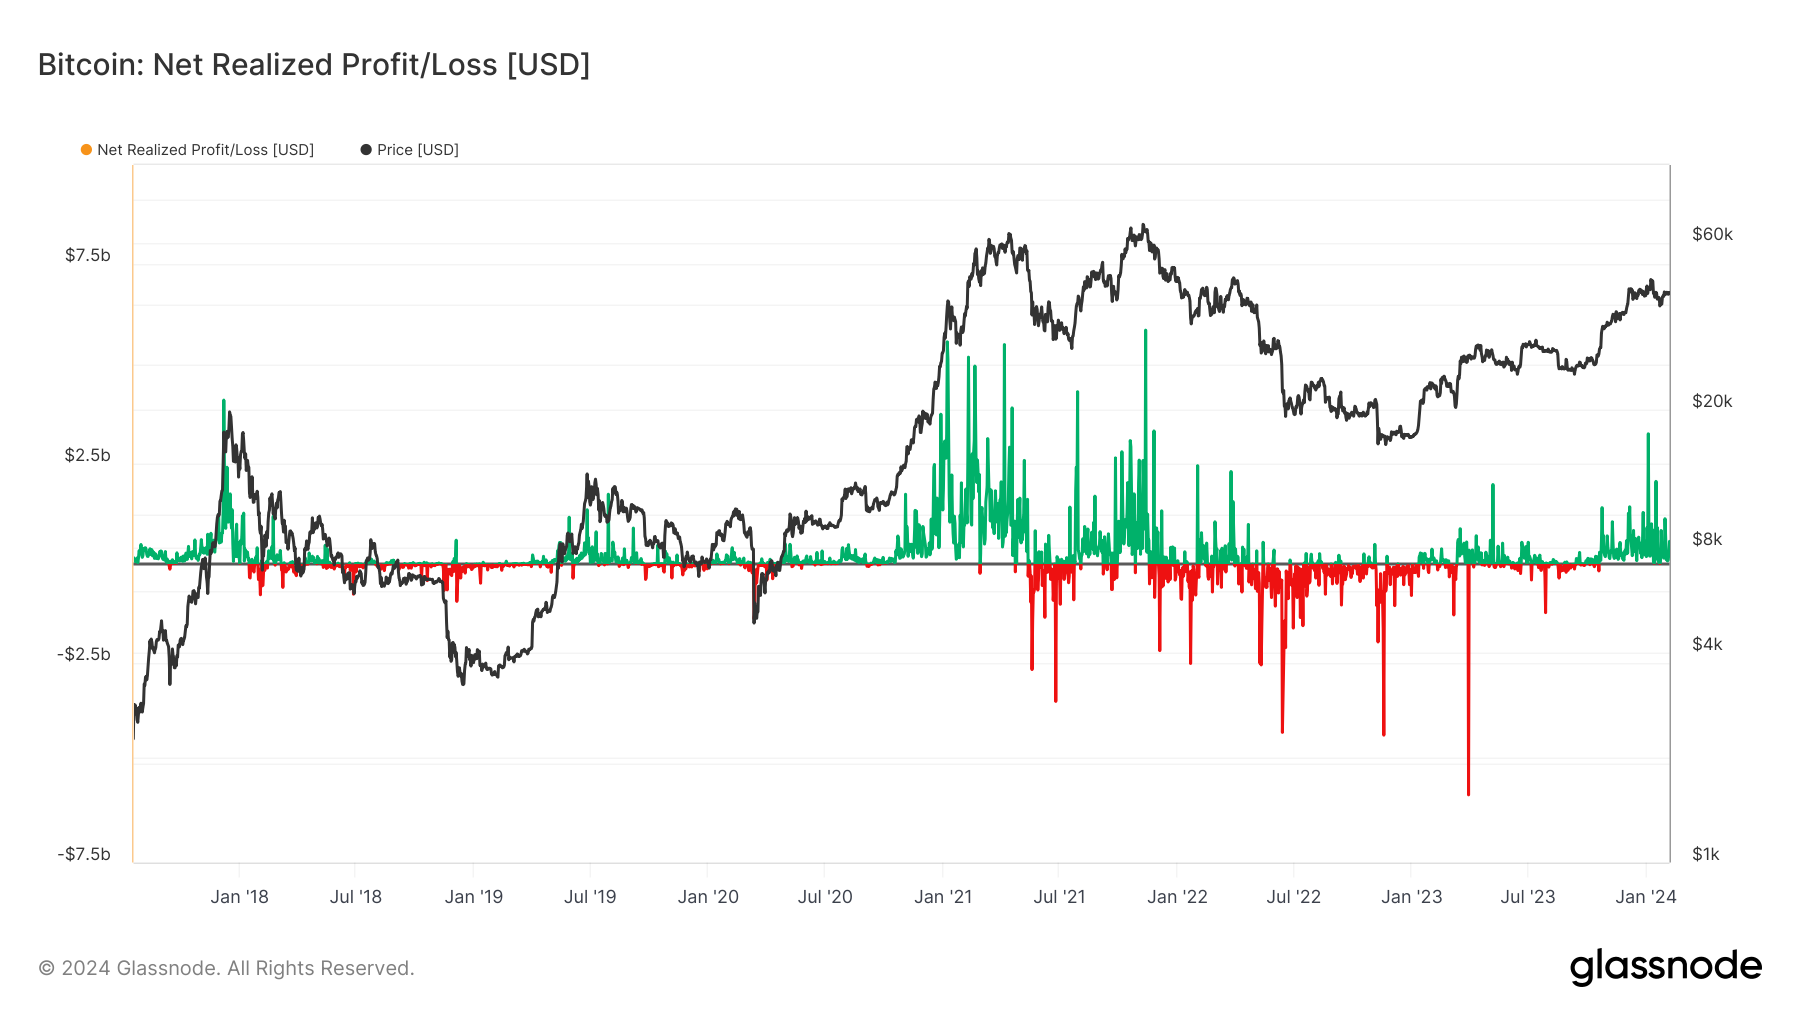
Net Realised Profit/Loss and Net Unrealised Profit/Loss both suggest that a further reset is needed.
Now, this doesn't have to mean significantly lower prices, but potentially a slight pullback and then consolidation or range-bound price action for some time.
The Net Unrealised profit/loss still looks relatively high, and you would expect a dip into the bottom of the range for the yellow line.
Currently, it's very close to the overheated green zone. Alongside this, a consolidatory period for prices would see the Net Realised Profit/Loss chart put in smaller spikes and stay closer to that break-even line – the horizontal line differentiating between green (profit taking) and Red (loss taking).
However, when we look at the Percentage of UTXOs in Profit, the pullback to $38k following the ETF approval looks to have reset this metric slightly, or at least we can see the pullback on the chart.
The above charts suggest that the Bitcoin price may be due for a slight pullback. However, with just 3 months until the next halving, the timeframe to become positioned is narrowing.
If we look at the MVRV Z-Score – one of the best metrics for displaying where we're currently at in the cycle – this suggests that over the coming 2-5 quarters, we should see a lot more upside for Bitcoin.
MVRV Z-Score
The MVRV Z-Score evaluates whether Bitcoin is overvalued or undervalued relative to its "fair value". Instead of using a traditional z-score, the MVRV Z-Score uniquely compares the market value to the realised value. When the market value, measured as network valuation by spot price multiplied by supply, is significantly higher than the realised value, represented by the cumulative capital inflow into the asset, it typically signals a market top (red zone). Conversely, a significantly lower market value than the realised value has often indicated market bottoms (green zone).
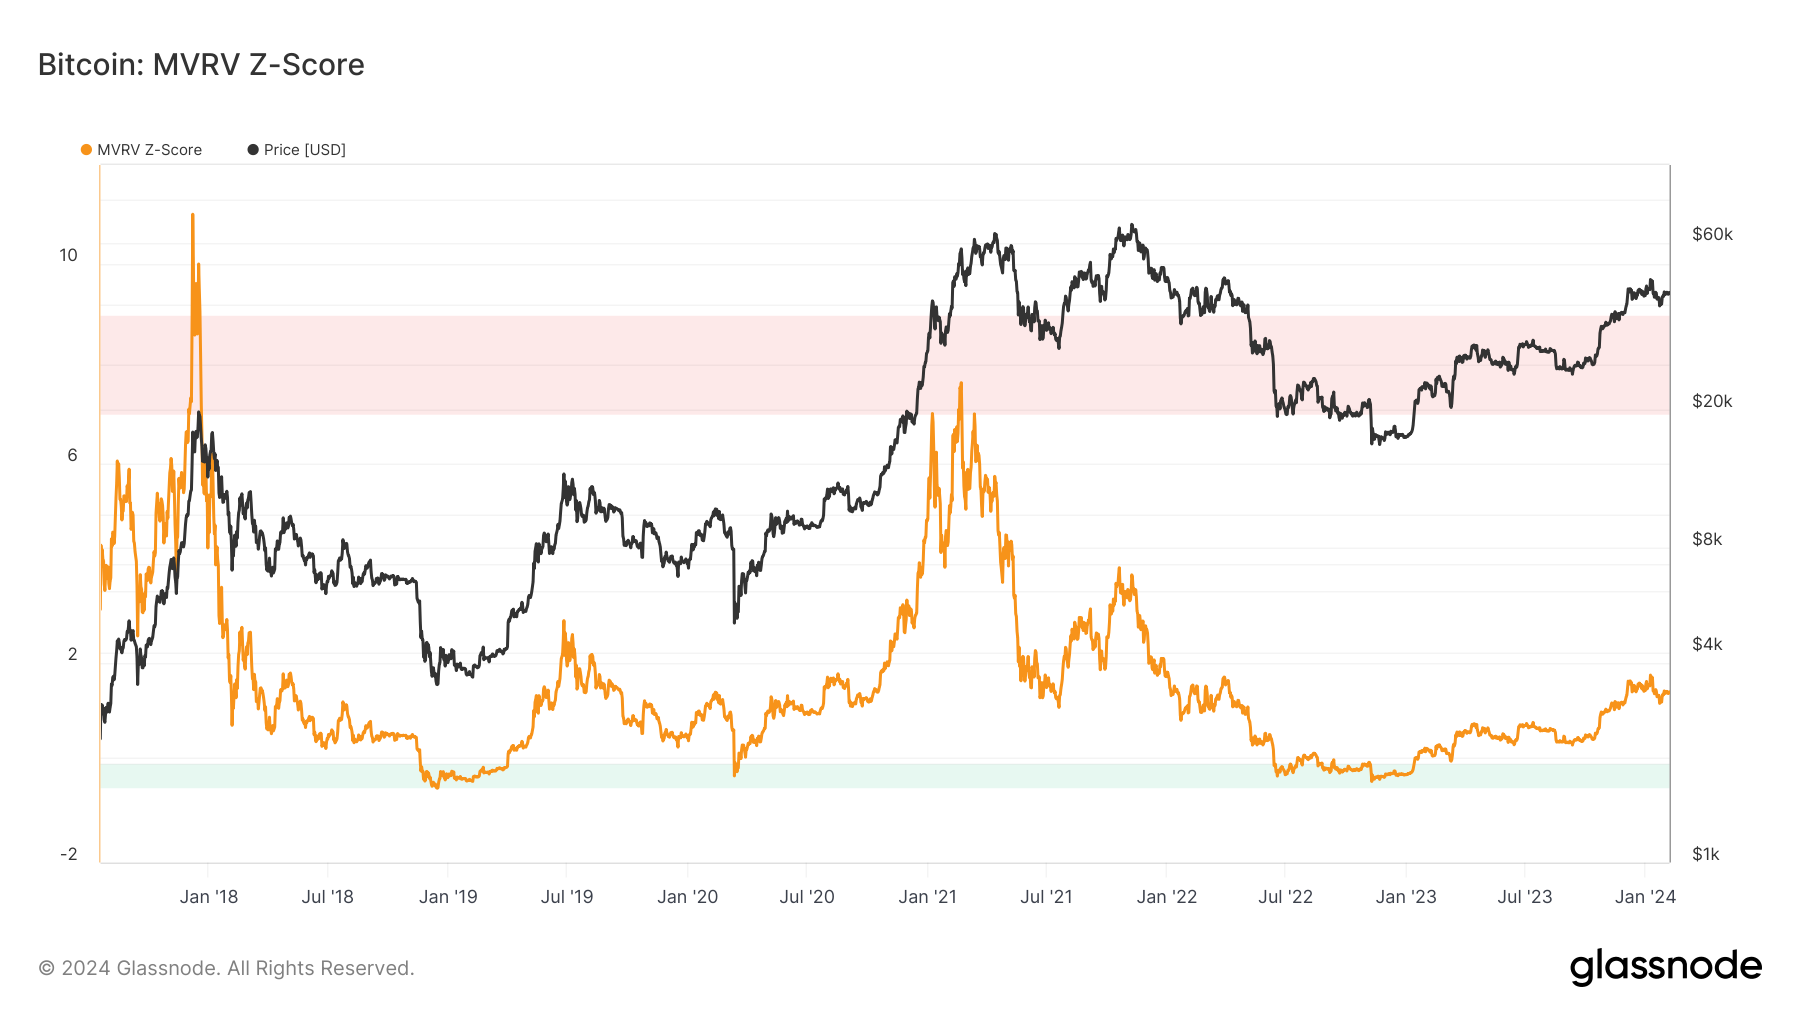
The MVRV Z-Score is not currently in the green or red zone, but it's very low (close to the green zone) and indicates that there is a lot more upside left in this cycle. Once this metric spikes into the red zone, that would be a signal to us to exit our positions.
To summarise the on-chain section of this report;
- We're still early in this cycle, and there should be a considerable upside from current prices.
- Some metrics have gotten closer to 'overheated' levels, considering how early we are still in the cycle. This should warn us that we're still early and meaningful price pullbacks are still possible.
Price action before and after previous Bitcoin halvings
In this section of the report, we will look at prior Bitcoin halvings to see how prices moved at the time of these halvings, hopefully, to help us forecast price action in the coming months.2016 Bitcoin halving
BTC 1 Week Candles Chart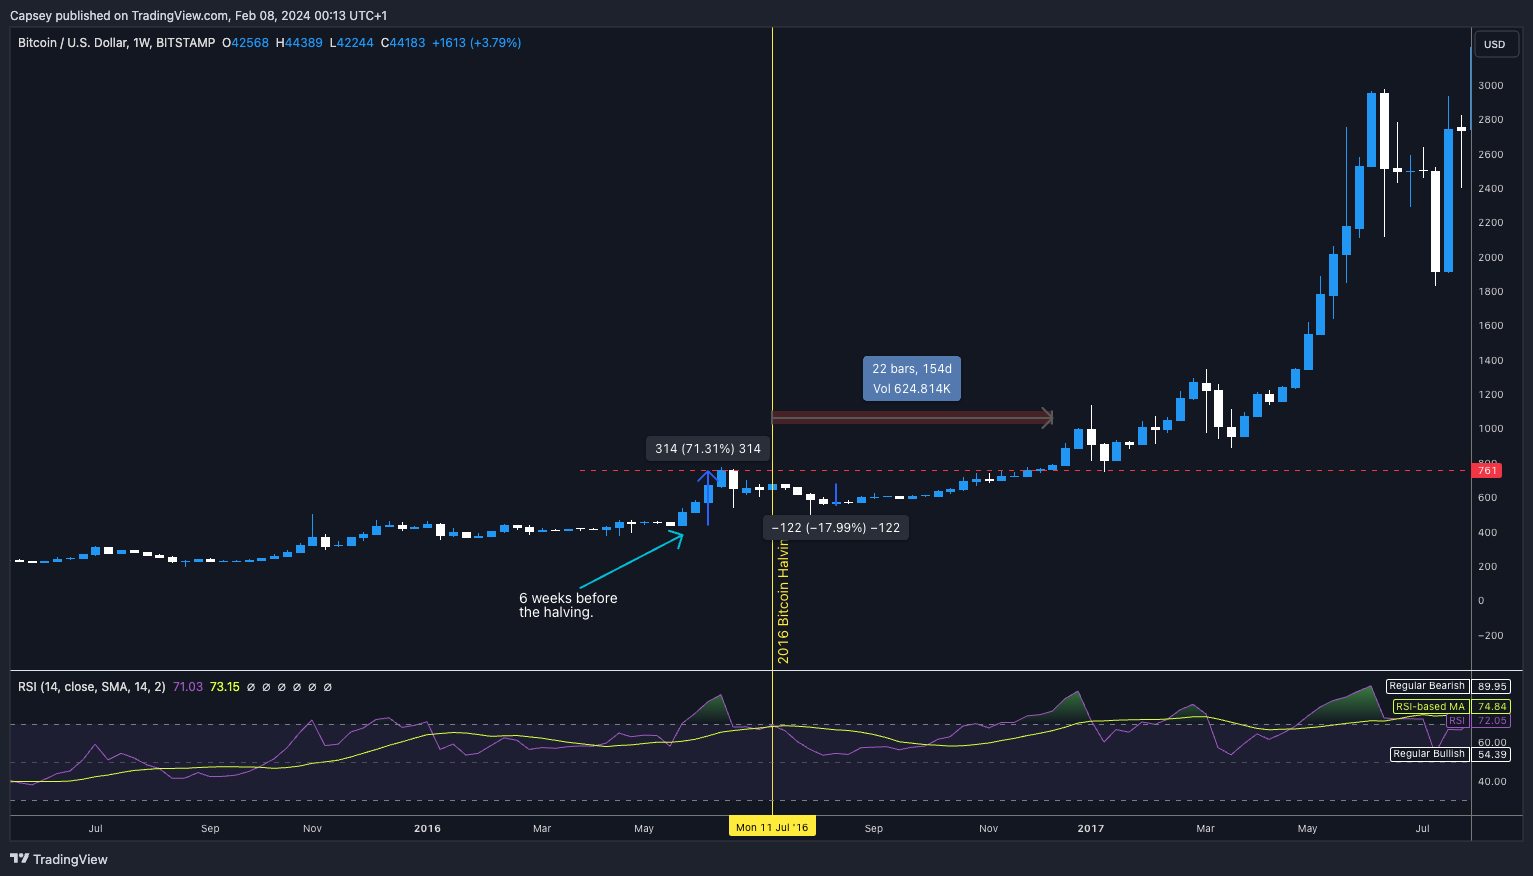
If we look at the 2016 Bitcoin halving, we can see that:
- Six weeks before the halving, price moved up by 70% before pulling back 25% going into the halving.
- In the weeks following the halving, the price declined by 18% and was range-bound in that range. This excludes the flush-out that saw a quick 31% drawdown before quickly recovering.
- Price then stayed between $550 (yes, per Bitcoin) and $760 (per Bitcoin) from the halving in mid-July 2016 until price finally broke out of the range of $760, 154 days later in mid-December.
- Price then moved up from $760 to $19,000 over the next 12 months. Relax, we won't get these kinds of returns again. As each cycle plays out, we usually see diminishing returns.
2020 Bitcoin Halving
BTC 1 Week Candles Chart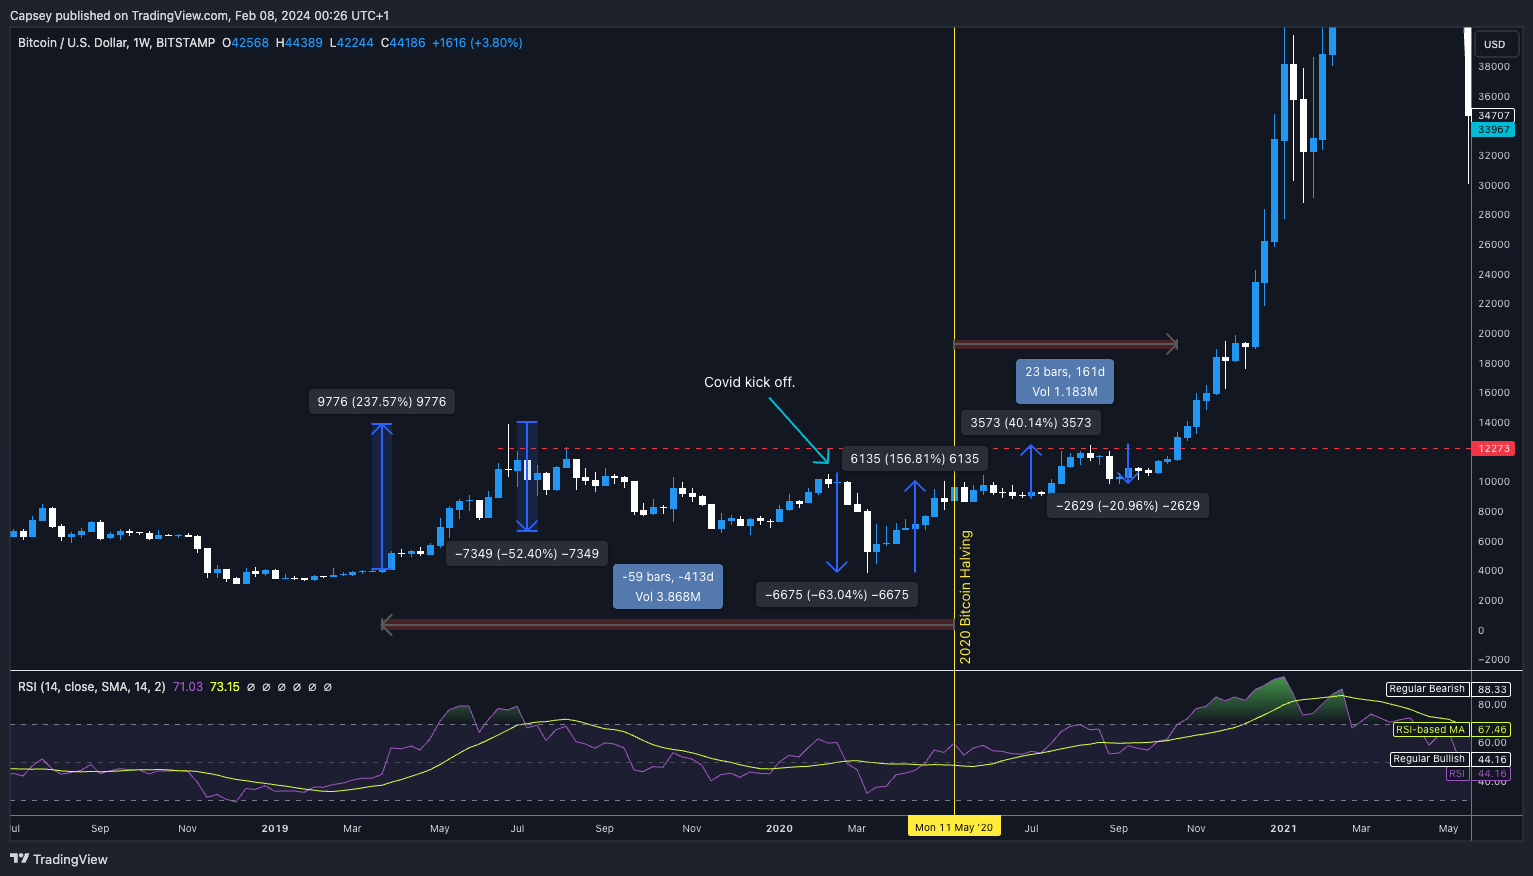
Please forgive the busy chart. The 2020 Bitcoin halving:
- We had a 237% run-up and then a 52% drawdown approximately a year before the halving.
- Prices began to grind higher five months before the halving, but Covid hit. Price declined 63% before the Fed stimulated the economy, and two months later, price fully recovered, having gained 156% going into the halving date.
- Post-halving, the price mostly remained range-bound between $8,600 and $10,100 before climbing to $12,200 3 months after the halving.
- Price then declined 21% before finally breaking out of the overhead resistance of $12,200 161 days (5 and a bit months) after the halving.
Prices will likely grind higher over the coming quarter or two. Still, it's possible the upside/action really begins to kick off at the end of summer when volumes pick up again as big money returns to their desks following their summer holidays.
If there are any major pullbacks, they should be aggressively bought, with more minor pullbacks added, just potentially less aggressively.
Cryptonary's take
With 2024 being a Presidential election year, the Fed (even though they say they're not politically motivated) and the Democrats are doing what they can to keep markets up. The goal is to keep the economy positive in the hope that Biden (Democrat) can beat Trump (Republican) in the November election.Remember, Janet Yellen, the Secretary of the US Treasury and person responsible for issuing debt, is a Biden supporter. The Treasury is, therefore, weaving its way through a tricky path where it continues to issue large amounts of debt (Treasuries) but still keeps liquidity in the markets afloat/positive.
The massive fiscal spending would likely help risk assets perform well throughout 2024.
The pushback to this would be a Fed that does not cut rates (stimulative to the economy) anytime soon as they're focused on the inflation battle. The pricing out of these rate cuts may help the Dollar and Bond Yields go higher in the short term, which could be a headwind to risk assets (crypto).
The Market Indicator on-chain data also supports a potential pullback in prices for Bitcoin and other cryptos in the short term. However, in the long term, they suggest a huge upside in this cycle over the next 12-18 months.
Going forward, fiscal spending will likely continue to drive markets higher. Therefore, we should overweight fiscal spending and underweight Fed policy – assuming they stick to the script and begin to cut rates in June or July.
How we are positioning
Building on our last report in December, the allocation we suggested was 70% crypto exposure and 30% USDT exposure.Pre-halving, it's always great to have ammo on the sides to take advantage of any major pullbacks. In the coming month or two, if the market does pull back slightly, and we're only really expecting a 10-20% decline from current prices - $44,400 for BTC, these pullbacks should be bought up.
A 20% pullback would be a move back to $35k/$36k. We now see this as less likely because of the strong price performance. T
herefore, dips down to $38k to $41k could be bought up with size. Adding to your USDT stockpile with fresh inflows to your pot would be optimal to take advantage of the coming months.
If you're not currently positioned, you're slightly caught between a rock and a hard place as prices have significantly increased over the past three months, but we still have a full post-halving cycle to play out.
Therefore, finding the optimal entries is difficult, and you risk potentially seeing your portfolio drawdown by 10% to 30% in the short term if there are more substantial pullbacks for prices.
However, it would be wise to begin buying at current prices and to really begin to add size on any 3-8% pullbacks until you have built up a substantial position, as in the long term, the current prices are still very attractive.From analysing prior halving events, we've seen that prices remain range-bound in the months following the halving.
So, this doesn't necessarily mean you "have to be in" before the halving. Nor does it mean we can't see any major (20% to 35%) drawdowns in the months after the halving.
But, the odds suggest that being in before the halving and adding to exposure on major price retracements after the halving is a solid strategy.
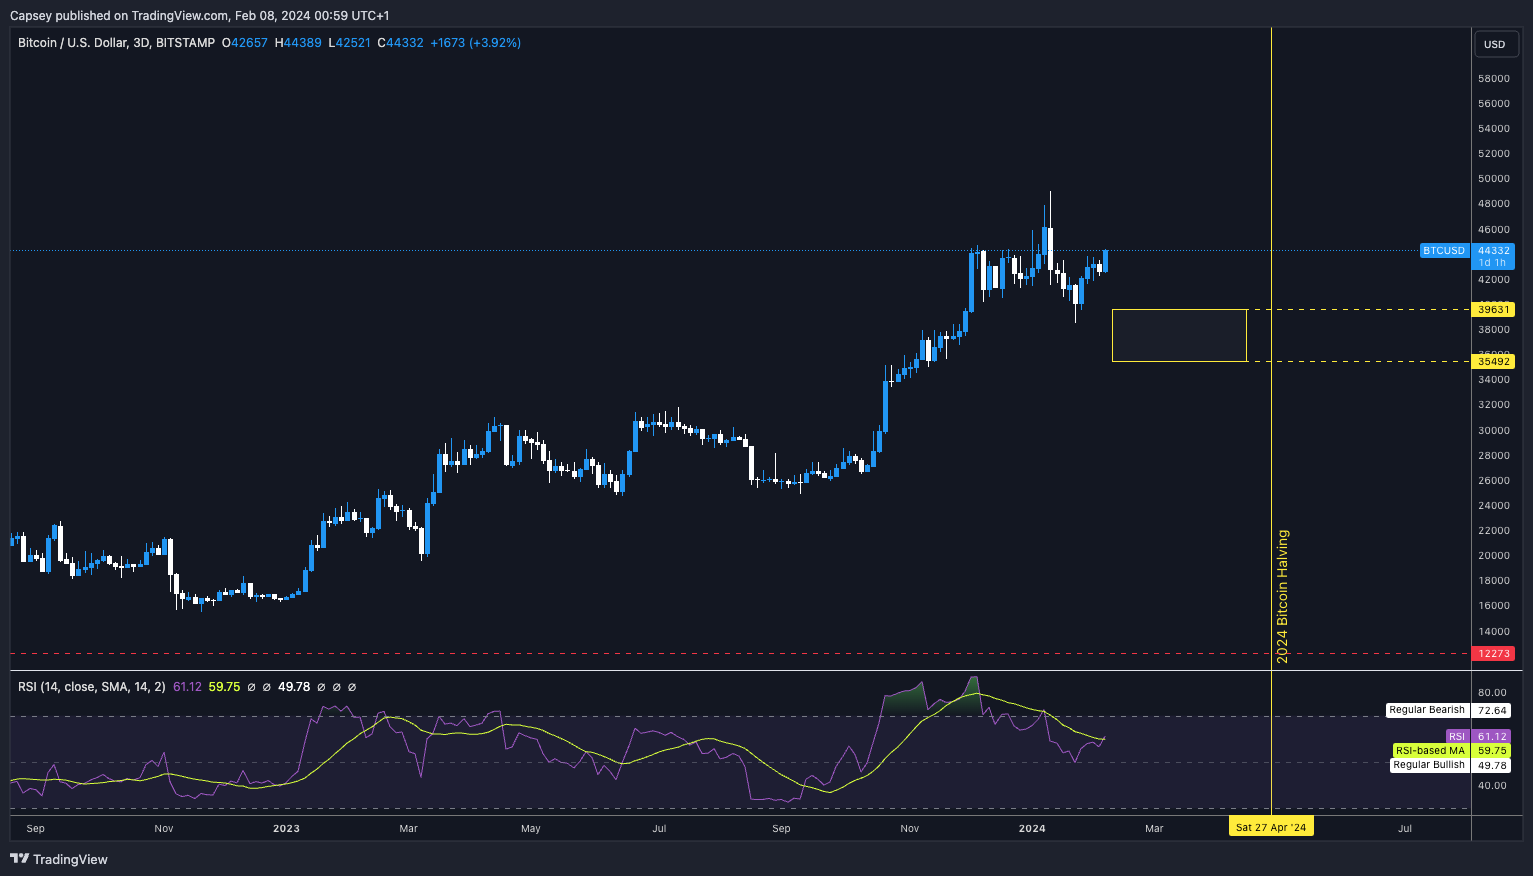
For Bitcoin, if price retraces to the yellow box between $35,500 and $39,600, this area should be bought up.
BTC 3D Chart
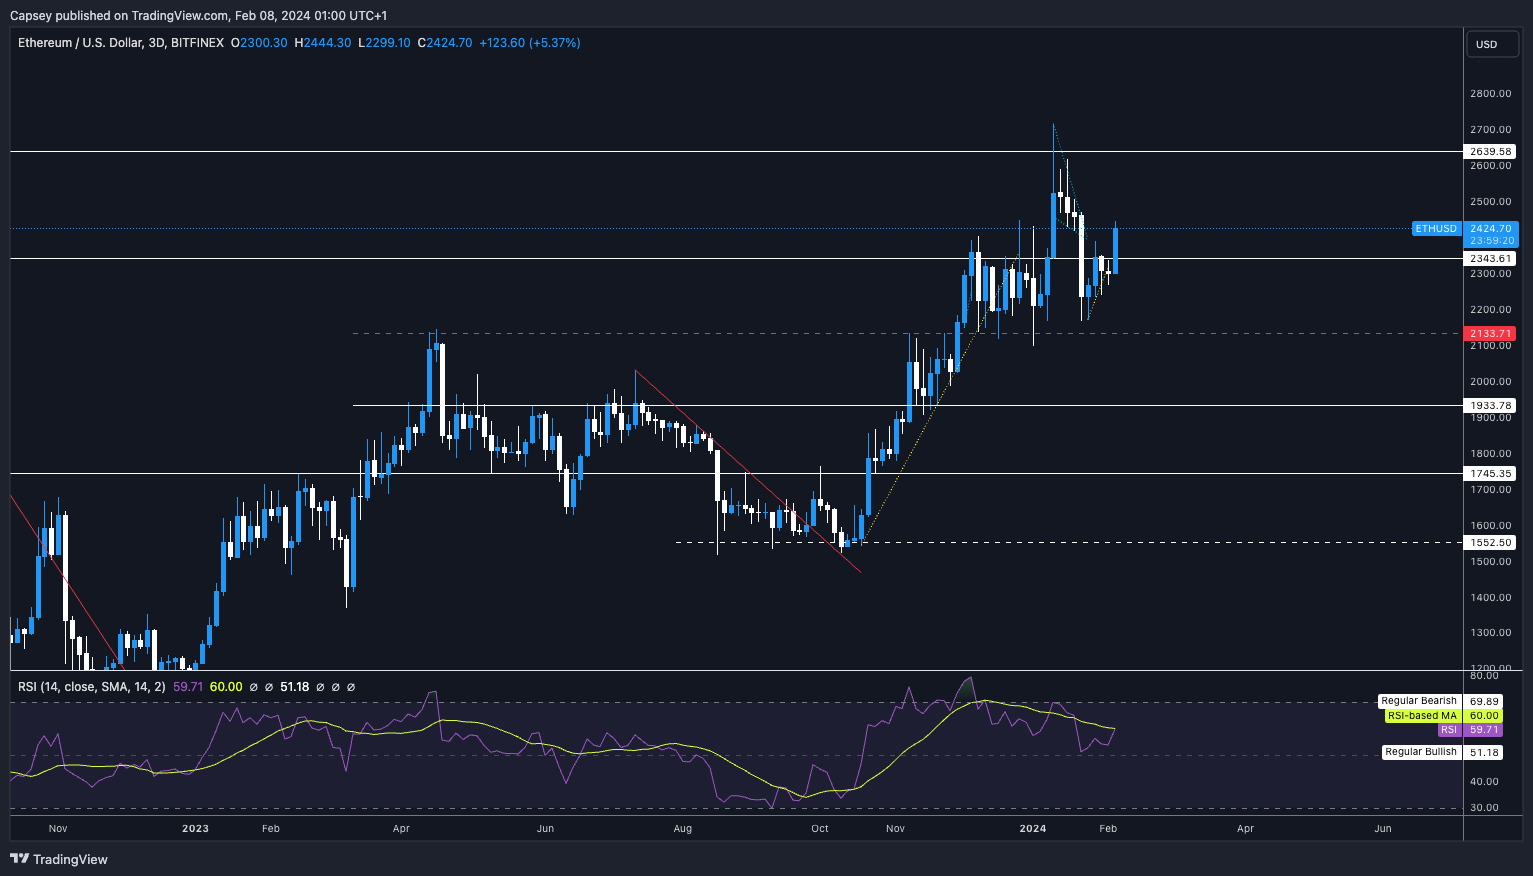
For ETH, anything between $2,020 and $2,200 would be a good long-term buying zone.
ETH 3D Chart
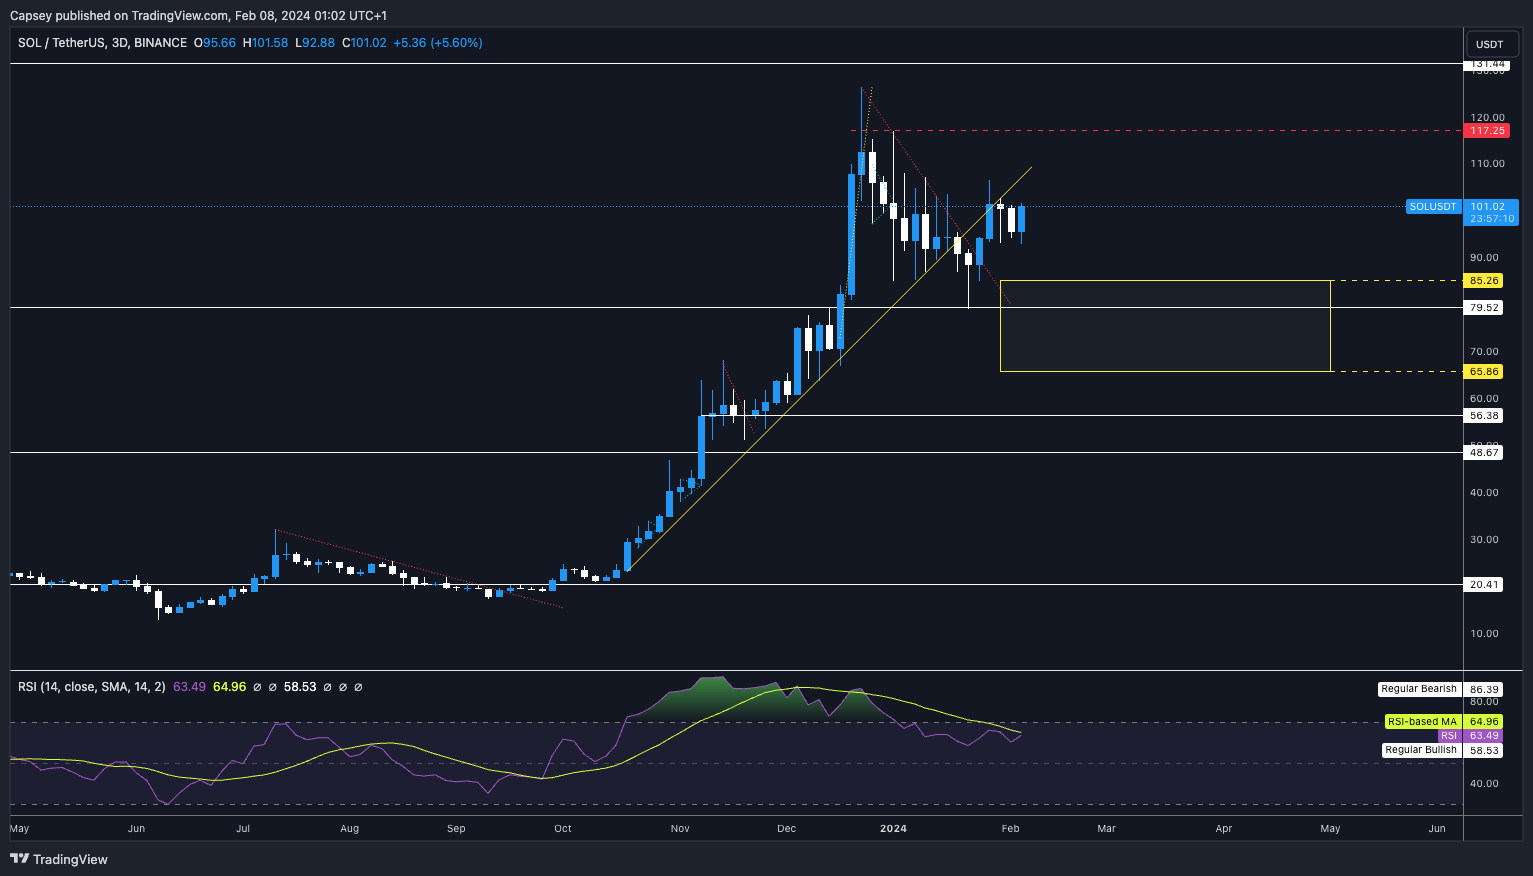
SOL is a tricky one. Anything in the $ 80's should be lightly bought into, and if price falls below $80, anywhere between $66 to $79, this should be more heavily bought up.
SOL 3D Chart
Recommended from Cryptonary


