Save 23% ($351) & Get a Free 1-1 Call with our Team ⏰ : 0d 2h 59m 43s
7 trade setups ahead of tomorrow's inflation data and fed meeting
We're seeing a bit of a market sell-off going into tomorrow's Inflation data and the Fed Meeting. To me (Tom), I think this is a slight overreaction, with participants being very cautious ahead of tomorrow.

However, the bearish overreaction potentially provides an opportunity to take some strategic positions as we navigate the next few months.
Let's get into it.
TLDR
- BTC: If data/Fed is dovish, we will be looking for longs between $66.5k-$66.9k to play a potential bounce to $68k+.
- ETH: Eyeing longs off $3,485 support, targeting $3,730 retest on positive catalysts
- SOL: We favour adding to long-term spot bags sub-$140, especially on a dip to the $131 support zone.
- RUNE: $4.78 horizontal support and oversold RSI make it interesting for a dovish bounce play.
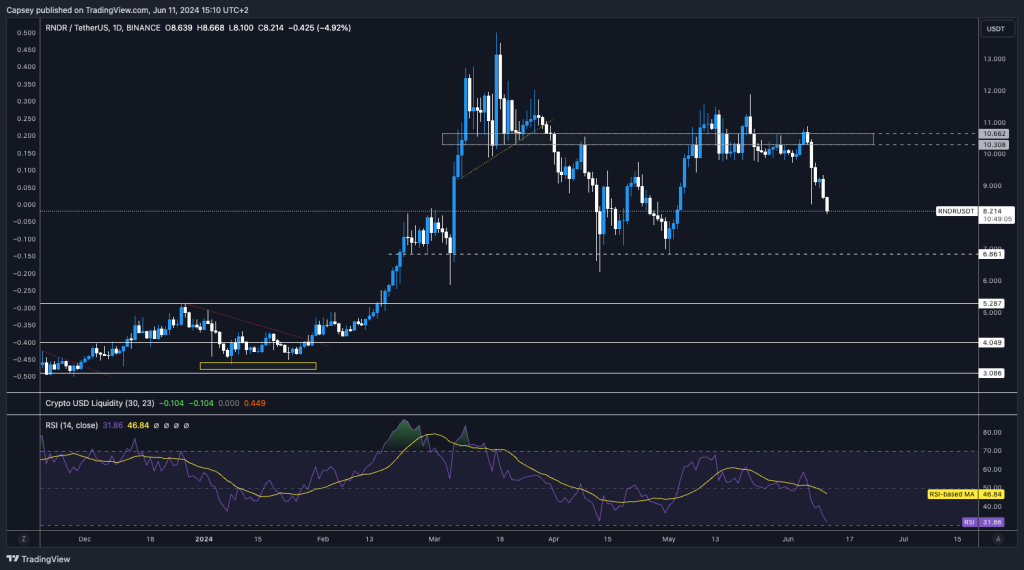
- RNDR: Prime swing long setup between $7-$8, targeting $9.50 on market strength; $6.90 stop loss.
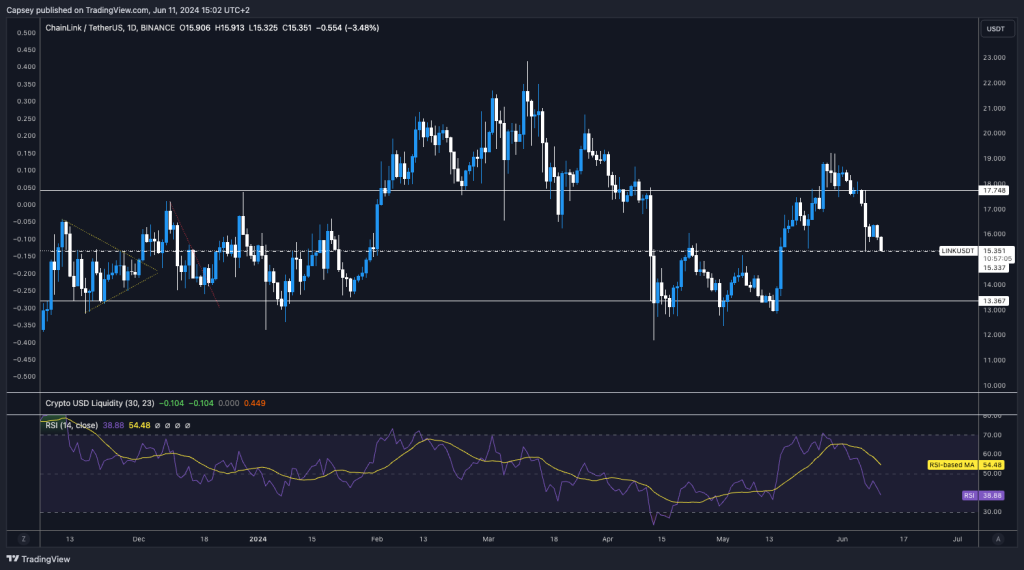
- LINK: It's not looking interesting currently despite a $15.33 support. It lacks catalysts.
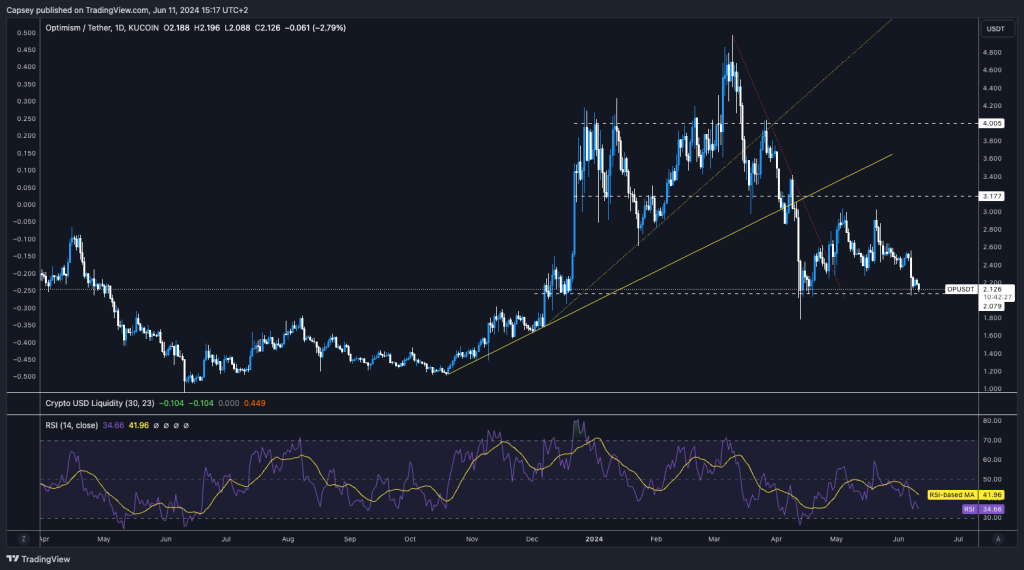
- OP: Potential long-term buy in the $1.60-$1.90 range and ride up as an ETH catch-up play.
Disclaimer: This is not financial or investment advice. You are responsible for any capital-related decisions you make, and only you are accountable for the results.
Context going into tomorrow's inflation and Fed meeting
The bearish outcome tomorrow is if inflation comes in very hot or/and the Fed shows only one interest rate cut in their Dot Plot. Inflation is expected to come in around consensus, which is fine for us markets-wise, and with regards to the Dot Plot, I just don't see why they would show one rate cut for 2024.It's very likely they'll show they're looking to make 2 interest rate cuts in 2024 (which the market will react well to), which will give the Fed optionality going forward. We also expect Powell to come in dovishly.
I (Tom) can absolutely be wrong and can have read this wrong going into tomorrow, but I am looking for Longs today to potentially take advantage of a dovish day tomorrow. I will look to cut the Long positions I built today if we get one of the following tomorrow:
- A much hotter than expected inflation print.
- The Dot Plot comes in with just 1 interest rate cut for 2024.
- In Powell's Press Conference, if he leans to just 1 rate cut for 2024 (despite the Dot Plot potentially showing 2 cuts).
BTC
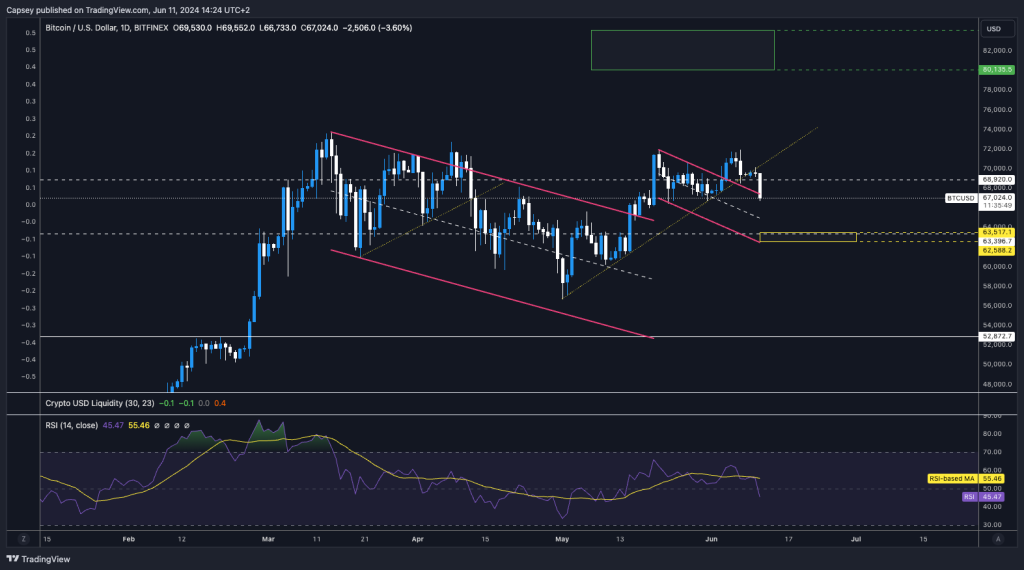
- BTC broke below its local uptrend line and also its horizontal support line at $68,900.
- This has seen a pullback to a local level of support at $67,000.
- The major horizontal support is at $63,400, which I don't expect BTC to fall beneath.
- To the upside, $68,900 will now likely act as local horizontal support, and for price to see a more major breakout, it'll need to get above $71,500.
- There is a local Yellow Buy Box between $62,500 and $63,500, which would likely act as a good entry for Spot bags for someone who is currently under-exposed BTC.
Cryptonary's take
Having fallen beneath the uptrend line and with nerves relatively high going into tomorrow's Inflation data and Fed meeting, we have undergone a slight sell-off.Now, if tomorrow goes bearishly (hotter than expected inflation or a hawkish Fed), then it's possible that BTC will sell down to $63,400. However, we're not expecting this. Personally, we're expecting the opposite. For that reason, I (Tom) am personally looking for light Longs of BTC between $66,500 and $66,900 to potentially sell into an up move if tomorrow goes well.
However, we're not expecting tomorrow to go well or for BTC to break above $71k, so the upside here is probably limited, meaning the trade is potentially just a swing Long from the late $66k into, say the late $68k.
Note: I (Tom) can easily be wrong here, but I have fully disclosed my actions. Let's see how we go.
ETH
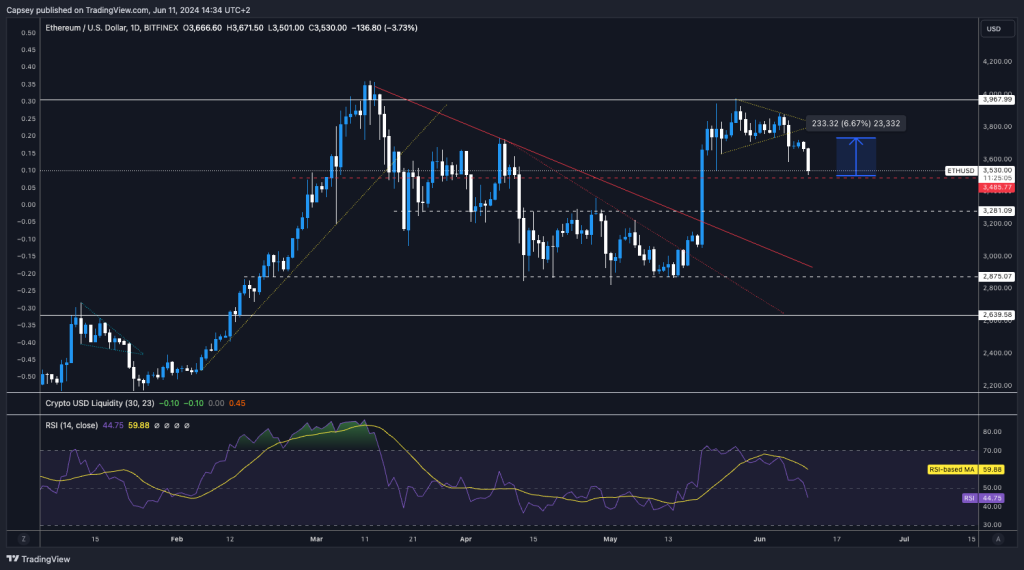
- ETH has broken down from its pennant pattern and has now retested the key horizontal support of $3,485-$3,500.
- If ETH cannot hold above $3,485, then this opens the door to a further move down to the main horizontal support at $3,280.
- If we're right about the market overall, we expect ETH to bounce from $3,485 to potentially retest $3,730 tomorrow.
- The RSI has reset on major timeframes but isn't close to oversold territory.
Cryptonary's take
Going into tomorrow, ETH looks relatively attractive for a short-term Long. This trade looks something like a bounce off of the horizontal support at $3,485 and retesting the $3,730 level.Note that this is just a 24——to 48-hour view on ETH as a potential trade setup. Our deeper analysis will follow tomorrow's conclusion, based on the Inflation data and what the Fed/Powell releases.
SOL
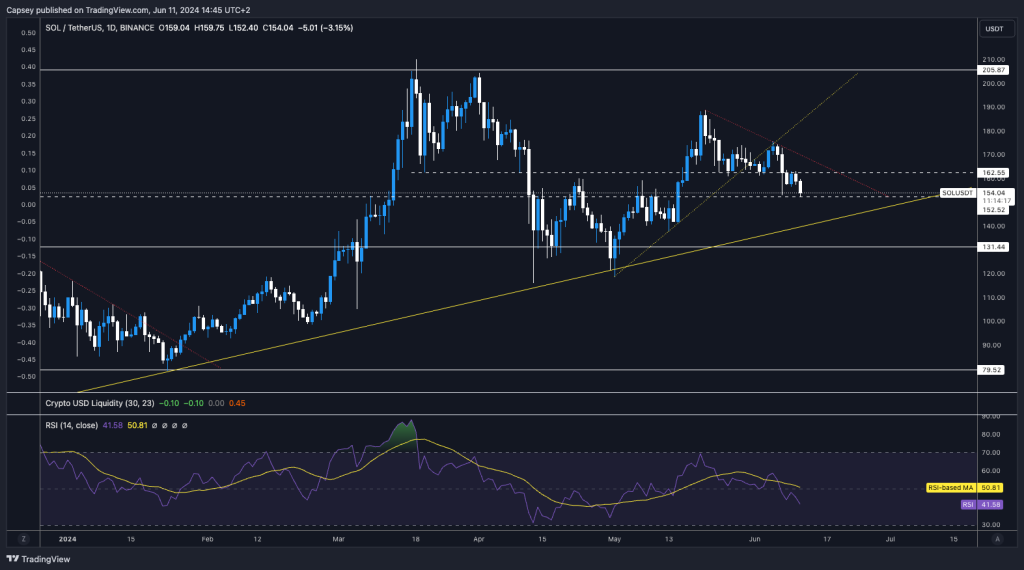
- SOL broke below its local uptrend and found support at the local horizontal support of $162.
- This enabled SOL to get a slight bounce, where it retested the underside of the local uptrend line before rejecting at that level and moving down to form a lower low.
- SOL has now found that lower low at the more major horizontal support of $152.
- Zooming out, SOL has a lot of support between $131 and $152, so we would expect any SOL retracement into this wider zone to be bought up.
- SOL's RSI on the Daily has reset to 41. This should be healthy for future price action, and if this pulls back further (to possibly oversold levels), that would signal a SOL buy for us.
Cryptonary's take
SOL has undertaken a relatively meaningful retracement over the past few weeks, pulling down approximately 20%.While we think BTC and ETH are more attractive Longs right now going into tomorrow, that doesn't mean we're bearish SOL as we do think SOL can bounce from the current level it's at.
Whilst it's possible that over the coming weeks, SOL will likely just be range-bound, we would look to add to our long-term Spot bags at anything sub $140, particularly if there is a retest of $131; however, we're not banking on getting this.
RUNE
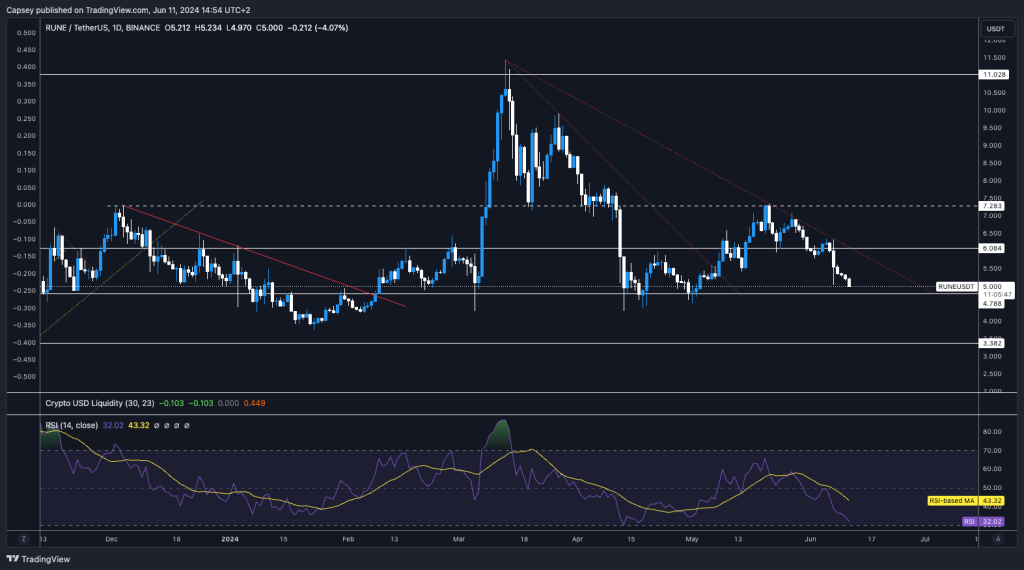
- After RUNE rejected into the horizontal resistance of $7.28, this took the wind out of its sail, and price then fell below the $6.08 horizontal support that would have needed to hold to put in that higher low.
- Since then, the price has moved lower and has come close to testing the major horizontal support of $4.78, which you'd expect to see a reaction (bounce) from.
- RUNE is compressing into a downtrend, where it may squeeze into the pinpoint where the downtrend line meets the horizontal support line of $4.78. This could set up a bullish breakout. However, the current market structure doesn't yet support this, but a dovish Fed tomorrow could change that.
- RUNE is close to oversold conditions on the RSI on the Daily timeframe. This should be an area of support for price, particularly as this aligns with the horizontal support of $4.78.
Cryptonary's take
RUNE hasn't given the bulls too much hope/faith recently, but if market conditions improve (a dovish Fed and a softer Inflation print tomorrow could do this), then RUNE may be in a good area to bounce from. This area is the horizontal support of $4.78, which has been a major support, plus the RSI is close to overbought territory.If price loses $4.78, then expect RUNE to be weighed down for at least a few weeks purely out of a lack of momentum. There are some key levels on RUNE that price needs to hold above and ideally bounce from. A positive day tomorrow could do this. Let's see how it does.
LINK
- LINK lost the horizontal support of $17.78 and it has essentially been straight down since losing that key level.
- Price now finds itself at another key level, the horizontal support of $15.33, to which you'd hope to see a reaction from price.
- The RSI has reset but isn't yet close to oversold conditions that we'd likely need to see before becoming confident in opening a Long trade.
Cryptonary's take
Even though LINK's price is now just above an important horizontal support, not much else gives us confidence that it can bounce from here in the immediate short term—unless the market as a whole drags it up, and even if it does, others will likely outperform.Overall, we're just not interested in LINK here. There are better setups elsewhere, and there just aren't enough convincing signs for us to put capital into LINK currently. I am not interested in LINK at the moment.
RNDR
- Since rejecting from the key battle horizontal zone of $10.30 to $10.66, price has pulled back more drastically, undergoing a 20% decline.
- Price is now approaching a key zone of support between $6.90 and $7.70, where it has previously been heavily bought into.
- Alongside this, the RSI is now just slightly above oversold conditions on the Daily timeframe.
Cryptonary's take
Personally, I (Tom) like this setup if the market can bounce tomorrow. The setup here would be to layer Longs between $7 and $8. Yes, this is a very wide entry zone, so we would use no leverage or a very small amount in this Long.We'd expect price to find a final support at $6.90 if it gets as low as that, and below that would be the stop Loss. RNDR is a coin that has shown considerable strength over prior months, so it may be worth taking advantage of the current pullback we're getting.
A lot can change following tomorrow's outcomes, but for now, we think RNDR provides a nice potential trade setup. The target for the upside of the Long would be $9.50.
OP
- Performance-wise, OP has been poor recently, having pulled back 60% since early March.
- Price has now been range bound between $2.05 and $3.00 for the last two months.
- Price is now sitting on top of horizontal support of $2.05, and the RSI is close to oversold territory.
Cryptonary's take
OP can be seen to be beta for ETH, however it has underperformed recently for sure.But with an upcoming ETH ETF, OP may have room for some catching up. While it's possible that price could fall below the $2.05 horizontal support, anything between $1.70 and $2.00 should be relatively solid support.
Therefore, with a very long-term view (potentially 6-12 months), OP could be considered a good buy if it deviates below $2.05. Entries for OP between $1.60 and $1.90 will likely reap good returns in the coming quarters.
This isn't a position we'd go 'gun-ho' with in terms of size, but it may be a good trade that is also somewhat of a diversifier away from our more SOL ecosystem bias.
Recommended from Cryptonary


