Save 23% ($351) & Get a Free 1-1 Call with our Team ⏰ : 0d 2h 59m 43s
Disclaimer: This is not financial or investment advice. You are responsible for any capital-related decisions you make, and only you are accountable for the results.
Market context
AVAX has been one of the strong performers this cycle, with a notable 630% move from the lows before October's run. Although it hasn't been as explosive as some meme coins, its price action has been solid, showing aggressive buying during periods of upside momentum. The recent consolidation phase is correlated with the overall market, so the bearish price action isn't necessarily negative.
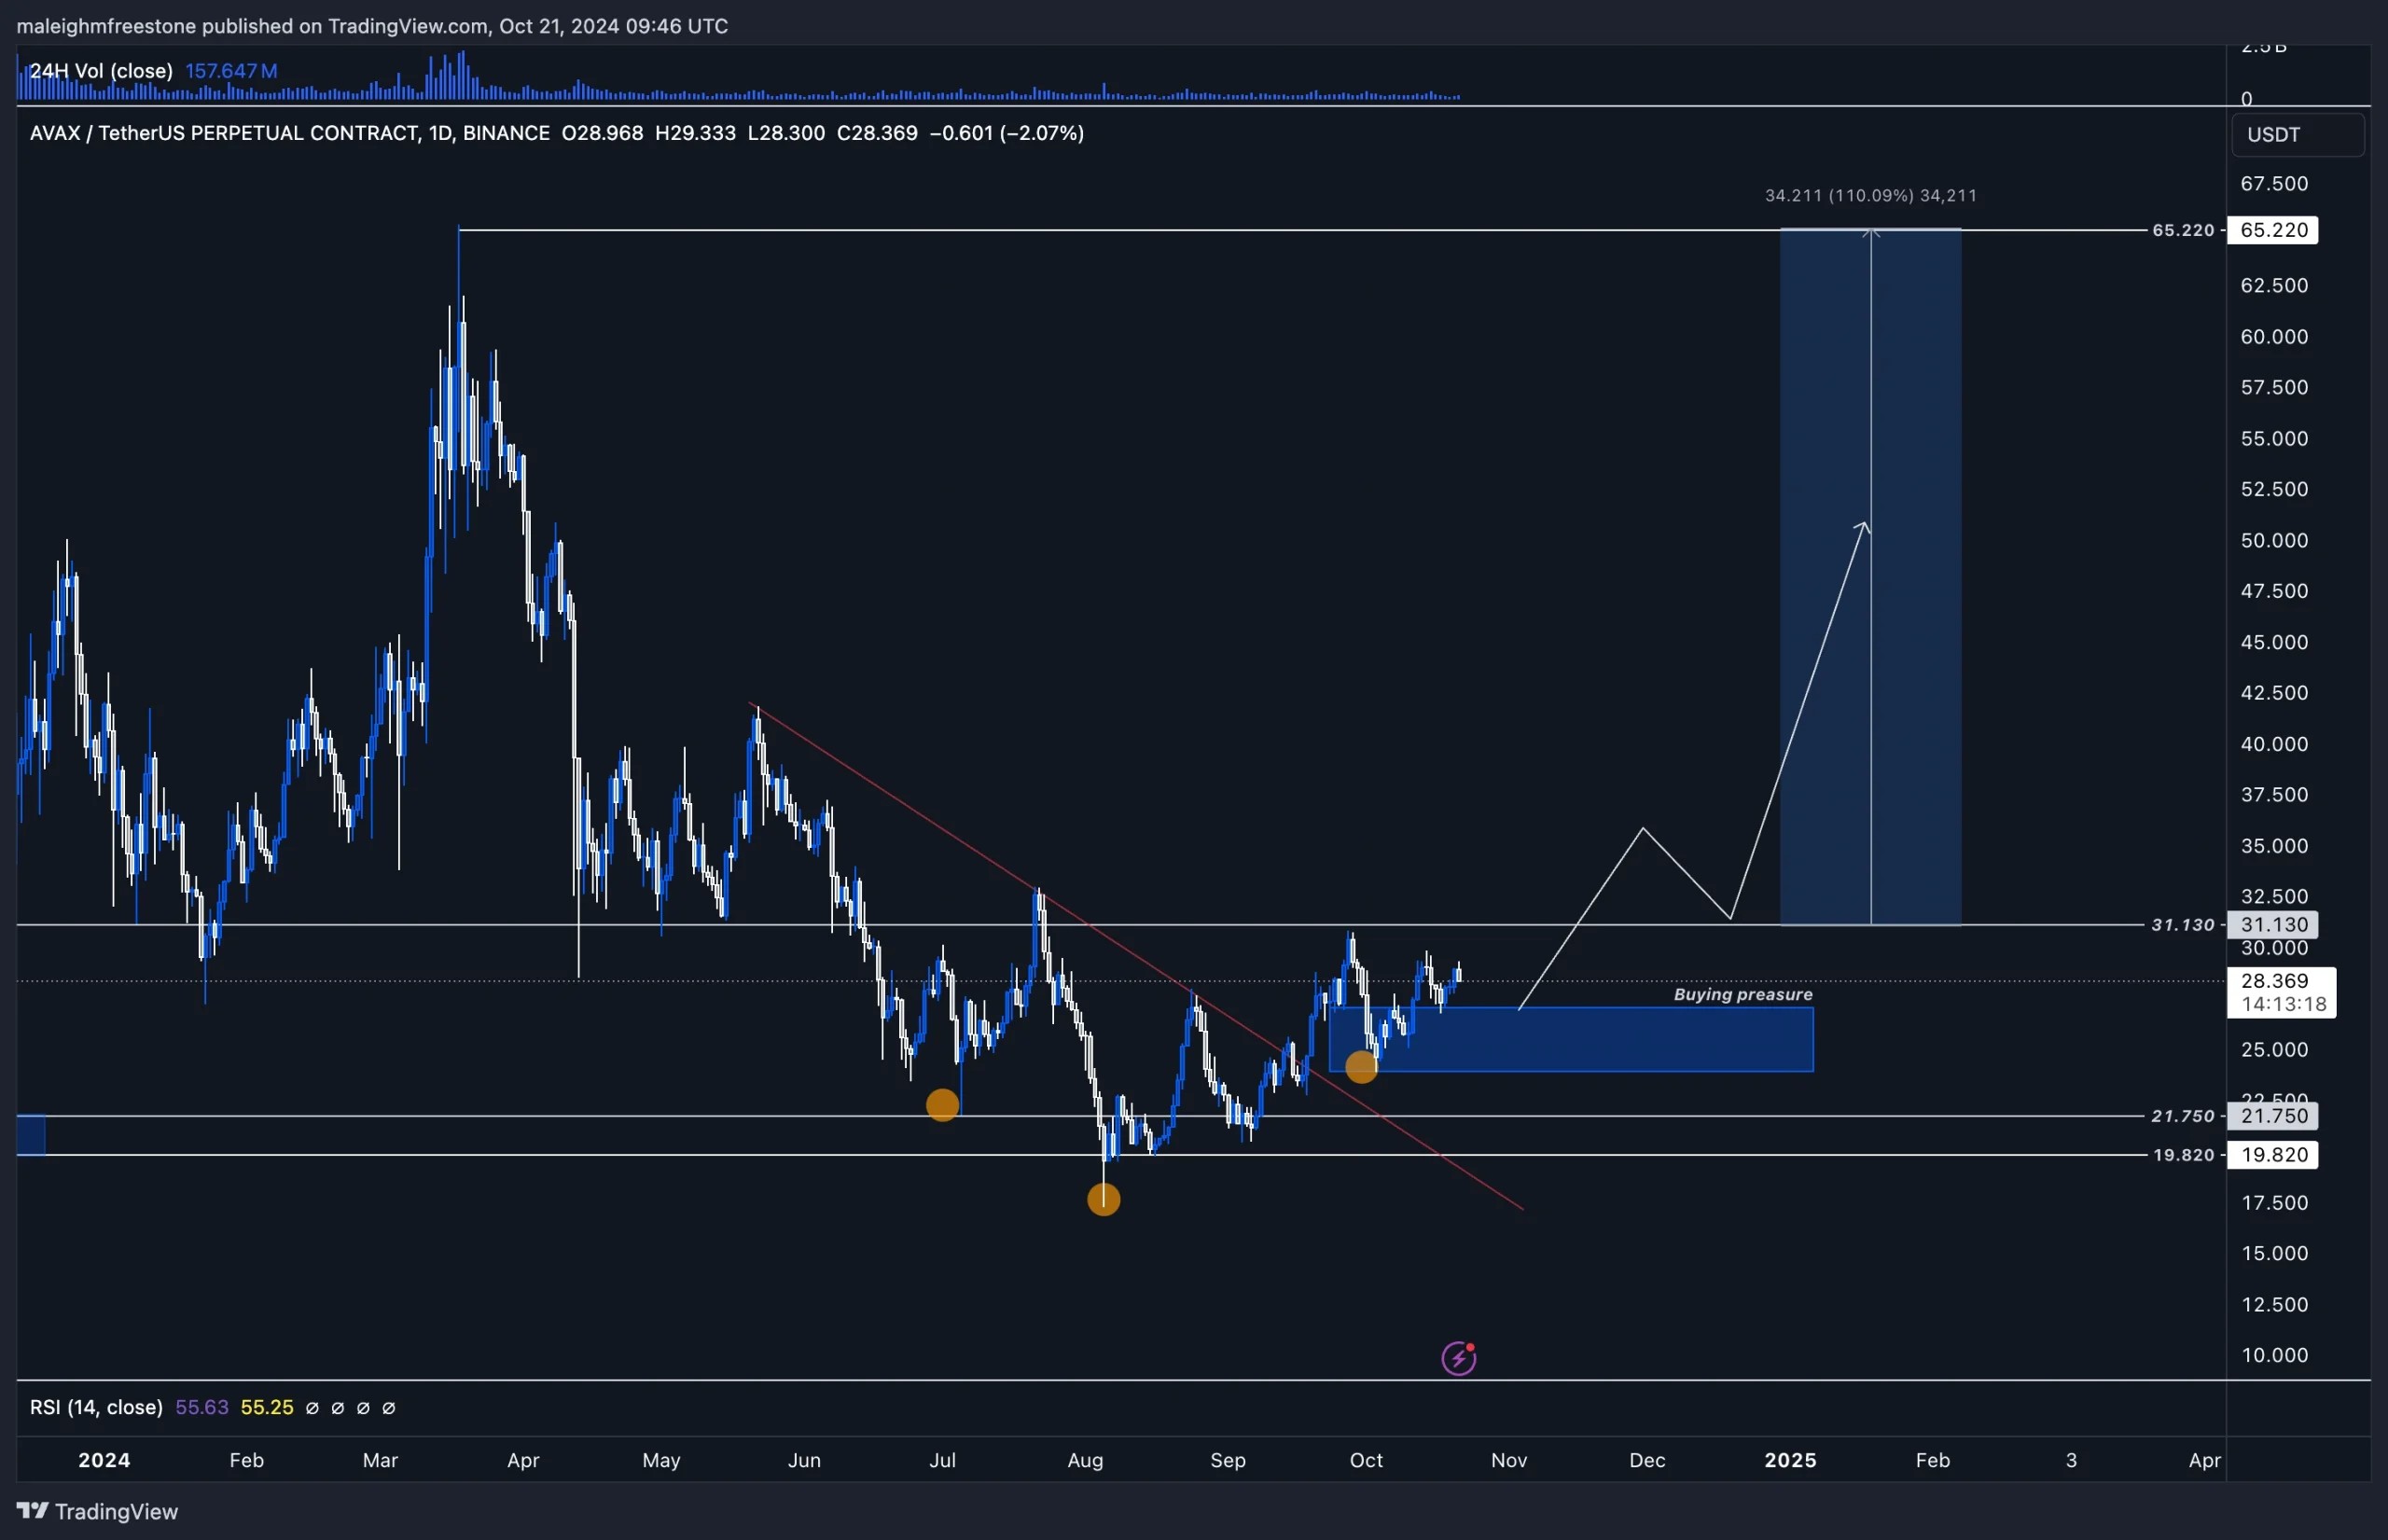
Looking at the chart, we've identified an inverted pattern of head and shoulders. The left shoulder, head, and right shoulder are clearly formed, and what's interesting is that the right shoulder has been bid higher than the left. This tells us that buyers are willing to pay more for AVAX now than they were back in July, which is a good sign.
We traded into the neckline on September 23rd, using it as resistance, which is key. If we break above that $31 neckline, we could see a strong flip in sentiment, signaling a potential for more upside. Historically, around this level, AVAX has shown bullish price action, particularly in April and January.
Attempts to push the price lower were met with immediate buying pressure. If we get back above the $31 level, it could reignite bullish momentum. A move from $31 to $65, the high printed in March, would represent a 100% profit.
Playbook
For holders of AVAX, many of whom are members, bidding around the buying pressure box, as shown on the charts, could be a strong play. The head and shoulders pattern is lining up nicely with the potential break of the $31 neckline, opening up further upside toward $65. Beyond that, a move to $100 is possible if market momentum continues.Key levels
- $31 (neckline resistance)
- $65 (next target for 100% upside)
- $100 (potential higher target if momentum persists)
Cryptonary's take
AVAX isn't an asset we're currently invested in, but it's shown significant strength this cycle and has a large, engaged community. The inverted head and shoulders pattern we're seeing aligns with the broader Total3 market cap's inverted head and shoulders, suggesting that alts, particularly the stronger ones, could be forming a bottom.This also ties into the overall sentiment with the upcoming elections and Trump potentially leading the race, which could serve as a bullish catalyst going forward. If you're an AVAX holder, front-running the potential neckline break around $31 could be a good move in this current environment.
Recommended from Cryptonary


