Save 23% ($351) & Get a Free 1-1 Call with our Team ⏰ : 0d 2h 59m 43s

Tomorrow, we’ll be doing another Market Direction analysis, this time covering more coins. Congratulations to all those who got our Market Update yesterday and managed to jump on WIF between $1.50 and $1.60. Today, you printed—up 23%.
Alongside this, our Spot bags should be up more substantially again now, as well, with the POPCAT price action, so congratulations to all those who had balls of steel and held.
LET'S GOOO!!!!!!
Key questions
- Is Bitcoin's oversold condition setting up for a hidden bullish divergence? Find out why the $59k level could be crucial in the coming weeks.
- With the ETH ETF launch just around the corner, what's the key price range to watch, and how might it impact the broader market?
- SOL's been bleeding, but is a major leverage reset the prelude to something bigger? Discover our DCA strategy and long-term price targets.
- WIF warriors scored a 23% gain, but can the dog coin break its downtrend? Learn about the critical levels that could signal its next big move.
- POPCAT's bounce is giving déjà vu of its previous 400% rally. Is history about to repeat itself, and what's the "send it" moment to watch for?
Disclaimer: This is not financial or investment advice. You are responsible for any capital-related decisions you make, and only you are accountable for the results. "One Glance" by Cryptonary sometimes uses the RR trading tool to help you quickly understand our analysis. These are not signals, and they are not financial advice.
BTC
Bitcoin's funding rate currently sits at 0.01%, which is almost the standard funding rate. There is a relatively even balance between Longs and Shorts, and with a leverage flush-out, a return to 0.01% is usually the outcome.The Open Interest (the amount of leverage put on by traders) had been decreasing since the start of June, from $37.0b to $32.b. Following yesterday's move, it decreased further to $31.6b. This is a leverage flush-out, but it's by no means one of the bigger leverage flush-outs that we've seen.
Technical analysis
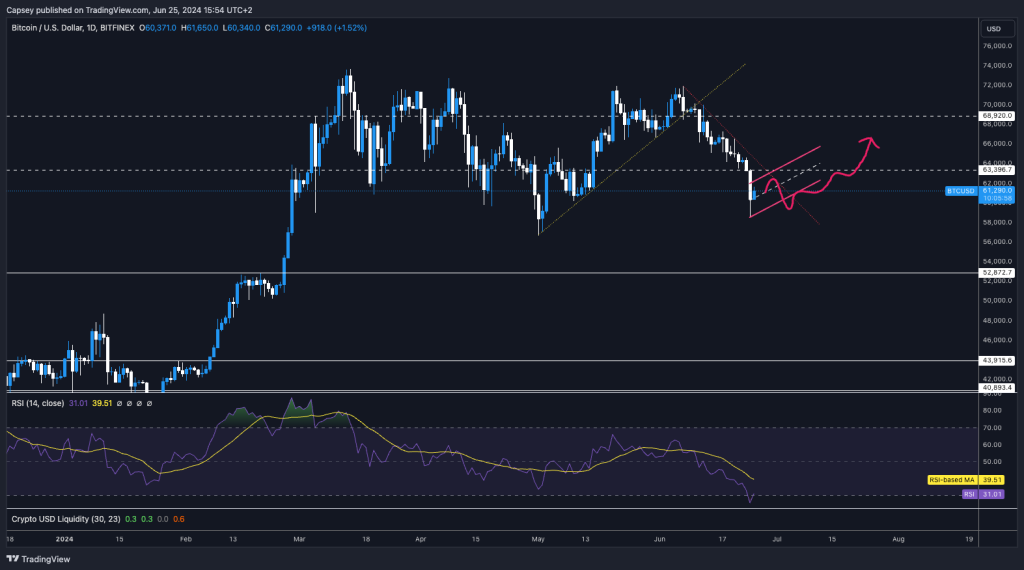
- Bitcoin approached the Yellow Buy Box between $62,500 and $63,500, but unfortunately, it didn't find support in that zone and broke substantially below it upon the news that Mt Gox may have $9b worth of Bitcoin to sell. That actually turned out to be a lot, a lot less.
- Bitcoin also fell below a local support of $60,800, but it was bid up from the $58k area when it fell to that area.
- Bitcoin is currently in a local downtrend, and its price may likely remain suppressed until it breaks out of the local downtrend line (red down-sloping line).
- Bitcoin is oversold on the Daily RSI, which may be enough to support a bounce.
- On the 3D RSI, Bitcoin created a hidden bullish divergence. This occurs when price creates a higher low and the oscillator creates a lower low.
- It's now possible that the horizontal support at $63,400 may now become a new resistance. This may become a tricky level for price to overcome.
Cryptonary's take
Bitcoin is potentially going to remain more volatile in the short term. It's possible that the $59k is retested again, which would potentially also create a bullish divergence on the Daily timeframe, which would be a very bullish indicator overall. But we do respect that Bitcoin is very oversold here, and the most oversold it's been seen was $26k in mid-August 2023.Overall, we remain constructive and expect the market to potentially be range-bound, with a possible retest of $59k. However, we see the general direction as more likely to grind back up to $63,400.
That'll then be a key test, and it may involve creating a bear flag that breaks down sometime in July. We have placed the flag on the chart above to show our general level of thinking.
But if a bear flag does play out, we think if it does then break down, the lows of $58k—$59k will probably hold, and the price may then bounce from there, trend back up to $63k for the second time, and then break out higher past $63k in potentially late July.
We have sketched the general direction on the chart, but this theory is still in its early stages.
ETH
After yesterday's considerable price move lower, ETH's Funding Rate reset to 0.01%, indicating some resetting in overall positioning for ETH yesterday.ETH's Open Interest has declined over the past few weeks from $16.4b to $14.4b. However, yesterday, we didn't actually see a more meaningful decrease in Open Interest (leverage traders being liquidated). This means that the leverage that was flushed out was put back on (mostly) in new trades.
Technical analysis
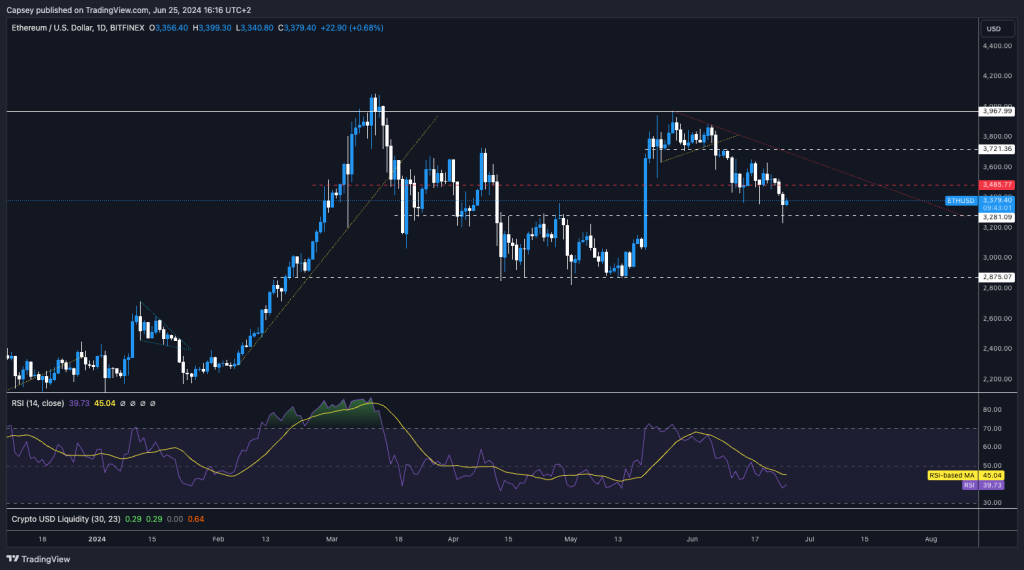
- ETH battled at the $3,485 horizontal support, but the price was unfortunately rejected from this level, with buyers stepping in in the $3,200s.
- We had outlined before that $3,280 may be a good horizontal support for ETH in the short term.
- ETH remains in a downtrend (via the red downtrend line), but there is now significant horizontal resistance above the current price. These are at $3,485 and then $3,720.
- The RSI on the Daily is not in or close to overbought territory, whilst there are also no bullish divergences that have been formed. This is the opposite for Bitcoin.
Cryptonary's take
With the launch of trading of the ETH ETF just over a week away, price is likely to remain in a tighter range due to traders likely being apprehensive ahead of the ETF launch - and then to see how strong or weak the inflows are.The short-term range-bound price action may likely be between $3,280 and $3,485. If the ETH ETF inflows end up being strong, ETH has the potential and ability to lead the next major leg up for the whole market.
However, we don't see this as being too likely for now. When liquidity conditions improve towards the end of summer and if the Fed forward guides Interest Rate cuts, then this will likely be the catalyst that sees ETH ETF inflows increase significantly, and that could be what pushes ETH back to and above $3,720. For now, we'd suggest further patience in the short term, though.
SOL
SOL's Open Interest has come down more substantially from its highs, which is to be expected when SOL has essentially just bled from $180 to $125. Open Interest has decreased from $2.48b to $1.80b in just three weeks. However, a resetting in leverage is positive, and we may now be in a leveraged environment that is supportive of prices going higher.SOL's funding rate has also returned to 0.01%, indicating a resetting with Longs and Shorts, which is now in a relatively even balance.
Technical analysis
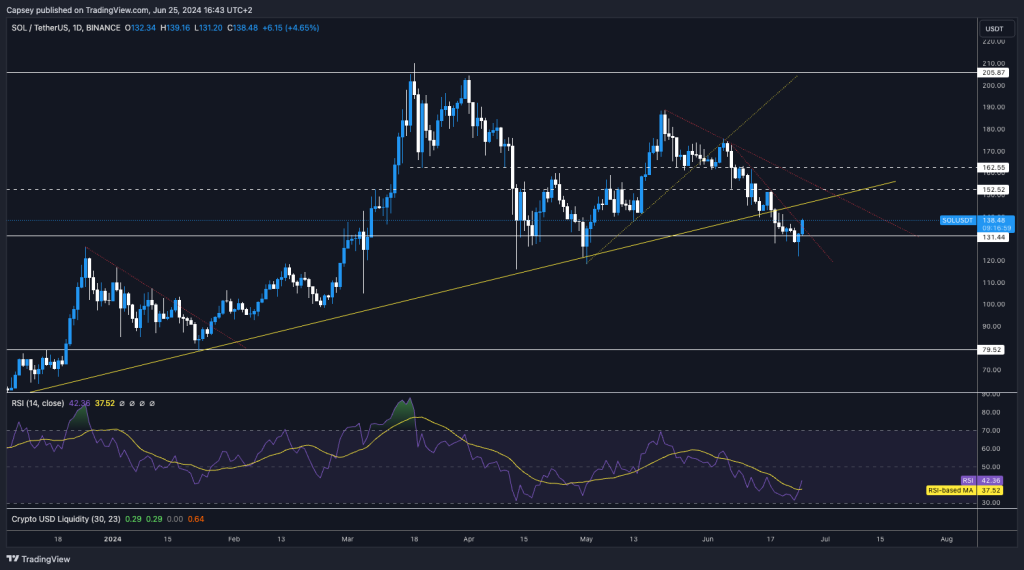
- After SOL declined for two straight weeks, it seems to have finally found some support, with price now looking to bounce from the horizontal support of $131, although price did dip as low as $122.
- Above the current price, there is the local horizontal resistance at $142, which SOL may find to be a short-term resistance area.
- The underside of the main uptrend line (thick yellow line) is in convergence with this. This may also act as resistance to price in the very short term.
- Above $142, there are more major horizontal resistances. Even if SOL can put in a more major bounce in the short term, it may struggle to get back above the two horizontal resistances of $152 and $162.
Cryptonary's take
In the short term, we think it's very possible that SOL can climb slightly higher and retest $142, putting in a slight relief rally. However, until macro catalysts come (Fed easing Interest Rates), SOL may struggle to get enough momentum to get it back above $162 and into more bullish territory.Therefore, in the short term, we expect prices to range between $125 and $152, potentially for a few more weeks. We will be DCAing into any lows (sub $125) if and when we're given them, with a view to selling those Spot bags in six months at substantially higher prices—likely well above SOL's all-time highs.
WIF
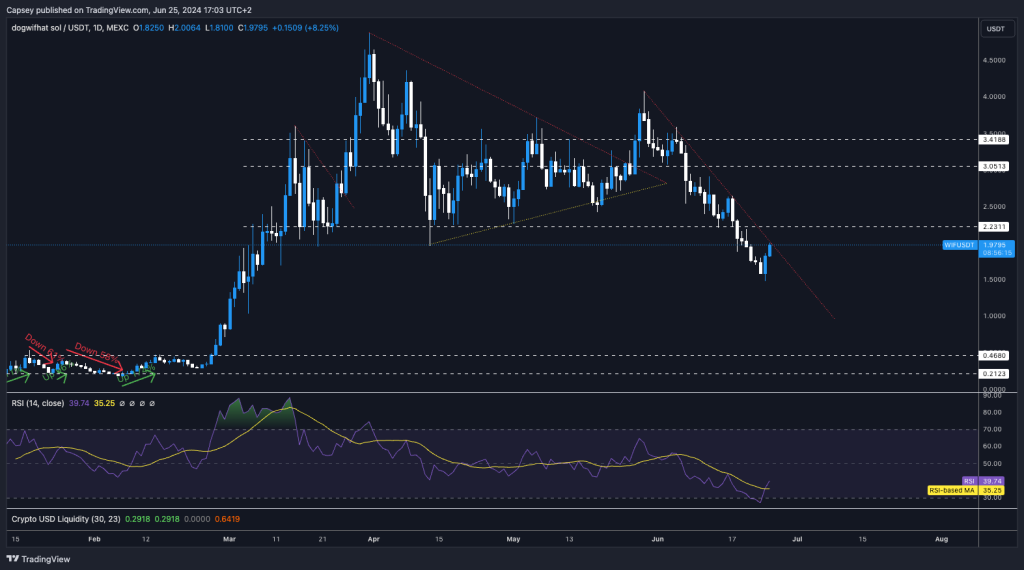
- WIF has been in a downtrend since early June. A price break out of the red downtrend line would likely give WIF more fuel to make a more substantial move higher.
- The $2.20 level was a prior horizontal support, which may now flip into new resistance. This will be a key level for price to get back above and establish itself back into the $2.20 to $3.05 range.
- In the immediate short-term, WIF may retest $1.65 before making a more substantial move up.
- If WIF can break back up into the range (between $2.20 and $3.05), the $3.05 level is the most major horizontal resistance that WIF will need to break above, although we see that level as suppressing prices in the medium term.
Cryptonary's take
We still see WIF as one of the core winners in this cycle's meme space despite its recent underperformance. Over the past 24 hours, we have also seen other memes get a stronger relief rally.
In the short term, we see WIF struggling to surpass $2.20. In the medium term, we see WIF clearing this level, but it may take another 2-6 weeks. Well done to all those who bought WIF between $1.50 and $1.60 with our call in the market direction.
POPCAT
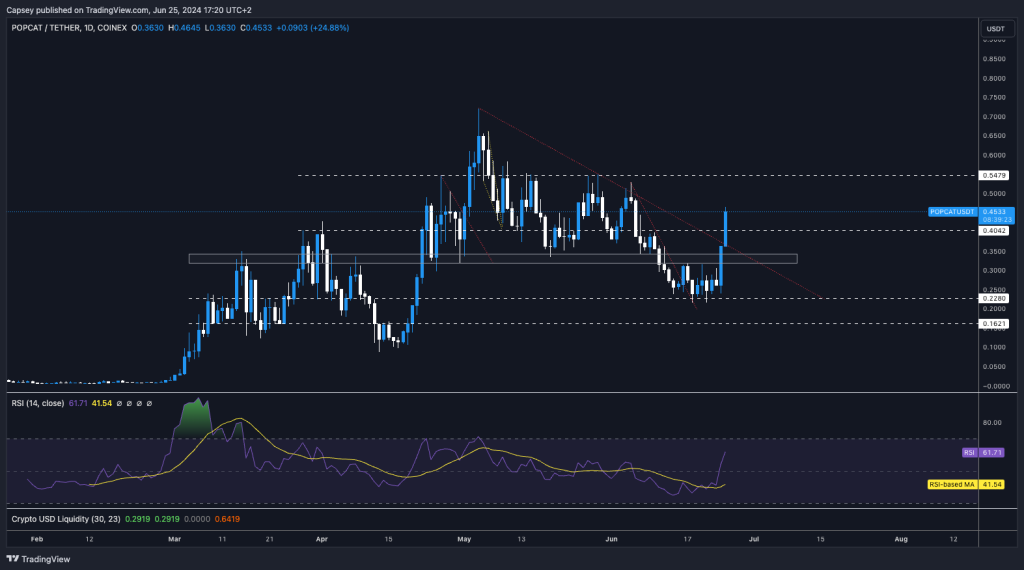
- Now that's a bounce. The current move looks very reminiscent of the move that saw POPCAT break below the horizontal support at $0.16, fall to $0.09, and then explode higher to $0.46 in just 6 days.
- This time, POPCAT has broken below the support zone, that price had bounced from a number of times previously, between $0.32 and $0.34. This sent price down to $0.22, a key horizontal support that price managed to bounce from.
- Price has now broken substantially higher, whilst breaking out of the downtrend line and clearing above the horizontal resistance of $0.40. This is really a strong move here.
- We have become used to POPCAT's playing in the range between $0.34 and $0.55, and it's good to see it back in that range.
- Major horizontal support is $0.34, and major horizontal resistance is $0.55.
- A breakout above $0.55 and POPCAT will likely break substantially higher and surpass all-time highs.
Cryptonary's take
POPCAT and WIF have been our barbell portfolio meme plays, and this relief bounce (so far) from POPCAT. In the short term, it may be possible for POPCAT to consolidate this move and retest a lower level like $0.40 or $0.34.However, based on past experience, we've seen that POPCAT can just run up massively, so you wouldn't want to sell here in the hopes of buying back slightly lower. It wouldn't be worth the risk. POPCAT may have the potential to lead the next leg up like it has done in this bounce over the last 24 hours. WIF hasn't performed as well and at 4.5 times the MCap of POP, market participants may be flocking into other plays that have more room to run higher in terms of MCap.
We're super positive on POPCAT here. A break above $0.55 is the real 'send it' moment. Let's see how we perform here, as we expect some consolidation at some point. Long-term targets for POP are much, much higher—well north of $1. $1 is the first target.
Recommended from Cryptonary


