Save 23% ($351) & Get a Free 1-1 Call with our Team ⏰ : 0d 2h 59m 45s

TLDR
- Bitcoin faces strong resistance at $34,500, with sellers showing up in this zone.
- Technical analysis suggests a potential double top formation, urging caution for new long positions.
- RSI indicators highlight significant overbought conditions, signalling a need for patience.
- We anticipate a pullback and suggest you wait for $31,300 before entering new long positions.
Disclaimer: Not financial or investment advice. You are responsible for any capital-related decisions you make, and only you are accountable for the results. “One Glance” by Cryptonary sometimes uses the RR trading tool to help you quickly understand our analysis. They are not signals, and they are not financial advice.
Technical analysis
Over recent days, BTC has begun to find its next resistance area at the horizontal level of $34,500. Sellers have appeared here, which has helped suppress price. For now, there aren’t too many bearish patterns here other than on smaller timeframes, and we have a double top into the horizontal resistance of $34,500.Ultimately, we need more days’ worth of price action to see what technical patterns form.
However, risk assets have sold off considerably in the past few trading days, yet Bitcoin has moved more like GOLD (a safe haven asset) - so we still need to be mindful that risk assets are currently in a hard environment.
Therefore, our job here is also to closely monitor how Bitcoin trades in terms of its correlation. Does it stay correlated to gold, or does it pivot back to trading like a risk asset?
This could be key for us in the coming weeks/months.
BTC 4hr
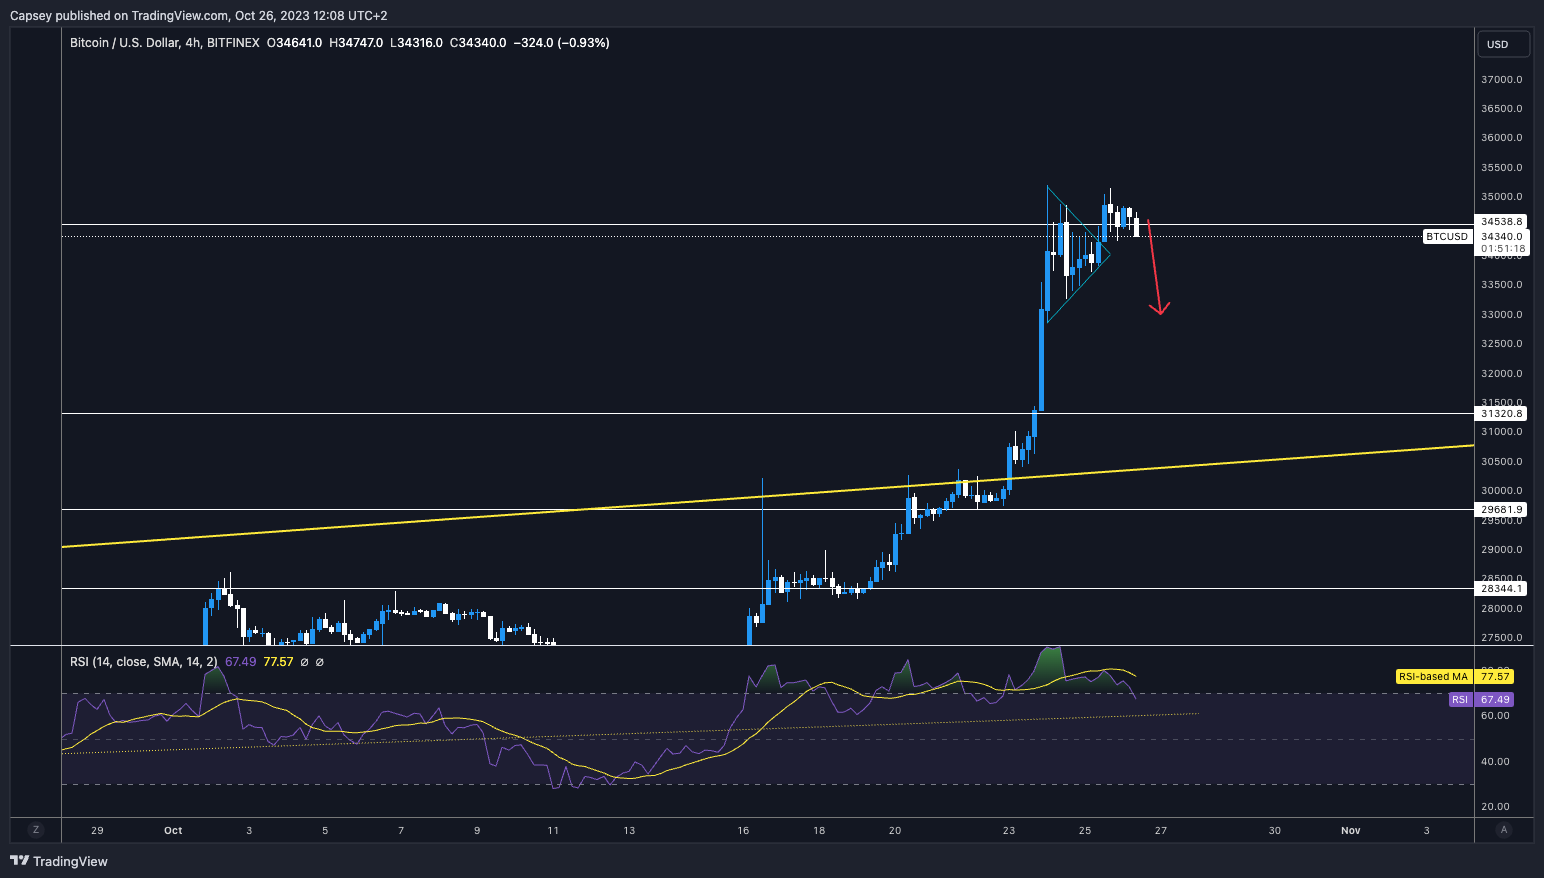
The 4hr chart above shows a bullish pennant which broke to the upside, which we then said would likely form a double top on the 4hr, as we have now got and as we predicted in yesterday's Bitcoin update.
Bitcoin is now back and battling underneath the horizontal resistance of $34,500. The 4hr suggests a more meaningful downside - potentially down to $33,000.
RSI and funding rates
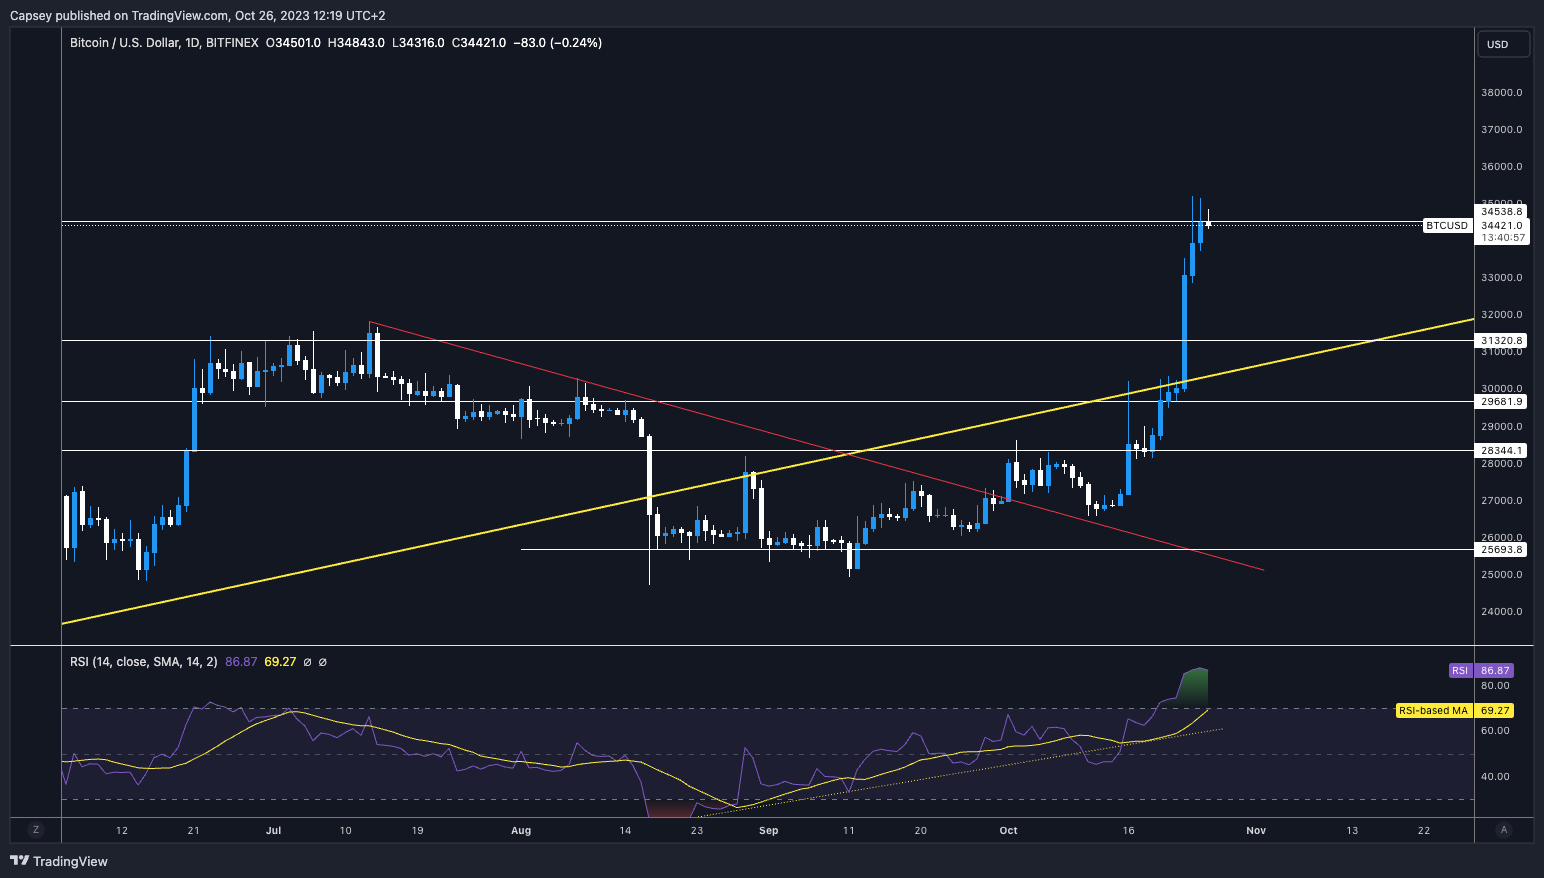
The RSI, what can we say?It still remains phenomenally overbought, particularly on the daily and the 12hr. On the 3D timeframe, Bitcoin is at the most overbought since February 2021. The sentiment in the current market is positive, but if we look solely at these indicators, they suggest that we should be cautious here and not look to add exposure or fresh Longs at the current price.
The funding rates remain positive, and from this perspective, the market is in a healthier spot.
Cryptonary’s take
“Bitcoin remains very overbought and overbought at historical levels. This should suggest some caution here, and unless further positive ETF news comes, we feel it’s likely that BTC should have a price pullback in the short term. The level of interest for a price pullback could be the $31,300 horizontal level that may now act as new support”.The above is yesterday’s conclusion and remains the same today. We’re exercising patience here and letting the price action give us more information. We do expect a pullback for Bitcoin in the near term.
Action
- If price does pullback to $31,300, this may be a good area to begin buying BTC if you’re currently under-allocated.
- We would remain cautious about opening fresh longs at the current price of $34,400, as we expect a pullback in price in the short term.
Recommended from Cryptonary


