Save 23% ($351) & Get a Free 1-1 Call with our Team ⏰ : 0d 2h 59m 43s

From BTC pumping and dumping on fake news to altcoins recording sharp reversals, traders have been on an emotional rollercoaster over the past 24 hours.
The rapid volatility liquidated overleveraged longs and shorts. And now, technicals remain weak overall: bearish divergences are emerging, and funding rates have reset closer to neutral.
But as the dust settles, what key levels should we watch, and where could the best trading opportunities emerge?
Today, we dig into charts in search of the next major move.
TLDR
- Bitcoin is holding support at $28,300; could there be a potential short in the $29,200 - $29,600 range?
- Ethereum is lagging Bitcoin's move – it rejected at $1,660 resistance; should we expect lower prices in the coming months?
- Solana bounced nicely from $21 support, and it’s now approaching resistance where bearish divergence could set up a short.
- Funding rates reset closer to neutral after liquidations, but is there the risk of a bear trap in there somewhere?
Disclaimer: Not financial or investment advice. You are responsible for any capital-related decisions you make, and only you are accountable for the results. “One Glance” by Cryptonary sometimes uses the RR trading tool to help you quickly understand our analysis. They are not signals, and they are not financial advice. Any capital-related decision you make is your responsibility and yours only.
BTC | Bitcoin
Following yesterday’s phenomenal move in price after the fake news of ETF approval, Bitcoin mostly round-tripped. It began the move at $27,700 and finished the move just north of $28,000 despite having gone as high as $30,400.Let’s dive in to see where things currently stand.
Technical analysis
BTC has comfortably recovered the local uptrend (up trending turquoise line) and is now trying to settle above the horizontal resistance (now flipped into support) at $28,300. The next local resistance above us is $29,000 to $29,200. The battle continues at $28,300, which is currently the most key level.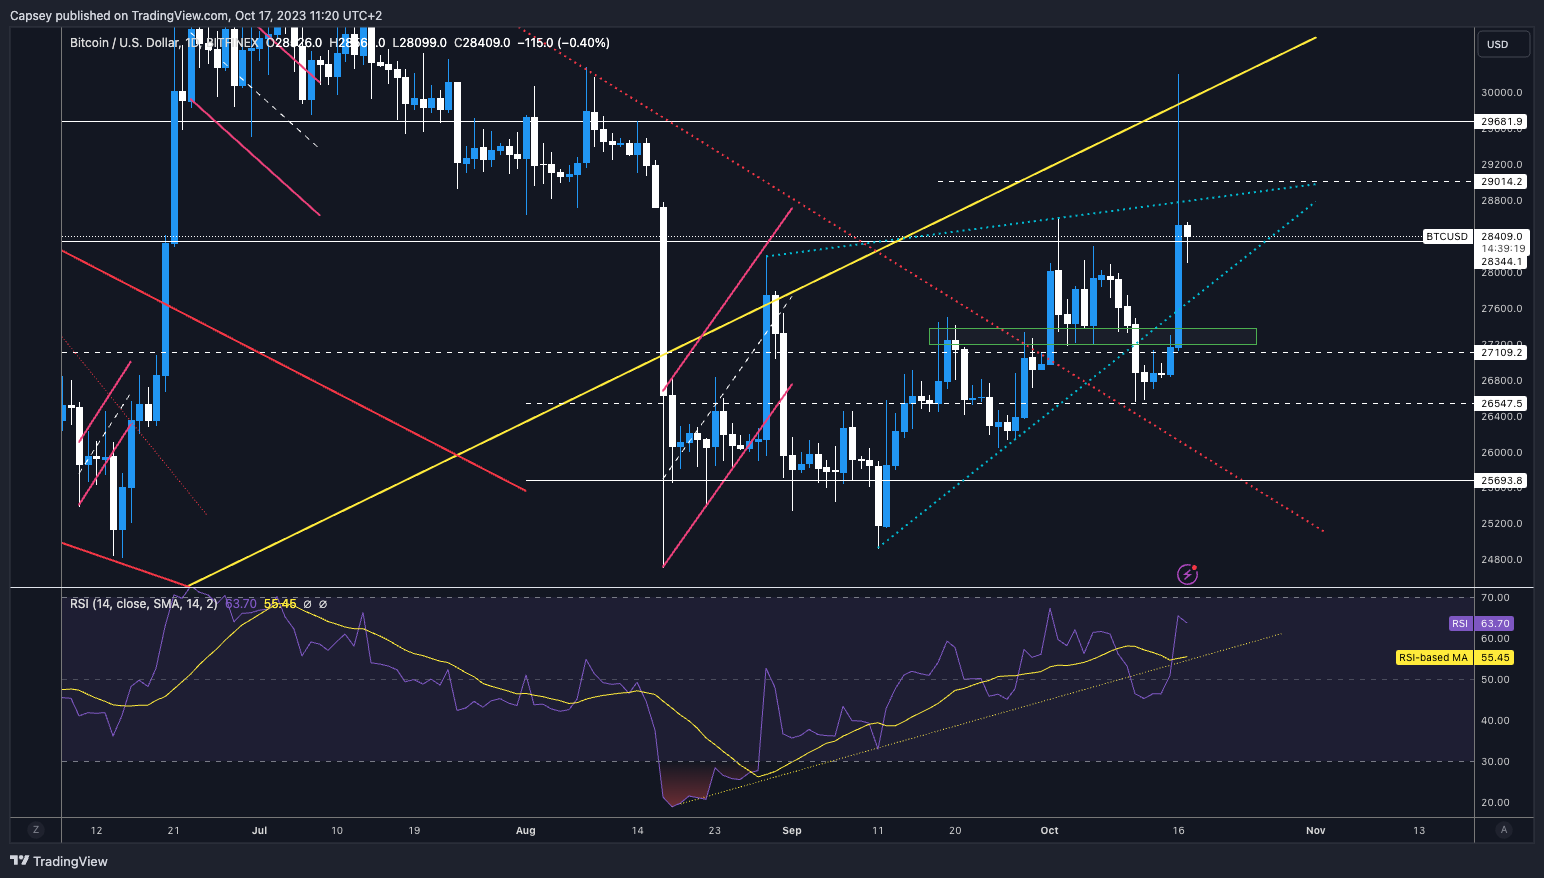
RSI and funding rates
In the aftermath of yesterday’s large move, a lot of shorts were liquidated, and the funding rate moved back to 0.01% – so essentially, just longs and a healthier market. However, we’re already back down to 0.001%, suggesting several shorts are now back in.This is typical bear market whip-sawing of positions due to a lack of conviction among traders. It doesn’t give us too many signals other than that traders have piled back in following yesterday’s move.
The RSI is interesting. We’re not in overbought levels, but we’re not far off either. RSI currently sits at 63, and overbought levels would be 70. But, we do have a bearish divergence here that could suppress further upside.
Conclusion on trading BTC
Yesterday’s move blasted price through all the technical levels. When major news comes out and significantly drives price, technicals go out the window. But, BTC’s price is now at the $28,300 horizontal support and is battling at that level to maintain it as support.Action
- For now, we are not doing anything; we’re waiting to see how the battle at $28,300 unfolds.
- If BTC’s price can move higher, we now focus on the low $29,000 for a potential short. Target area may be $29,200 to $29,600.
- We suggest caution here and not ape’ing into any plays with any meaningful size - altcoins wise. We still feel that BTC will likely come down to sub $24k in the coming quarters. If it does, this is the area where we will begin light DCA’ing.
ETH | Ethereum
A good move higher from the $1,550 horizontal support, but ETH does not look particularly strong here despite the fact it can move up in the short-term as it may be dragged up by BTC.Technical analysis
Of course, yesterday, ETH and the rest of the market were dragged higher by BTC. Still, ETH rejected at the $1,660 horizontal resistance and closed well below the lower resistance of $1,625 and out of the local uptrend (up trending yellow line). If BTC goes higher, ETH can continue to be dragged up, but overall, an ETH rally doesn’t look too positive here as it’s beneath some really key levels.Regarding MA’s/EMA’s, they’re well above us at $1,690 and $1,790, so we don’t need to consider this too much for now. Yesterday, ETH’s price didn’t even reach the first MA at $1,690.
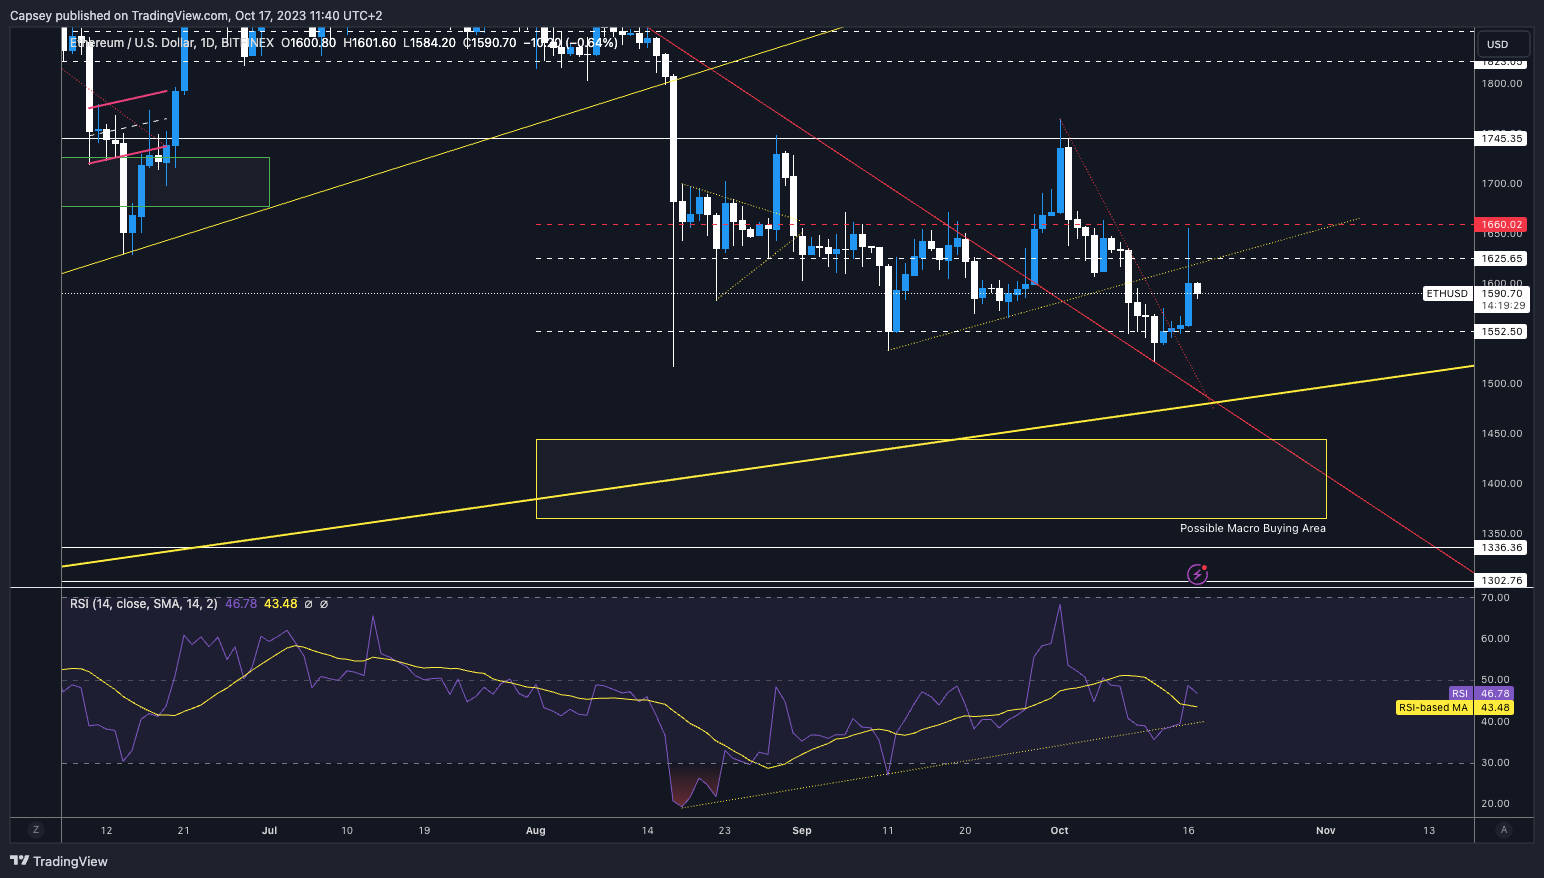
RSI and funding rates
The RSI is back above the RSI-based MA here at 46 (MA is at 43), so there is definitely room for this to go higher; we just don’t see what can be the driver to push price significantly higher. There are no divergences to take note of for now.ETH’s funding rates are more positive than BTC’s and look to be at a healthy level here regarding a mix of positioning. There is not much to take from the funding rates for now.
Conclusion on trading ETH
We’re not confident in ETH currently, despite the fact it may move slightly higher this week if BTC can continue to help drag it higher. But note that BTC is also battling at a current resistance/support level, so if BTC rejects from there, this would likely see ETH turn lower.Action
- Not confident in ETH here, and not looking to do anything here.
- We do think ETH can move slightly higher, potentially testing $1,660 in the coming week or so, but we feel it’ll be rejected from this level.
- In the medium term (next 1-6 months), we expect ETH to go meaningfully lower, at least sub $1,400. Once we get there (assuming we do), we will strongly consider DCA’ing for the long term.
SOL | Solana
Comfortably one of the best performers and the one that is looking like it may provide the next big opportunity for a trade.Technical analysis
SOL bounced really well from the horizontal support of $21.18. Yesterday’s ETF news helped drive SOL to the top border of its broadening wedge, with price moving above that level very nicely.The major horizontal resistance is above us at $25.98, and we have identified a red resistance box that we think ETH’s price may reject – this potentially sets us up for a short trade. SOL has so far held the $21.18 horizontal support, which also has the support convergence from the bottom border of the broadening wedge.
On our last SOL update, we said, “We expect SOL to find some support at this level and at least try to attempt a bounce up to $21.86.” Well, SOL has outperformed this.
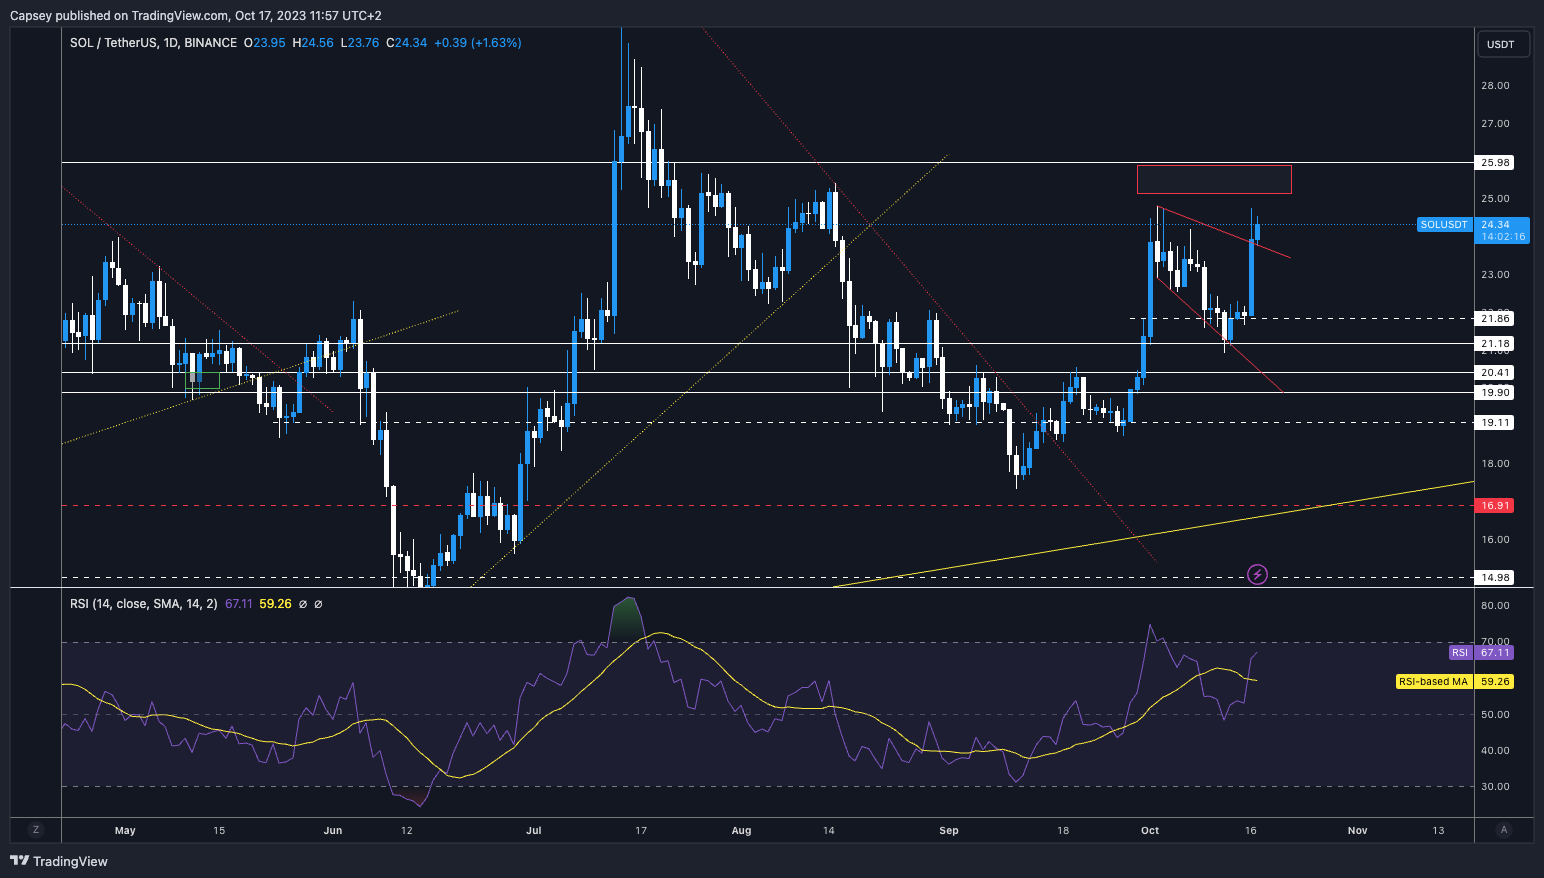
RSI and funding rates
The RSI is key for setting up a trade here. We’re currently at 67 (just below overbought levels of 70), but we’re already putting in a bearish divergence - a higher high in price and a lower high on the oscillator. If this can maintain and also move into overbought territory, then this would entice us to short SOL if it reaches the red resistance box - layering short orders in that zone.The funding rate is the issue. It’s quite negative, so a lot of shorts are in here. We’d like to see the price move meaningfully higher (potentially to our red resistance box), and, in moving higher, will liquidate many of the current shorts. If this happened and the funding rate reset back to more neutral levels, this is what would convince us to enter into a short.
Conclusion on trading SOL
Potentially an exciting trade ahead. However, more needs to be done for all our requirements to be met that would encourage us into a trade.
Action
- A really nice Short could be on the cards here, but we need more to play out and meet our requirements for a trade first. Eagerly watching here.
DOT | Polkadot
We closed out our DOT long trade with good profits.Bear market or not, there are always opportunities to make money; whether the market goes higher or lower, we can profit from both.
Technical analysis
We got the exact move we were expecting: the bounce from the green box for a move back to the horizontal support (now flipped to resistance) at $3.90 to then reject from that level.This move created a bear flag, which now also looks to be breaking down. We see this heading back to the green box area. It still seems really weak, even if we can play and profit from small relief rallies.
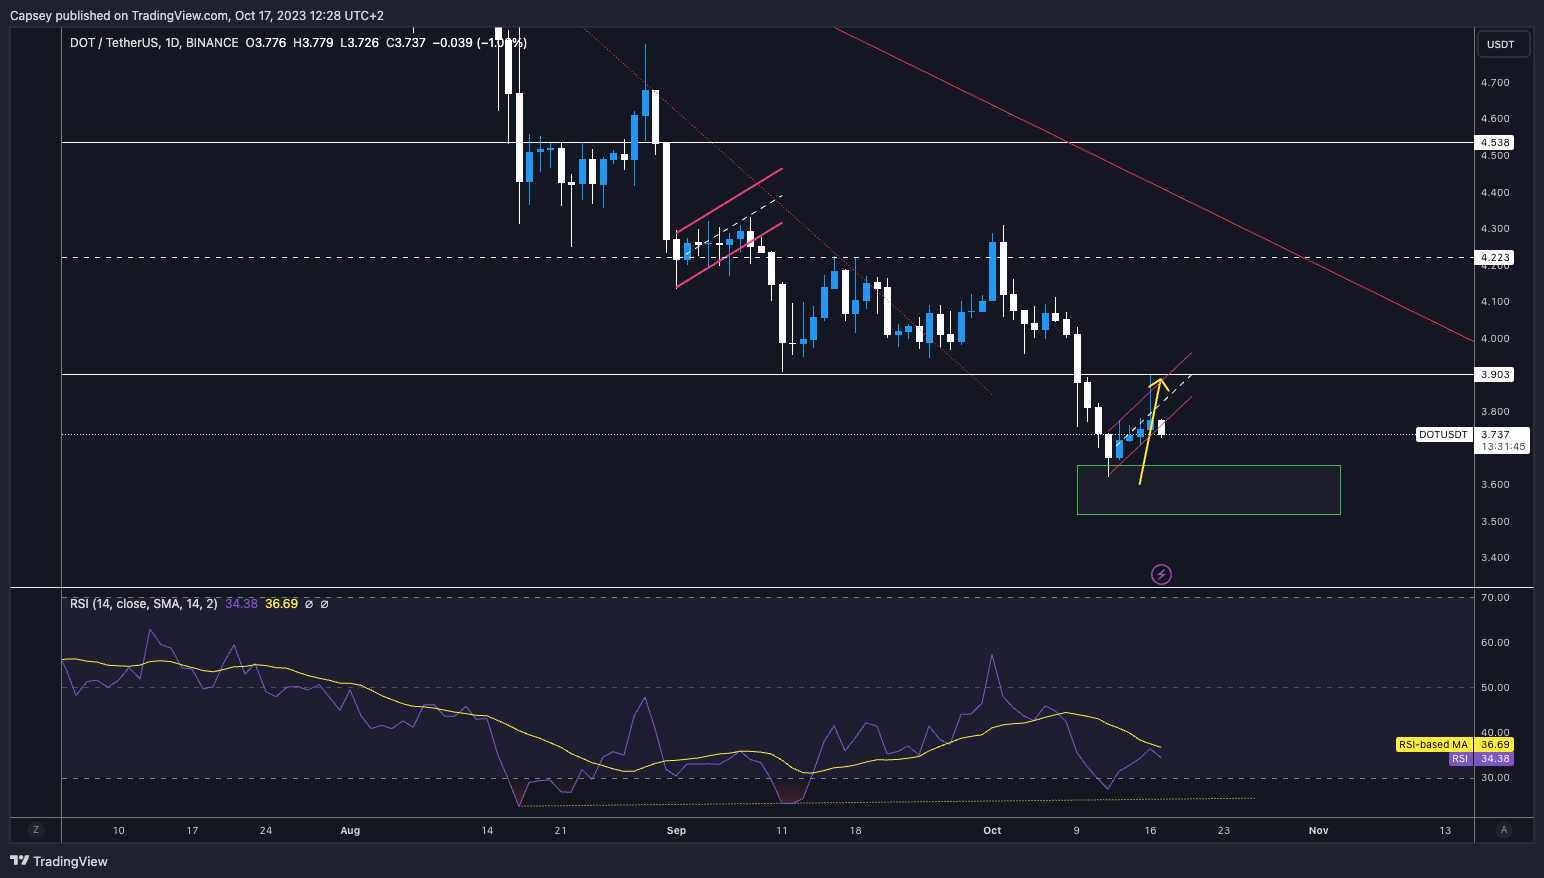
RSI and funding rates
The RSI was oversold, which encouraged us to take the long trade, as it also put in a bullish divergence at this level. If this repeats, i.e., if we get another move into the green box area, which creates a lower low in price but a higher low on the oscillator, then this could provide another long trade opportunity.The funding rate was negative but is now quite mixed despite being negative on some exchanges. This indicates some of the shorts have been wiped out. Let’s track this over the coming days to see if it becomes more weighted to one side again.
Conclusion on trading DOT
Going into the DOT long trade (we took the other side of the market), it was overly bearish. We’ve now closed this trade with fantastic profits yesterday. We’re now out of the trade and looking to see if DOT can give us any further opportunities to trade this week.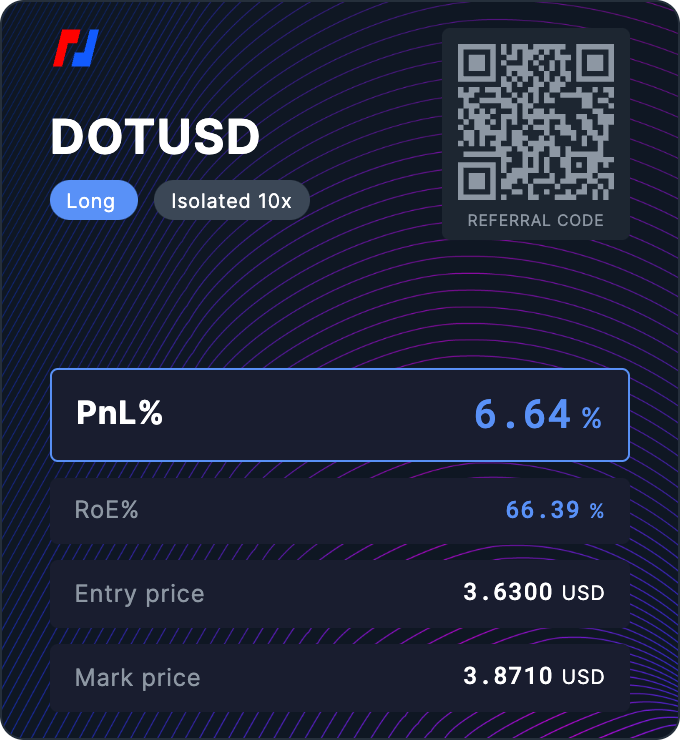
Action
- We’ve closed the DOT long in great profits.
- We’re now waiting to see if we retest the green box and can put in another bullish divergence.
RUNE | THORChain
RUNE struggled to get any meaningful upside when BTC made its move, which probably shows its weakness.Technical Analysis
A decent break below the horizontal support of $1.61 and now looking like it’s potentially heading to the next horizontal support at $1.50.We are not feeling confident about this here. If RUNE can get near to breaking above its downtrend line, this might be the catalyst for some bullish price action, but overall, we’re not confident here.
We did feel RUNE could get a relief bounce to the $1.80 area, but there is just great weakness here, meaning no relief rally. It’ll come at some point, and that may be what helps us to break above the downtrend line.
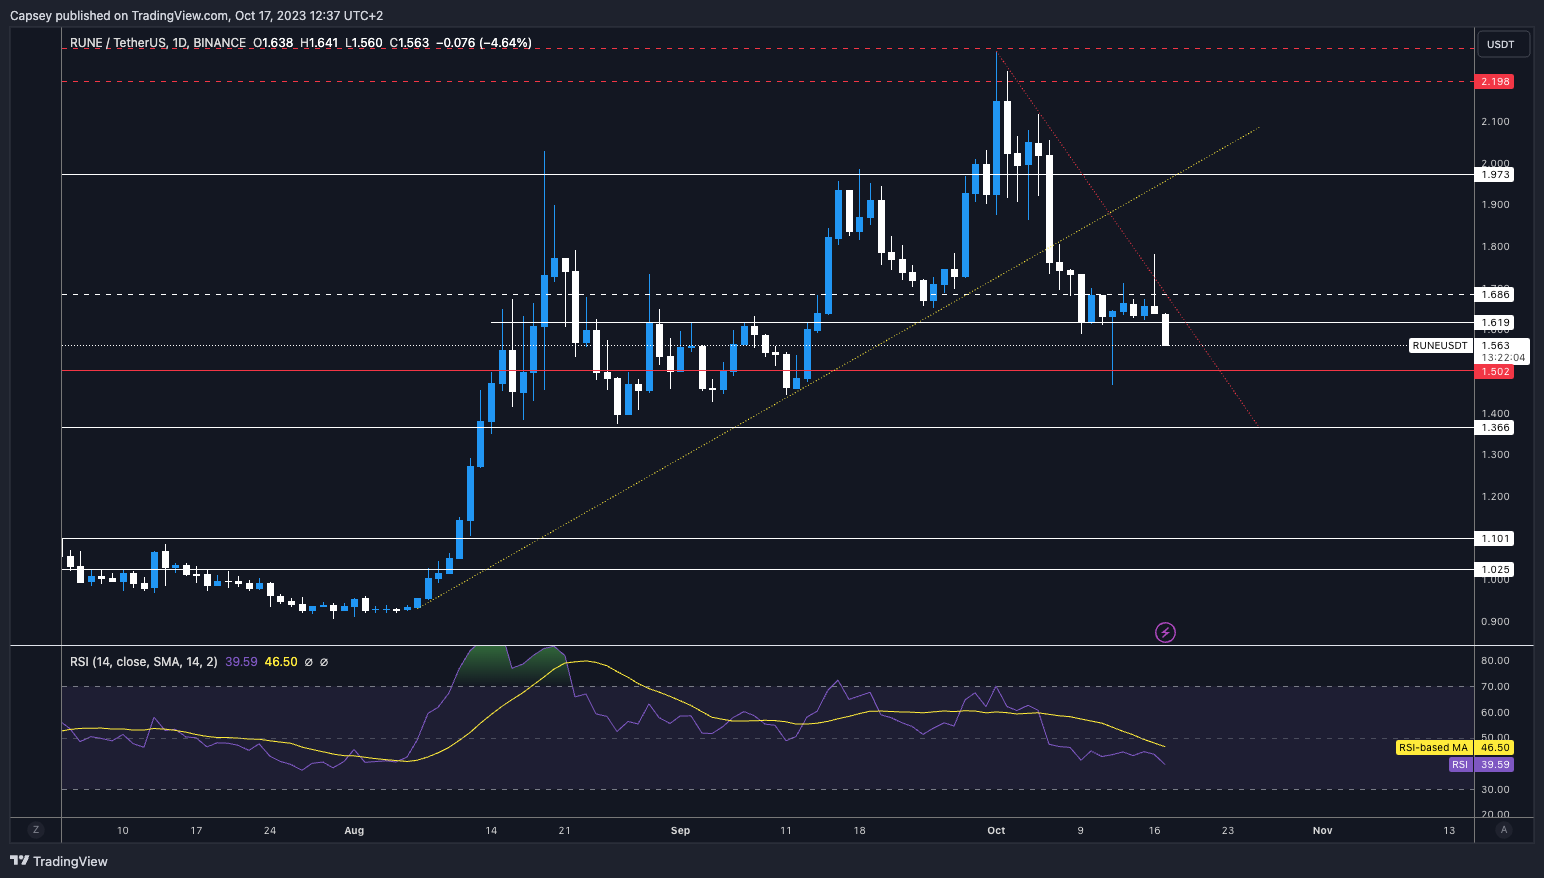
RSI and Funding Rates
The RSI is at 39 and, therefore, could head lower here. There’s room to do so. In terms of divergences, there isn’t anything forming or going off here.Funding rates are relatively negative, so shorts are somewhat ape’ing in here. We don’t want to be on the same side as them even though we think RUNE can continue lower.
Conclusion on trading RUNE
We are steering clear of this, and we believe that RUNE does look ugly and has not moved positively. I.e. It should have had more of a bounce when BTC made its move, yet it couldn’t.Action
- We are doing nothing here. The time to book profits was at $2.00. We expect this to be much lower in the coming months.
Cryptonary’s take
Lower prices are still ahead for Bitcoin and alts. Sub $24k BTC in the coming months would not surprise us. Dips to those levels can offer better long-term buying opportunities.For now, the healthiest approach is waiting patiently for high-probability setups. If Bitcoin can break above $29k, we'll watch for bearish divergences on smaller time frames to short BTC. Solana also looks interesting if its funding rate resets.
Whipsawing markets may persist for a while. But we can profit in both directions with patience, risk management, and calculated moves; we can profit in both directions. Stay plugged into our daily market direction posts and be ready to act when asymmetry tips in our favour.
As always, thanks for reading.
Cryptonary OUT!
Recommended from Cryptonary


