Save 23% ($351) & Get a Free 1-1 Call with our Team ⏰ : 0d 2h 59m 44s
Market Direction

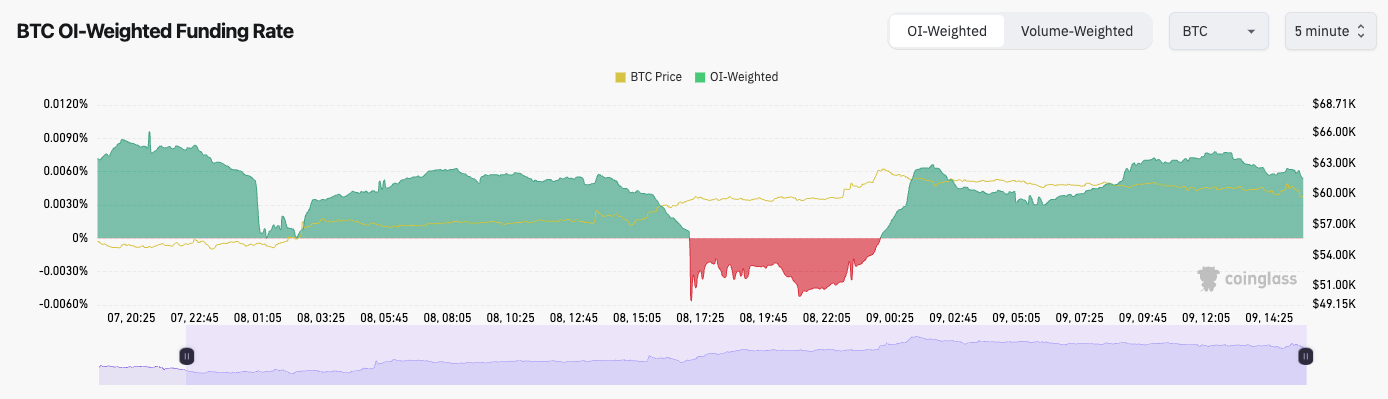
- Bitcoin's Funding Rate is now flat between 0.00% and 0.01%, indicating there is a relatively even balance between Longs and Shorts.
- Open Interest has now reset to healthier levels. The recent flush-out was needed. OI has reset from $37.5b to $28.3b.
- Yesterday, Funding Rates went negative, meaning Shorts piled in as price moved up to $59k. This led to a Short-squeeze which then propelled price from $59k to $62k relatively swiftly.
Technical analysis
- Bitcoin bounced superbly from the horizontal support of $52k, although price had wicked substantially lower.
- Our first thought was that Bitcoin might begin to form a bear flag, however, this hasn't been the case, and we've seen somewhat of a V-shape recovery so far.
- We also expected the $58k to $60k level to become new resistance, however, the Short-squeeze pushed price beyond this price zone.
- For now, the prior horizontal support of $63,400 is likely act as the next major horizontal resistance.
- To the downside, we believe $56k can be a support area, even if price does dip slightly below this area.
- The RSI has reset back to neutral territory having been in oversold territory on Monday.
Disclaimer: This is not financial or investment advice. You are responsible for any capital-related decisions you make, and only you are accountable for the results.
Cryptonary's take
Whilst we're impressed by how much Bitcoin has recovered so far, we do expect a slight pullback here, and for price to potentially retest the $54k to $56k area over the coming 2-4 days. We believe Bitcoin can be more range bound and we're not expecting any explosive moves past say $63,400 in the near-term, at least not until Powell speaks at Jackson Hole in a few weeks time (Aug 22nd - 24th).
Recommended from Cryptonary


PRO
Market Direction
13 min read
Mar 17, 2026
PRO
Market Direction
12 min read
Mar 13, 2026

PRO
Market Direction
13 min read
Mar 10, 2026
