Save 23% ($351) & Get a Free 1-1 Call with our Team ⏰ : 0d 2h 59m 44s
Market Direction
Bitcoin, ETH, SOL face key resistance levels
Our trading floor has been actively monitoring the cryptocurrency market movements with precision and insight. In this report, we break down the technical and fundamental conditions of key assets, including Bitcoin, Ethereum, Solana, and Hyperliquid. Let's dive in.

Disclaimer: This is not financial or investment advice. You are responsible for any capital-related decisions you make, and only you are accountable for the results.
BTC
Market metrics:- BTC's Open Interest is up substantially over the last 3-4 days, indicating that this move up has been somewhat driven by leverage.
- BTC's Funding Rate has stayed relatively tight around the 0.00% level, and it has been fluctuating between slightly positive and slightly negative. This just indicates that traders are flip-flopping between Longs and Shorts without much conviction which is normal during choppy market periods.
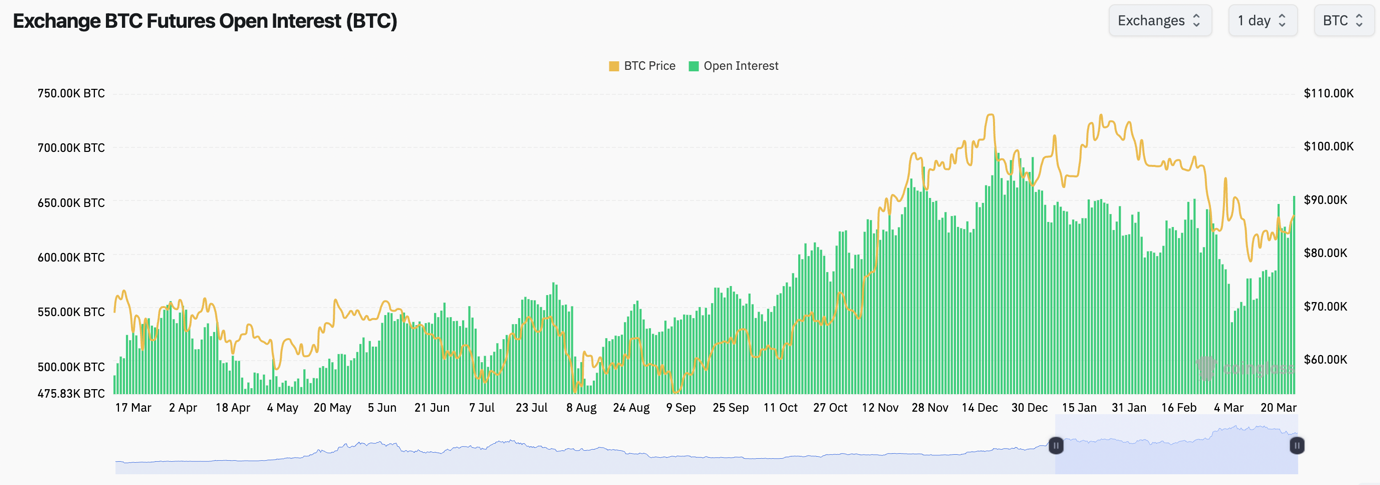 Bitcoin Open Interest has increased significantly, indicating a leverage-driven movement
Technical analysis
- After putting in two back-to-back bullish divergences, BTC has begun moving higher along with the stock indices as we expected it would.
- We have the local horizontal resistance at $87,000 (up from $86,300, $87,000 seems like the more clear level). We'll now be seeing if BTC can break out above it.
- The main horizontal resistance is at $91,700. We don't expect that level to be breached in the short term.
- To the downside, the local support is in the $82k's, with the major horizontal support at $78,700.
- BTC is potentially breaking out of it's RSI downtrend, which is positive. However, the price will put in a hidden bearish divergence (lower high in price, higher high on the oscillator).
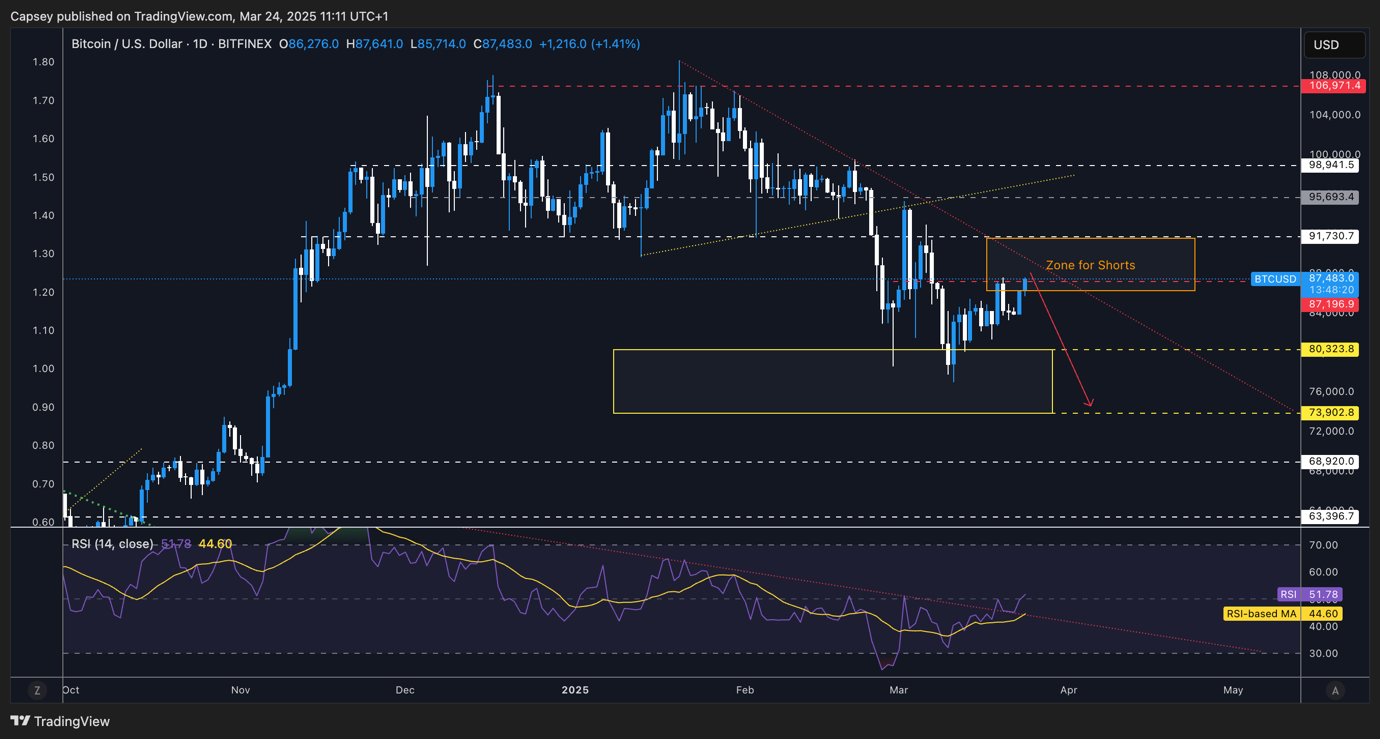 Bitcoin technical analysis showing projected movement into the $88-89K region BTC 1D Timeframe - Key Levels:
- Next Support: $85,200
- Next Resistance: $91,700
- Direction: Neutral/Bullish
- Upside Target: $90,000
- Downside Target: $82,000
Cryptonary's take
BTC is moving up here in what we still expect is a relief rally for Bitcoin and other risk assets. As planned, BTC is moving into our Short box between $86,300 and $91,700, which is where we're looking for Shorts. So, we'll essentially be filling Short orders all the way up, and as price goes higher into say $88k, $89k, $90k, then we'll be adding more size to the Short. What would invalidate our thesis would be a clear break of two key levels: $91,700 and $95,500. $95,500, and we'd really have to consider that we're wrong and, therefore, why we're wrong. But for now, in the short-term, we do see price grinding up into the $88k, to $89k region, but we do expect this to just be a relief rally and for the market to then go lower.ETH
Market metrics:- Interestingly, ETH's Open Interest has hit new highs (by number of coins). This indicates that there's still demand to take the 'cash and carry' trade - Buy Spot ETH, Short ETH Futures.
- ETH's Funding Rate, like Bitcoin's, has mostly just fluctuated around the 0.00% mark, indicating that traders are generally flip-flopping on their positioning, which indicates that overall conviction isn't high.
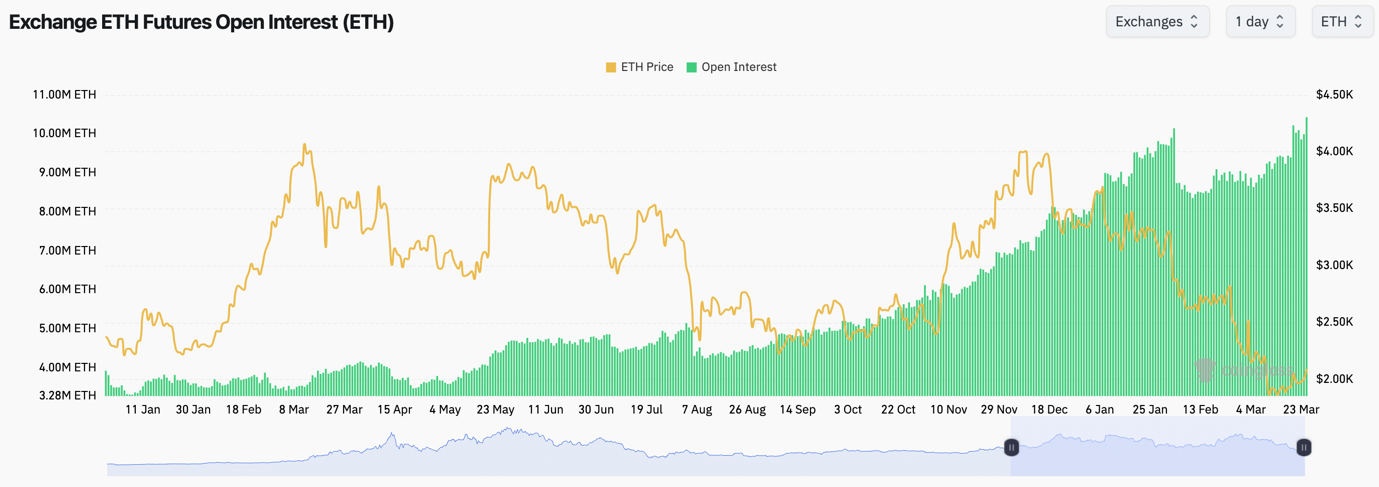 Ethereum Open Interest reaching new highs, indicating continued demand for cash and carry trades
Technical analysis
- ETH has broken out of its pennant pattern. We thought we might get a breakdown, one more touch of $1,745 before a move higher. But that hasn't happened, and ETH has just moved higher. Positive.
- ETH is now pushing higher but it still remains underneath the local horizontal resistance of $2,160. This'll be a key level for ETH, and it's response at that level will be important information for us.
- Beyond $2,160, the main horizontal resistance is at $2,420.
- ETH has really nicely broken out of it's main RSI downtrend line, which is good to see, however, hidden bearish divergences have been put in, meaning a rally can be weak.
- To the downside, the main horizontal support remains at $1,745.
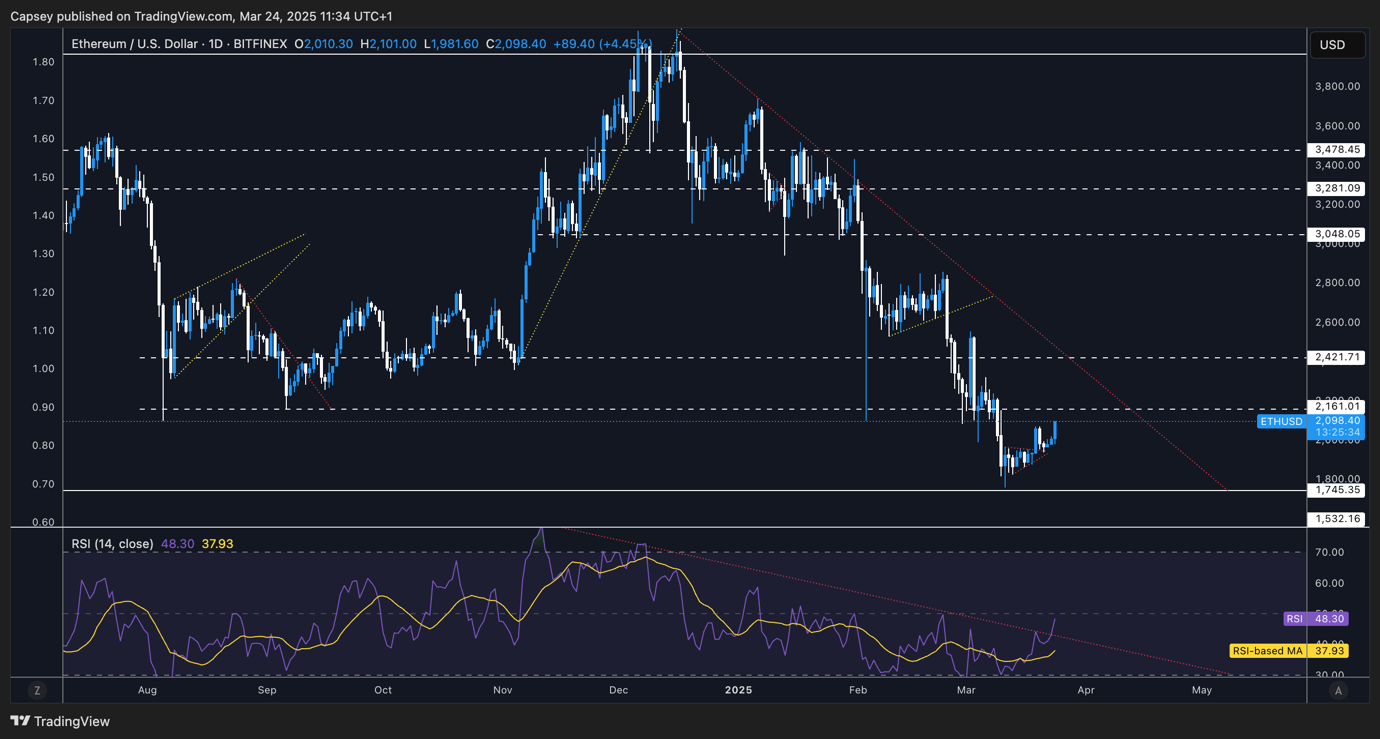 Ethereum technical analysis highlighting the pennant pattern breakout and key resistance at $2,160 ETH 1D Timeframe - Key Levels:
- Next Support: $1,860
- Next Resistance: $2,160
- Direction: Neutral
- Upside Target: $2,160
- Downside Target: $1,745
Cryptonary's take
ETH is rallying off of the local bottom after a really poor 3 months, which was essentially straight down and saw ETH half in that time. ETH is now putting in a small relief rally, but unfortunately, for now, and in the short term, that's all we expect it to be. $2,160 is the local resistance, and we'd expect the price not to break above it, but if it were to, then we'd be confident that $2,420 would be too strong of a resistance for ETH. Ultimately, we're not moving off the back of this, and we're more keenly watching $2,160 as a key level to test, and we'll be taking a lot from ETH's behaviour/response at that level (assuming the price gets there to retest).SOL
Market metrics:- SOL's Open Interest has also hit new OI highs (by number of coins), showing us that there is still the appetite to leverage trade. However, note SOL is half the price of where it was a few months ago, hence less $ is needed to leverage 1 SOL.
- SOL's Funding Rate is mostly positive but it is still relatively contained, indicating that there isn't this huge appetite to rush into Longs.
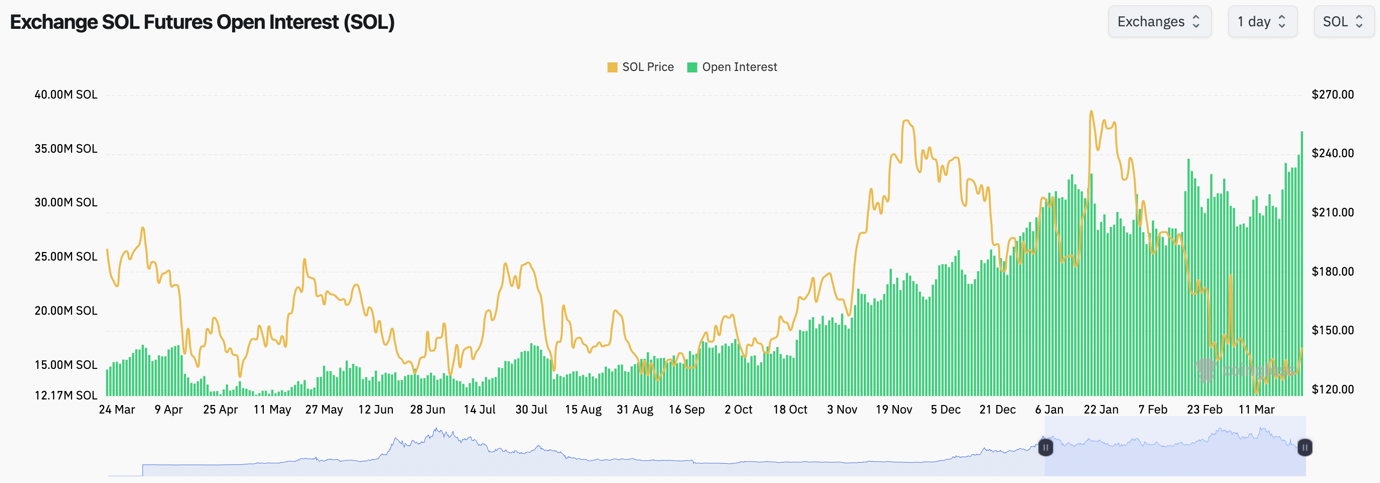 Solana Open Interest hitting new highs, though with lower dollar value due to price decline
Technical analysis
- SOL has found support and bounced from the main horizontal support level at $120.
- Price is now breaking above the local horizontal resistance of $136, with the next major horizontal level being at $162. We don't expect price to clear above $162, and we're not confident if it'll get there.
- The RSI has cleared above it's moving average, however it is now very close to putting in a hidden bearish divergence (lower high in price, higher high in the oscillator).
- The major horizontal supports remain at $120 and if that is broken to the downside, then $98.
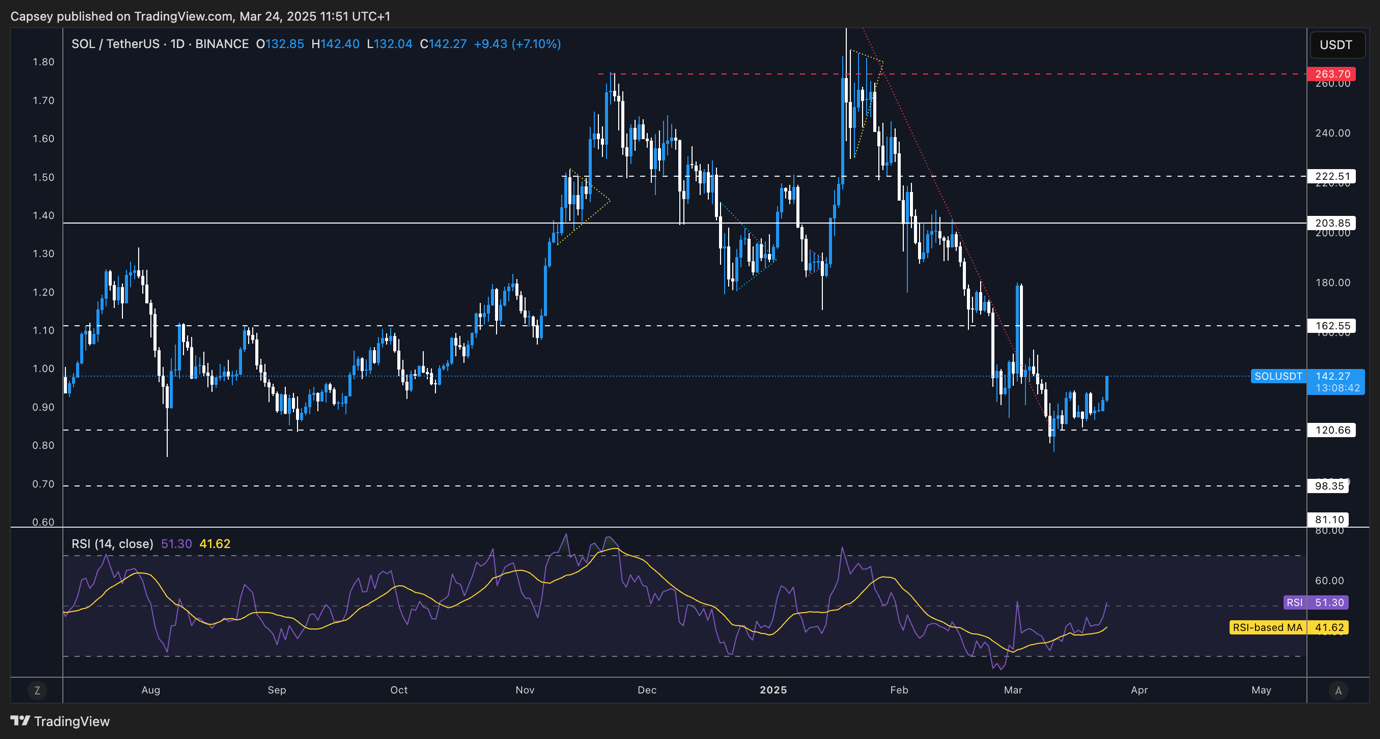 Solana technical analysis showing support bounce at $120 and next resistance at $162 SOL 1D Timeframe - Key Levels:
- Next Support: $136
- Next Resistance: $162
- Direction: Neutral/Bullish
- Upside Target: $162
- Downside Target: $120
Cryptonary's take
It's good to see that SOL is showing signs of life again here, even with some of the SOL memecoins putting in nice relief rallies. These rallies have put in multiples, but we do expect them to just be relief rallies and for the memes to not get close to their all-time highs that we saw in 2024. For SOL, we would be surprised to see it run into the $150's, however, we're not confident enough to bet on it, as we see this relief rally being just that, and it being driven by the fact that coins were so oversold originally. In terms of Shorts, we wouldn't look to Short SOL into the $150's to $160's (even if it can get there), simply because we see better opportunities to Short in Bitcoin and a select group of Alts.HYPE
Technical analysis:- A really nice move by HYPE here.
- For us, the key level for HYPE to clear above was the $15.50 horizontal resistance, assuming $14.50 could be overturned, which it was.
- Now, the main key horizontal resistance in front of the price is the major level of $18.50. This will be a huge testing area for HYPE, and it'll be a key gauge for us in terms of appetite if these key horizontal resistances ($18.50 for HYPE, $2,160 for ETH, etc) can be flipped.
- In terms of downside, we'd be looking at the $14.50 to $15.50 zone as being a zone of support. We'd like to see that area hold on to any moves lower.
- The RSI has pushed up substantially from oversold levels with it now back into the 50's at middle territory. This is positive, especially as there aren't any hidden bearish divergences for now.
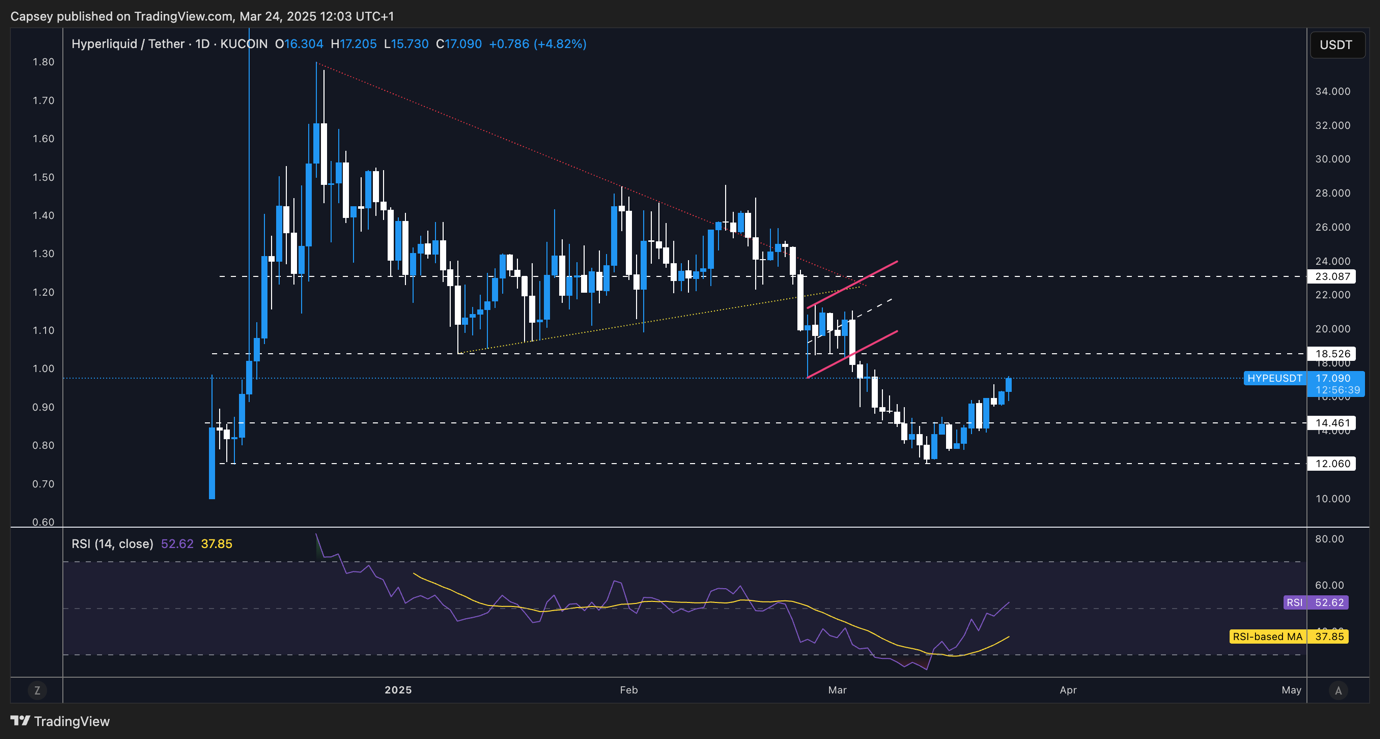 Hyperliquid breaking out of the $14.50-$15.50 zone with $18.50 as the next key resistance HYPE 1D Timeframe - Key Levels:
- Next Support: $14.50
- Next Resistance: $18.50
- Direction: Neutral
- Upside Target: $18.50
- Downside Target: $14.50
Cryptonary's take
Overall, it was a really nice move higher by HYPE, breaking out of the $14.50 to $15.50 zone. The key level now for HYPE is the horizontal level of $18.50. This will be a great gauge for us. If $18.50 can be surpassed, then we'd have to consider turning more bullish, as it's a key level to flip. However, we don't expect it to be flipped. But let's see over the coming week. For now, we remain patient and we're not looking to partake in any moves for HYPE. However, if price does go substantially higher, we may look for Shorts.Recommended from Cryptonary


PRO
Market Direction
13 min read
Mar 17, 2026
PRO
Market Direction
12 min read
Mar 13, 2026

PRO
Market Direction
13 min read
Mar 10, 2026
