Save 23% ($351) & Get a Free 1-1 Call with our Team ⏰ : 0d 2h 59m 44s

Well, that’s unknown - but it surely looks like it!
Following bearish events from earlier this week, the market pulled an unexpected move. Buyers came to Bitcoin’s rescue, and they've managed to save BTC's fate in the short term, and maybe they've changed it - time will tell.
With newly-found optimism coursing through our veins, we have reevaluated the market’s general direction, and today, we share three interesting opportunities with you! SPOILER: We included a winning formula for taking advantage of each opportunity. 🤫
TLDR 📃
- We found a few short-term and mid-term plays that you cannot ignore. To make your life easier, we’re sharing clear strategies for each!
- RUNE broke out from a price pattern. We await confirmation and expect a higher move to the upside once we have it.
- Bitcoin’s dominance is rising. We dive into the details and what that means for your portfolio.
- Bitcoin’s recent performance saved the day. Its price managed to bounce from support, and the chances of upside continuation have increased. Don’t get too excited - there’s a catch.
Disclaimer: Not financial or investment advice. You are responsible for any capital-related decisions you make, and only you are accountable for the results. “One Glance” by Cryptonary sometimes uses the R:R trading tool to help you quickly understand our analysis. They are not signals, and they are not financial advice. Any capital-related decision you make is your responsibility and yours only.
What comes after the thunder…? Lightning ⚡
Our beloved lightning token broke out from a symmetrical triangle yesterday. Don’t know what one of those looks like - peep this 👇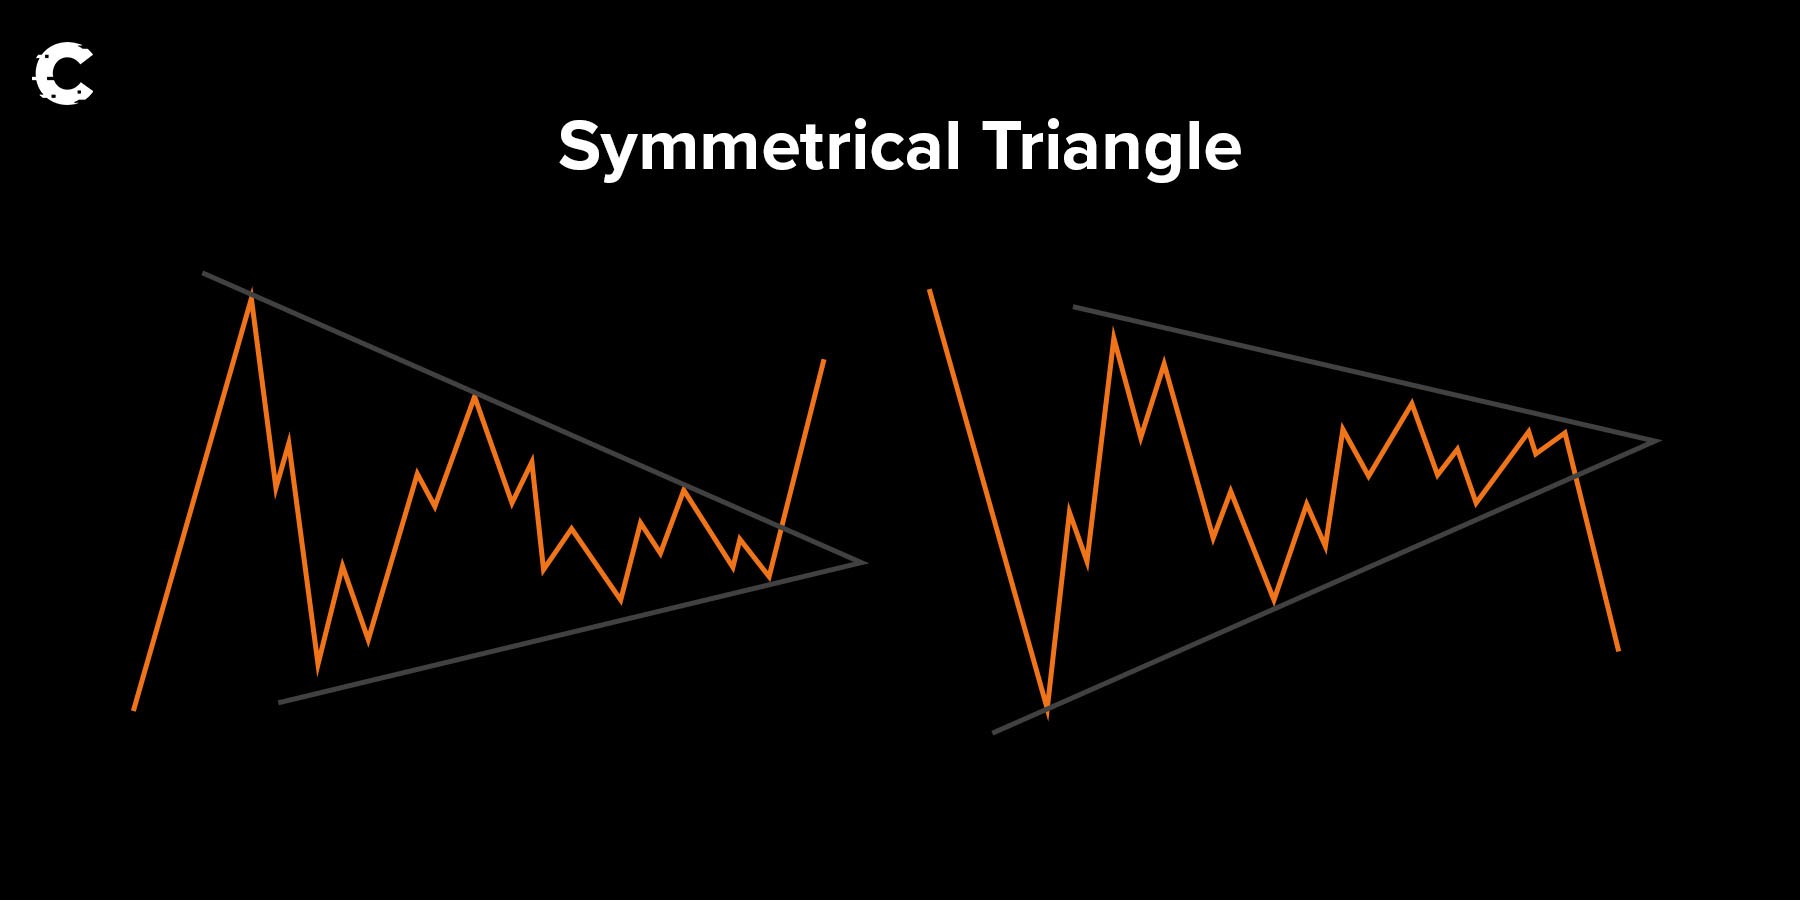
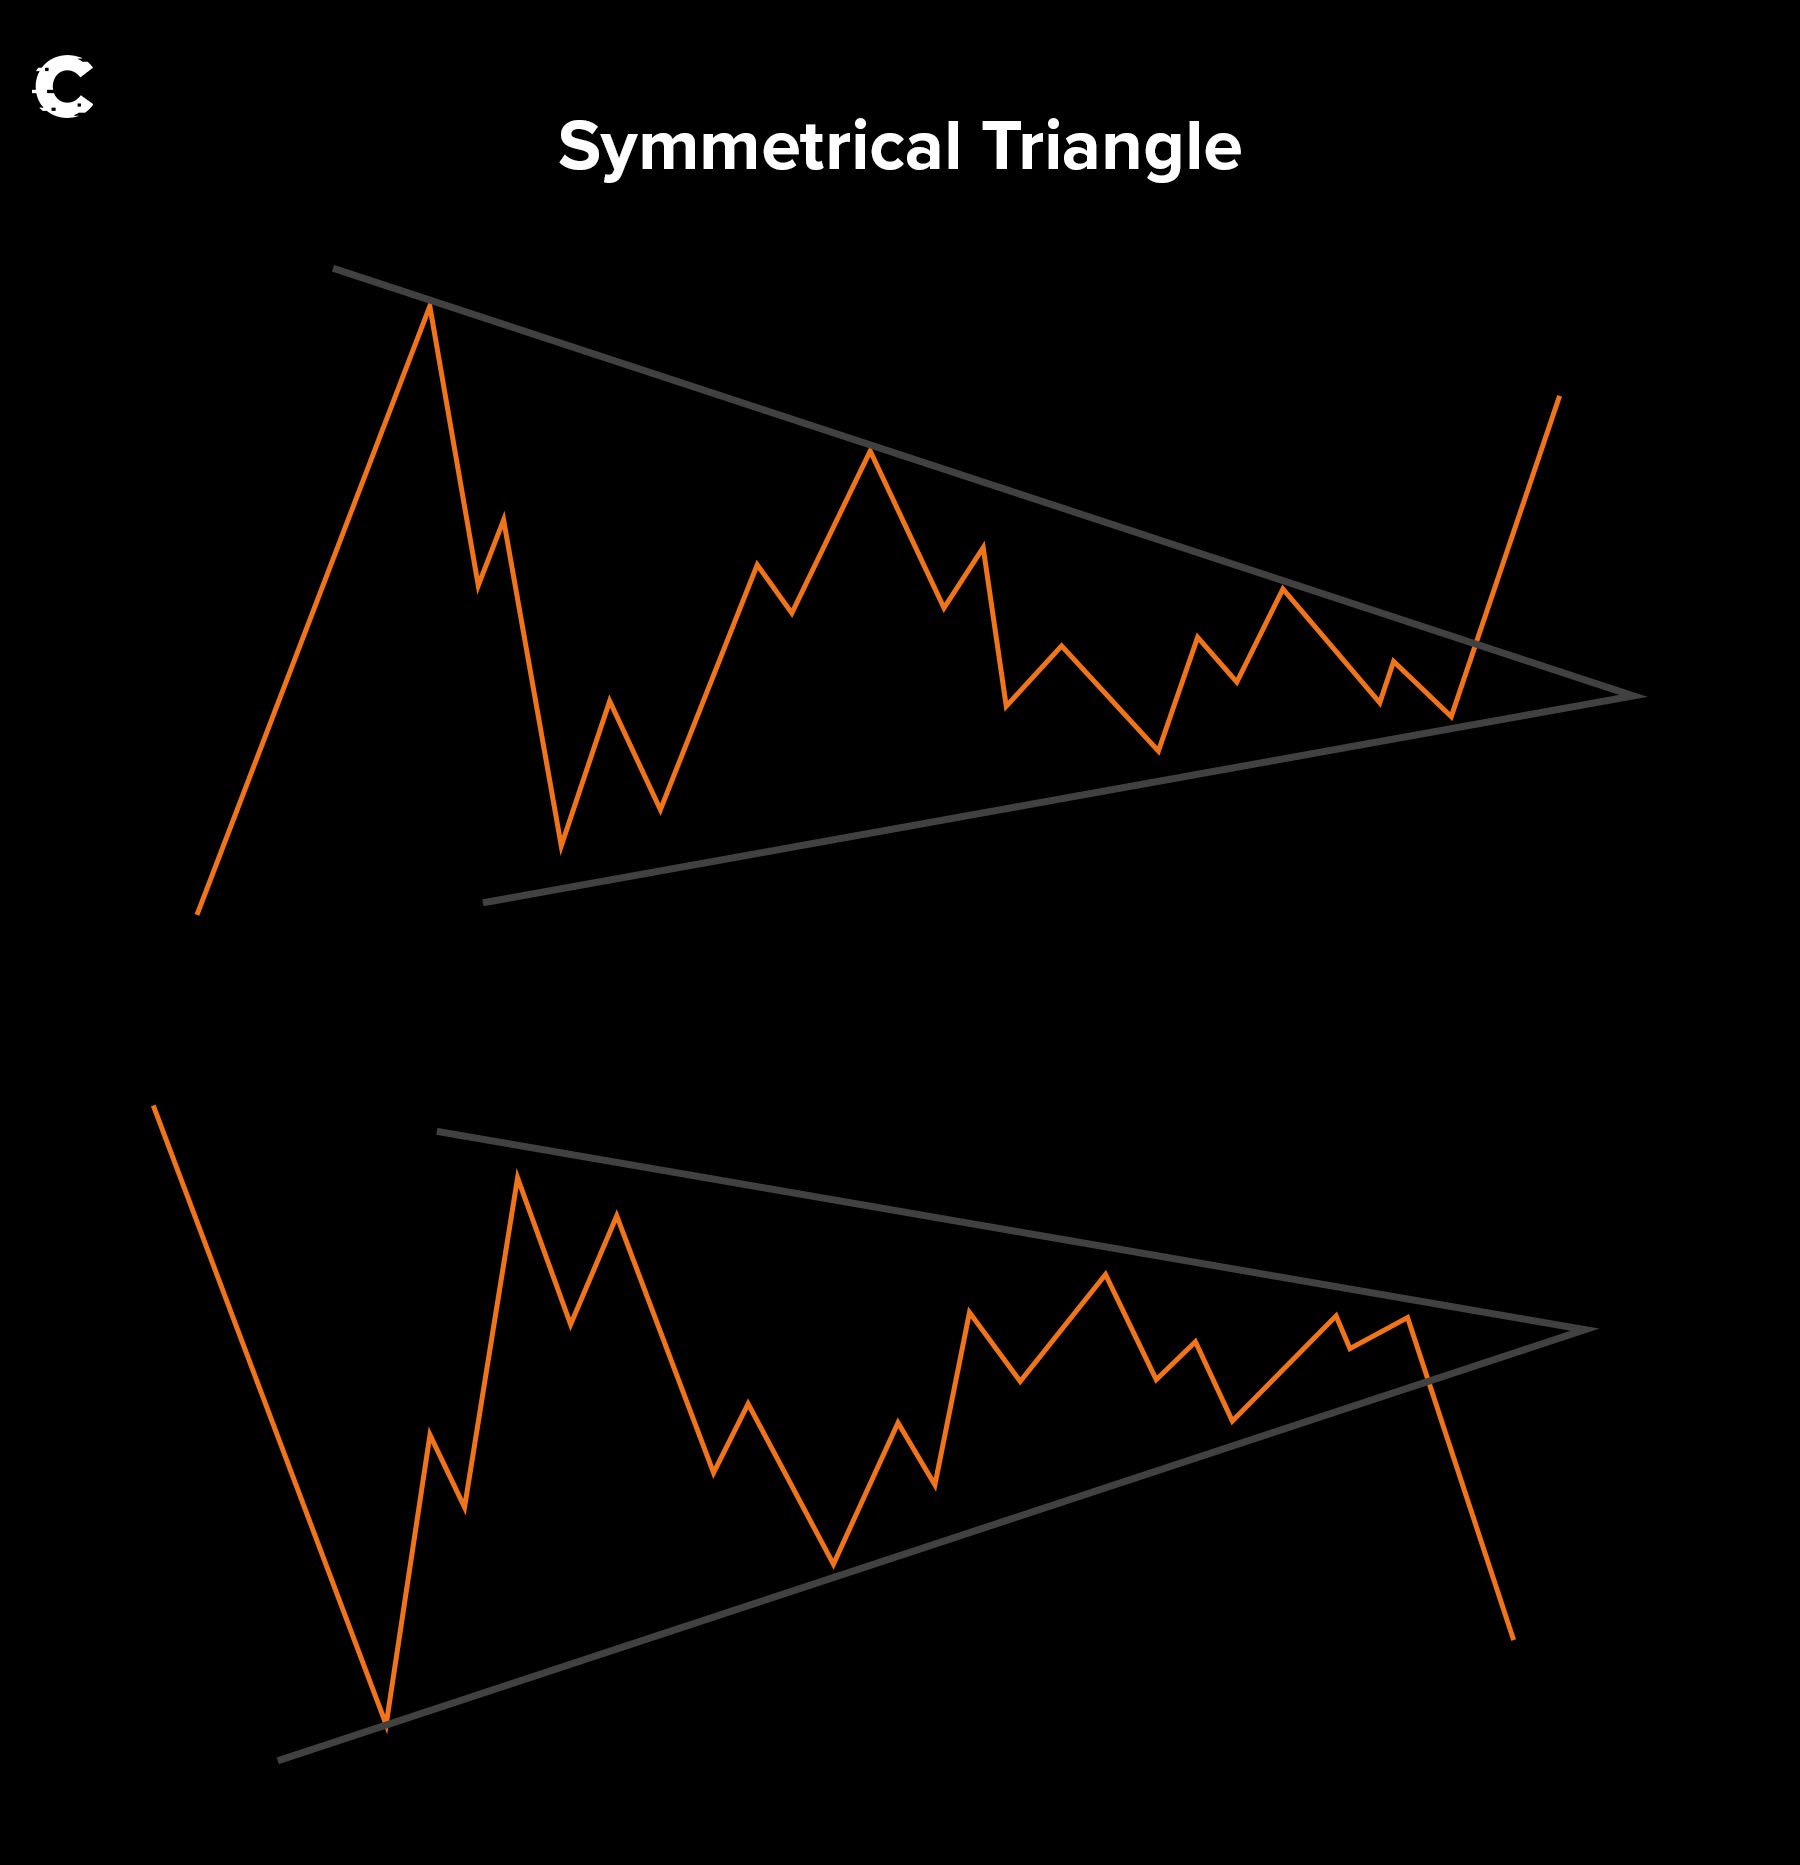 Symmetrical triangles can break in either direction. Their price ranges inside the pattern, forming lower highs on the upper trend line and higher lows on the bottom trend line.
But Cryptonary, how is that helpful?
Well, here’s a chart of RUNE’s daily timeframe and how it broke out from this pattern less than 24 hours ago 👇
Symmetrical triangles can break in either direction. Their price ranges inside the pattern, forming lower highs on the upper trend line and higher lows on the bottom trend line.
But Cryptonary, how is that helpful?
Well, here’s a chart of RUNE’s daily timeframe and how it broke out from this pattern less than 24 hours ago 👇
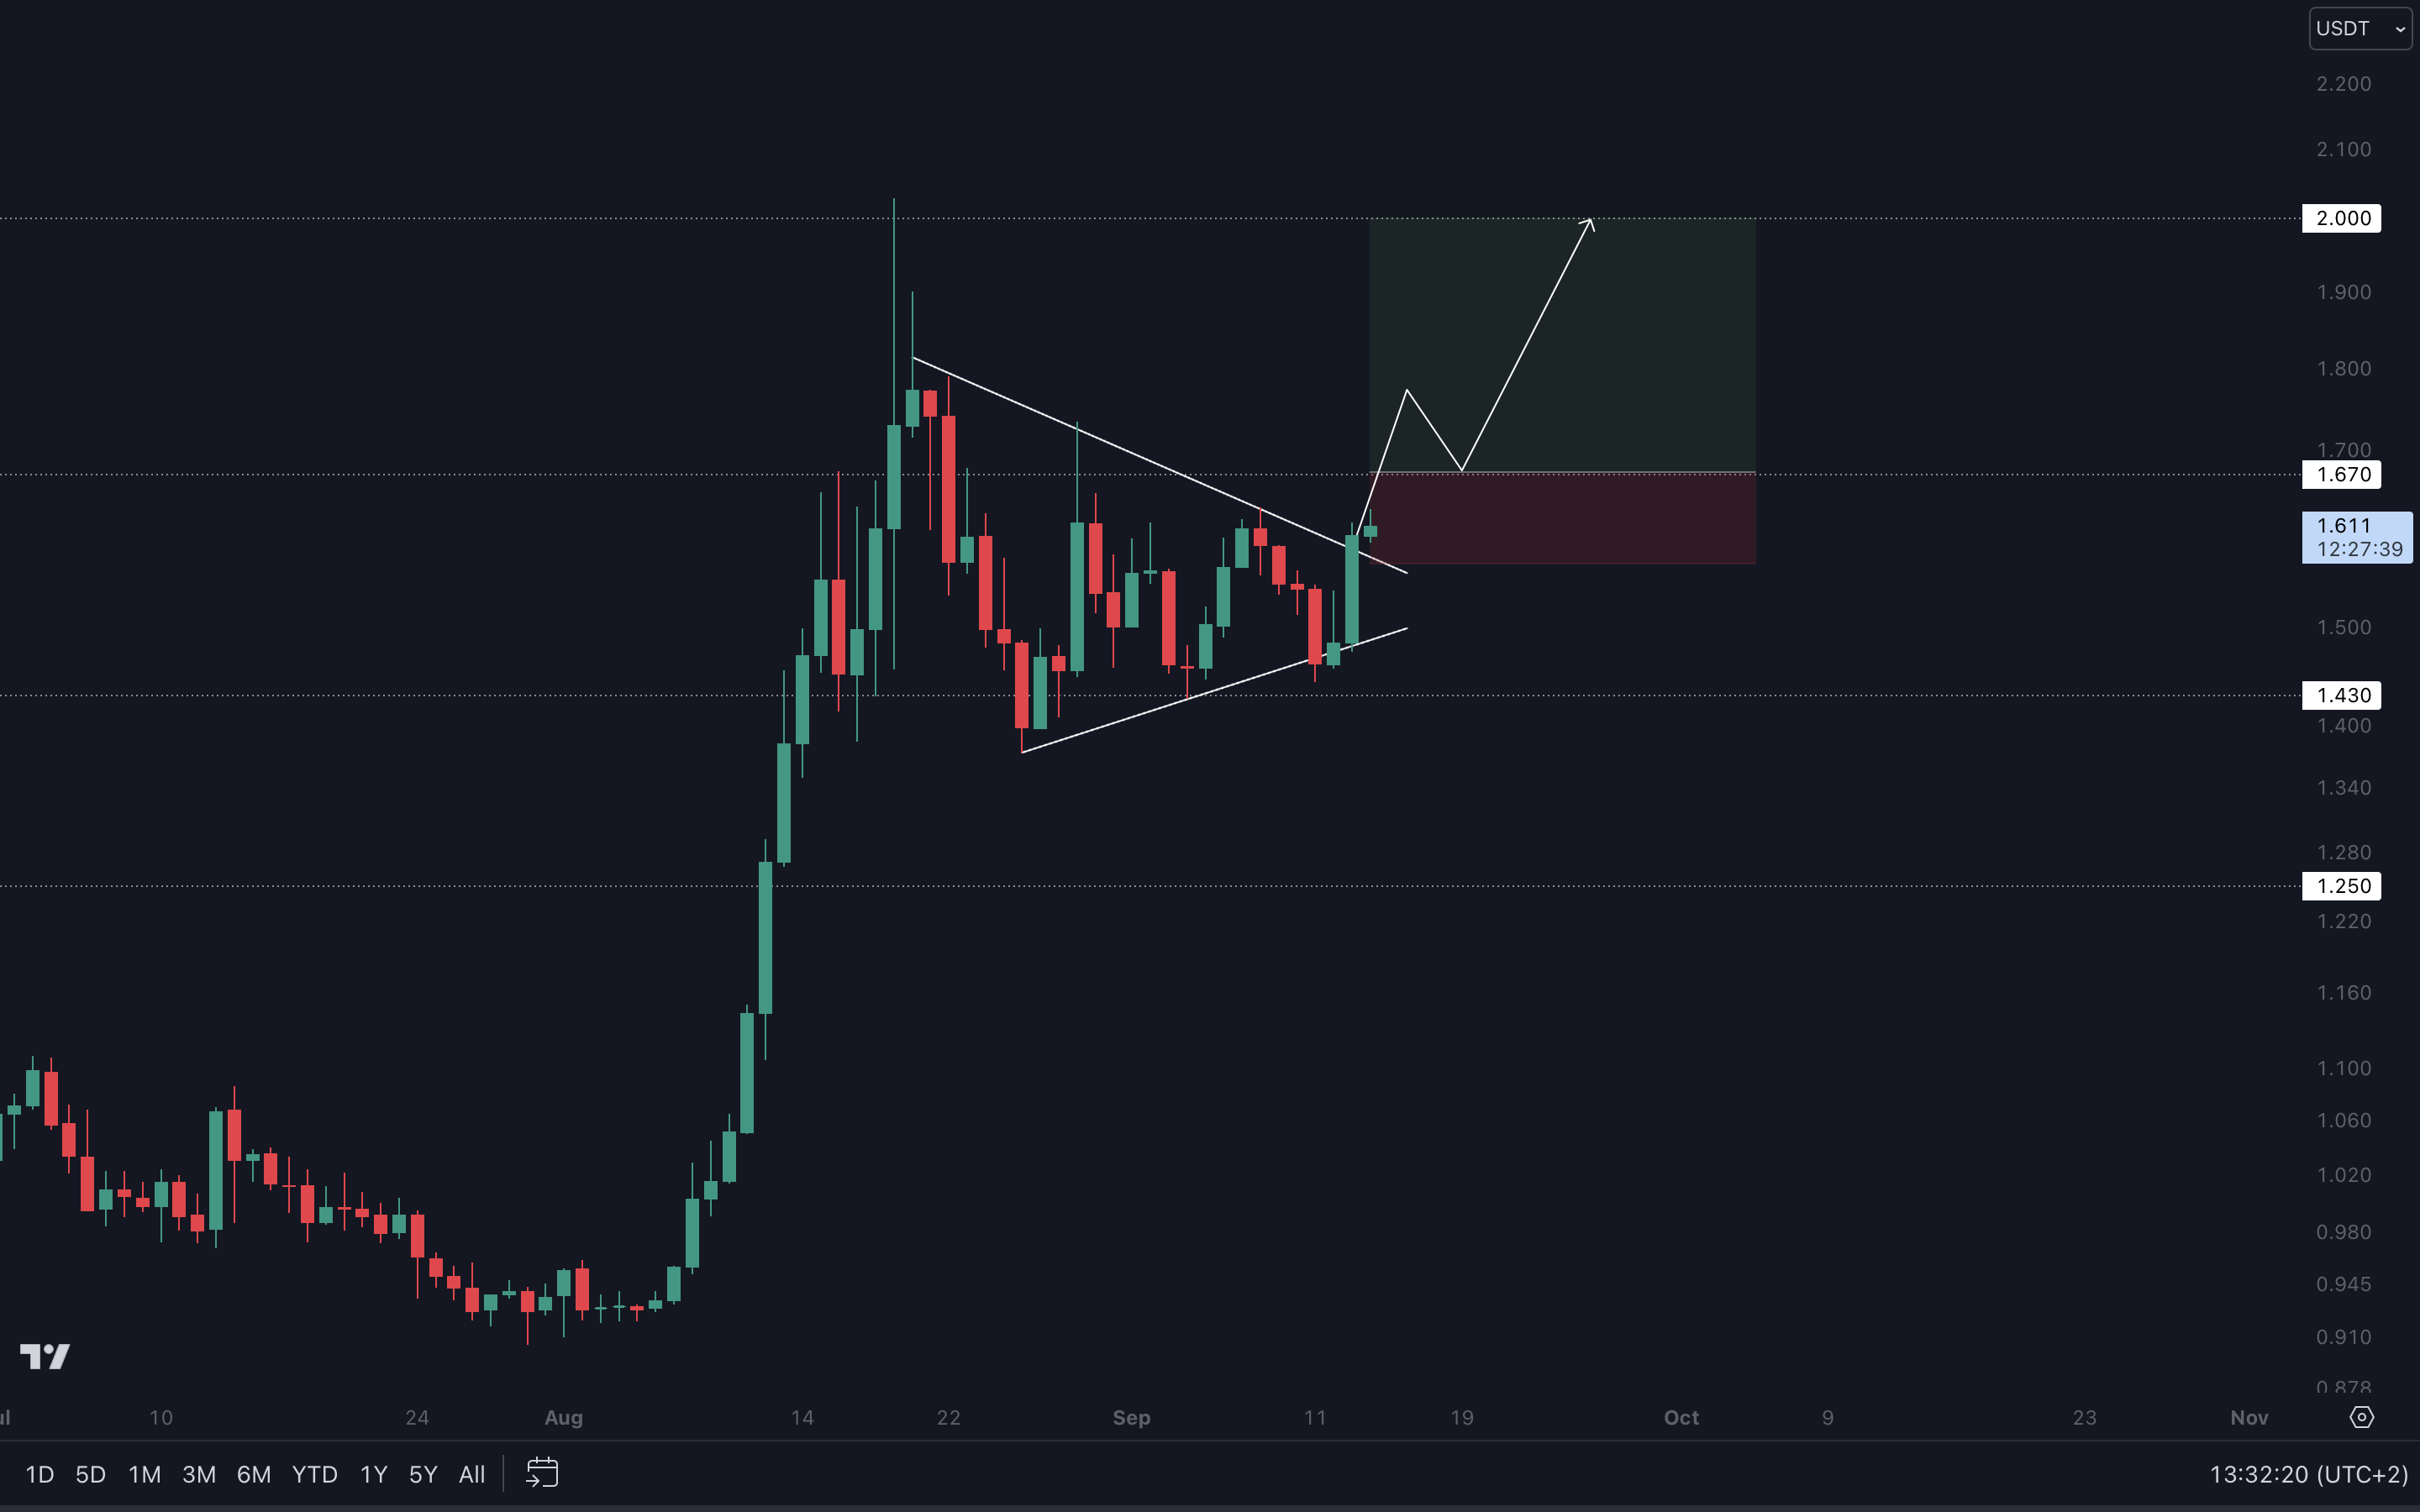
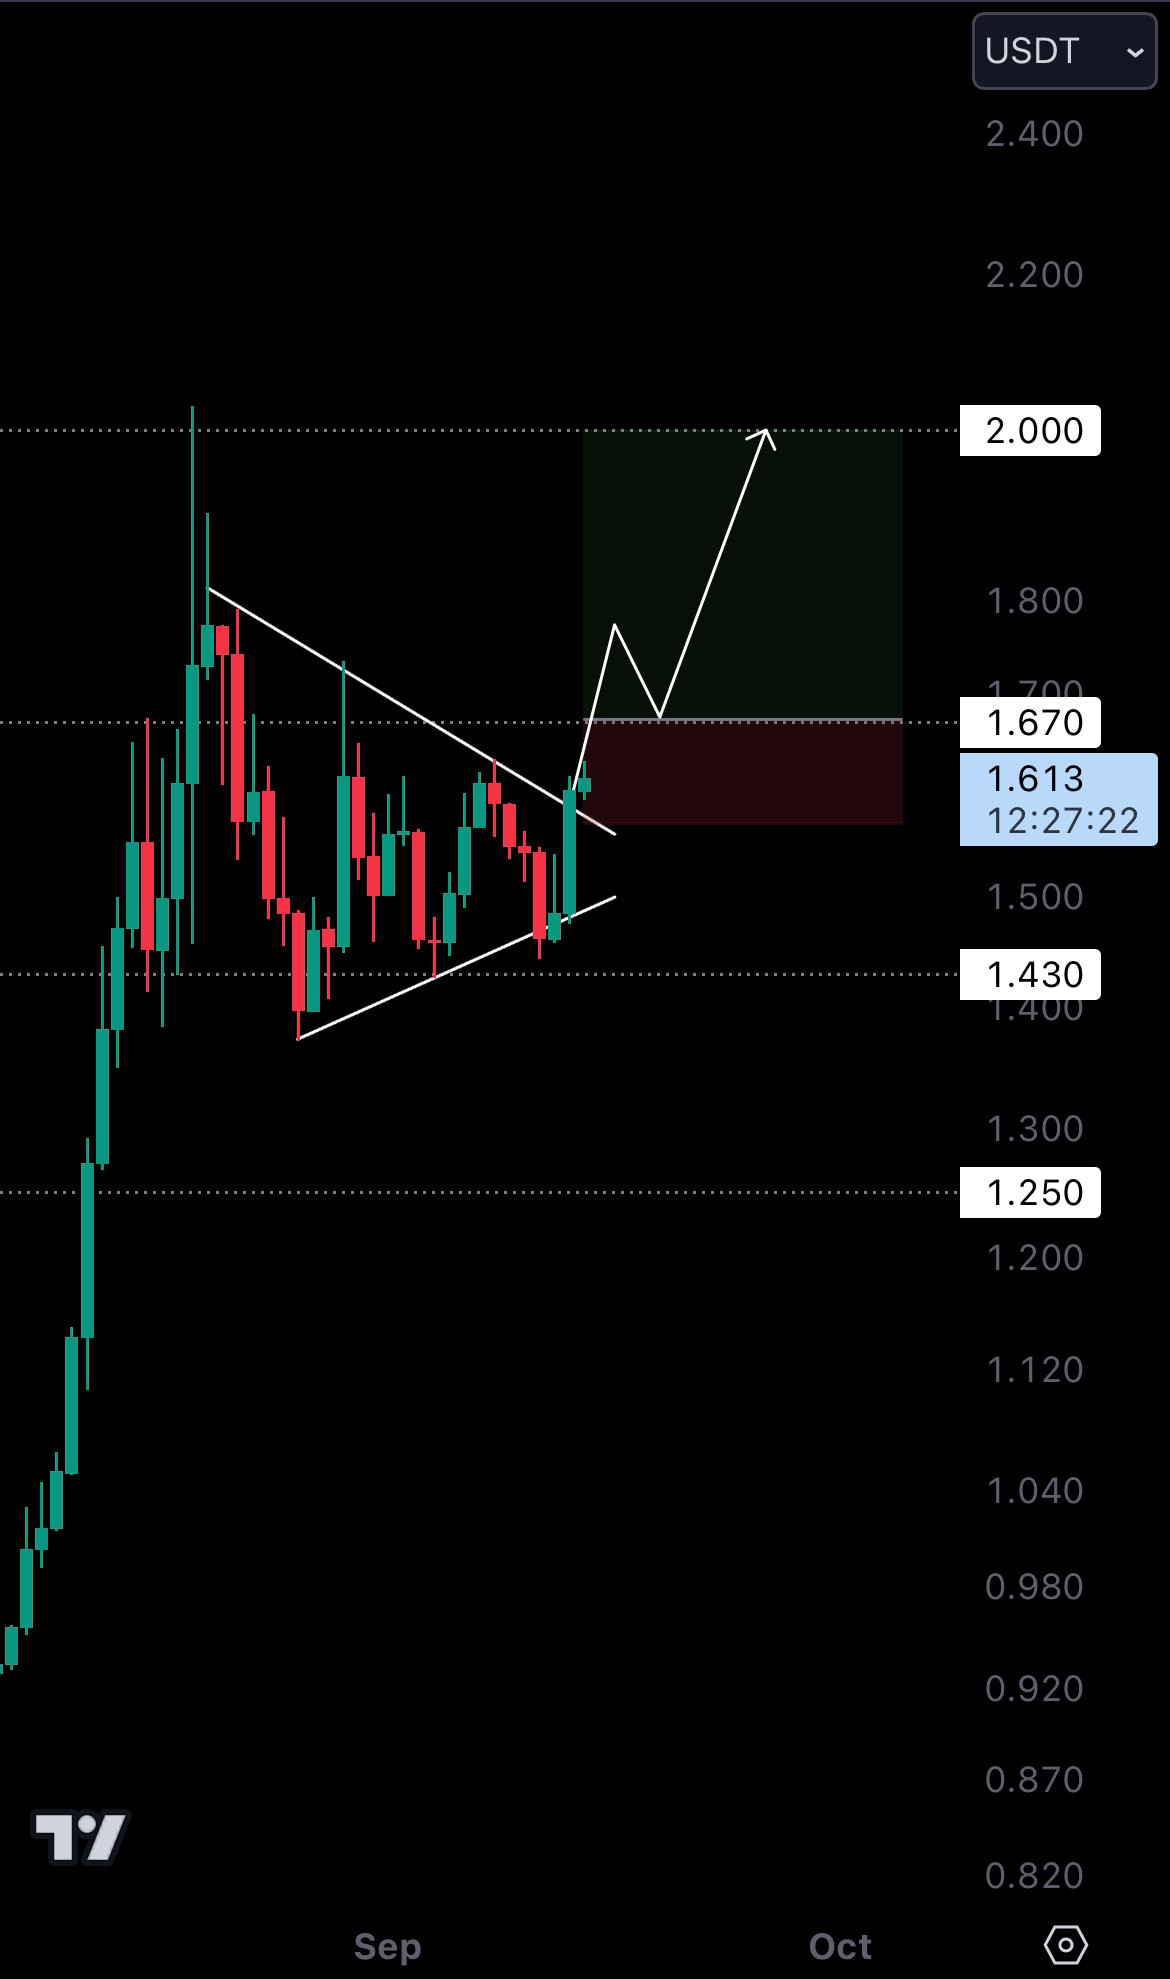 The play here is simple - we want a stronger confirmation.
As soon as RUNE breaks past $1.67, we will be waiting for a retest of this level as support to confirm a flip. From there, a trade can be taken as follows:
Entry: $1.67 (after flipping into support)
Exit: 50% at $1.835, the rest at $2 and higher prices.
Stop loss: $1.57 (or daily closure under $1.67)
This simple strategy will provide a 3.15 R/R for a setup in confluence with the general direction of Bitcoin’s current price action.
🚨NOTE: Not to be replicated without reading the disclaimer! This is not financial advice. Any decisions you make are entirely your responsibility!
The play here is simple - we want a stronger confirmation.
As soon as RUNE breaks past $1.67, we will be waiting for a retest of this level as support to confirm a flip. From there, a trade can be taken as follows:
Entry: $1.67 (after flipping into support)
Exit: 50% at $1.835, the rest at $2 and higher prices.
Stop loss: $1.57 (or daily closure under $1.67)
This simple strategy will provide a 3.15 R/R for a setup in confluence with the general direction of Bitcoin’s current price action.
🚨NOTE: Not to be replicated without reading the disclaimer! This is not financial advice. Any decisions you make are entirely your responsibility!
Time-sensitive play - hurry up! 🚨
We’ve shared this chart before, saying how we expect OP to reach support. Well, that day has come.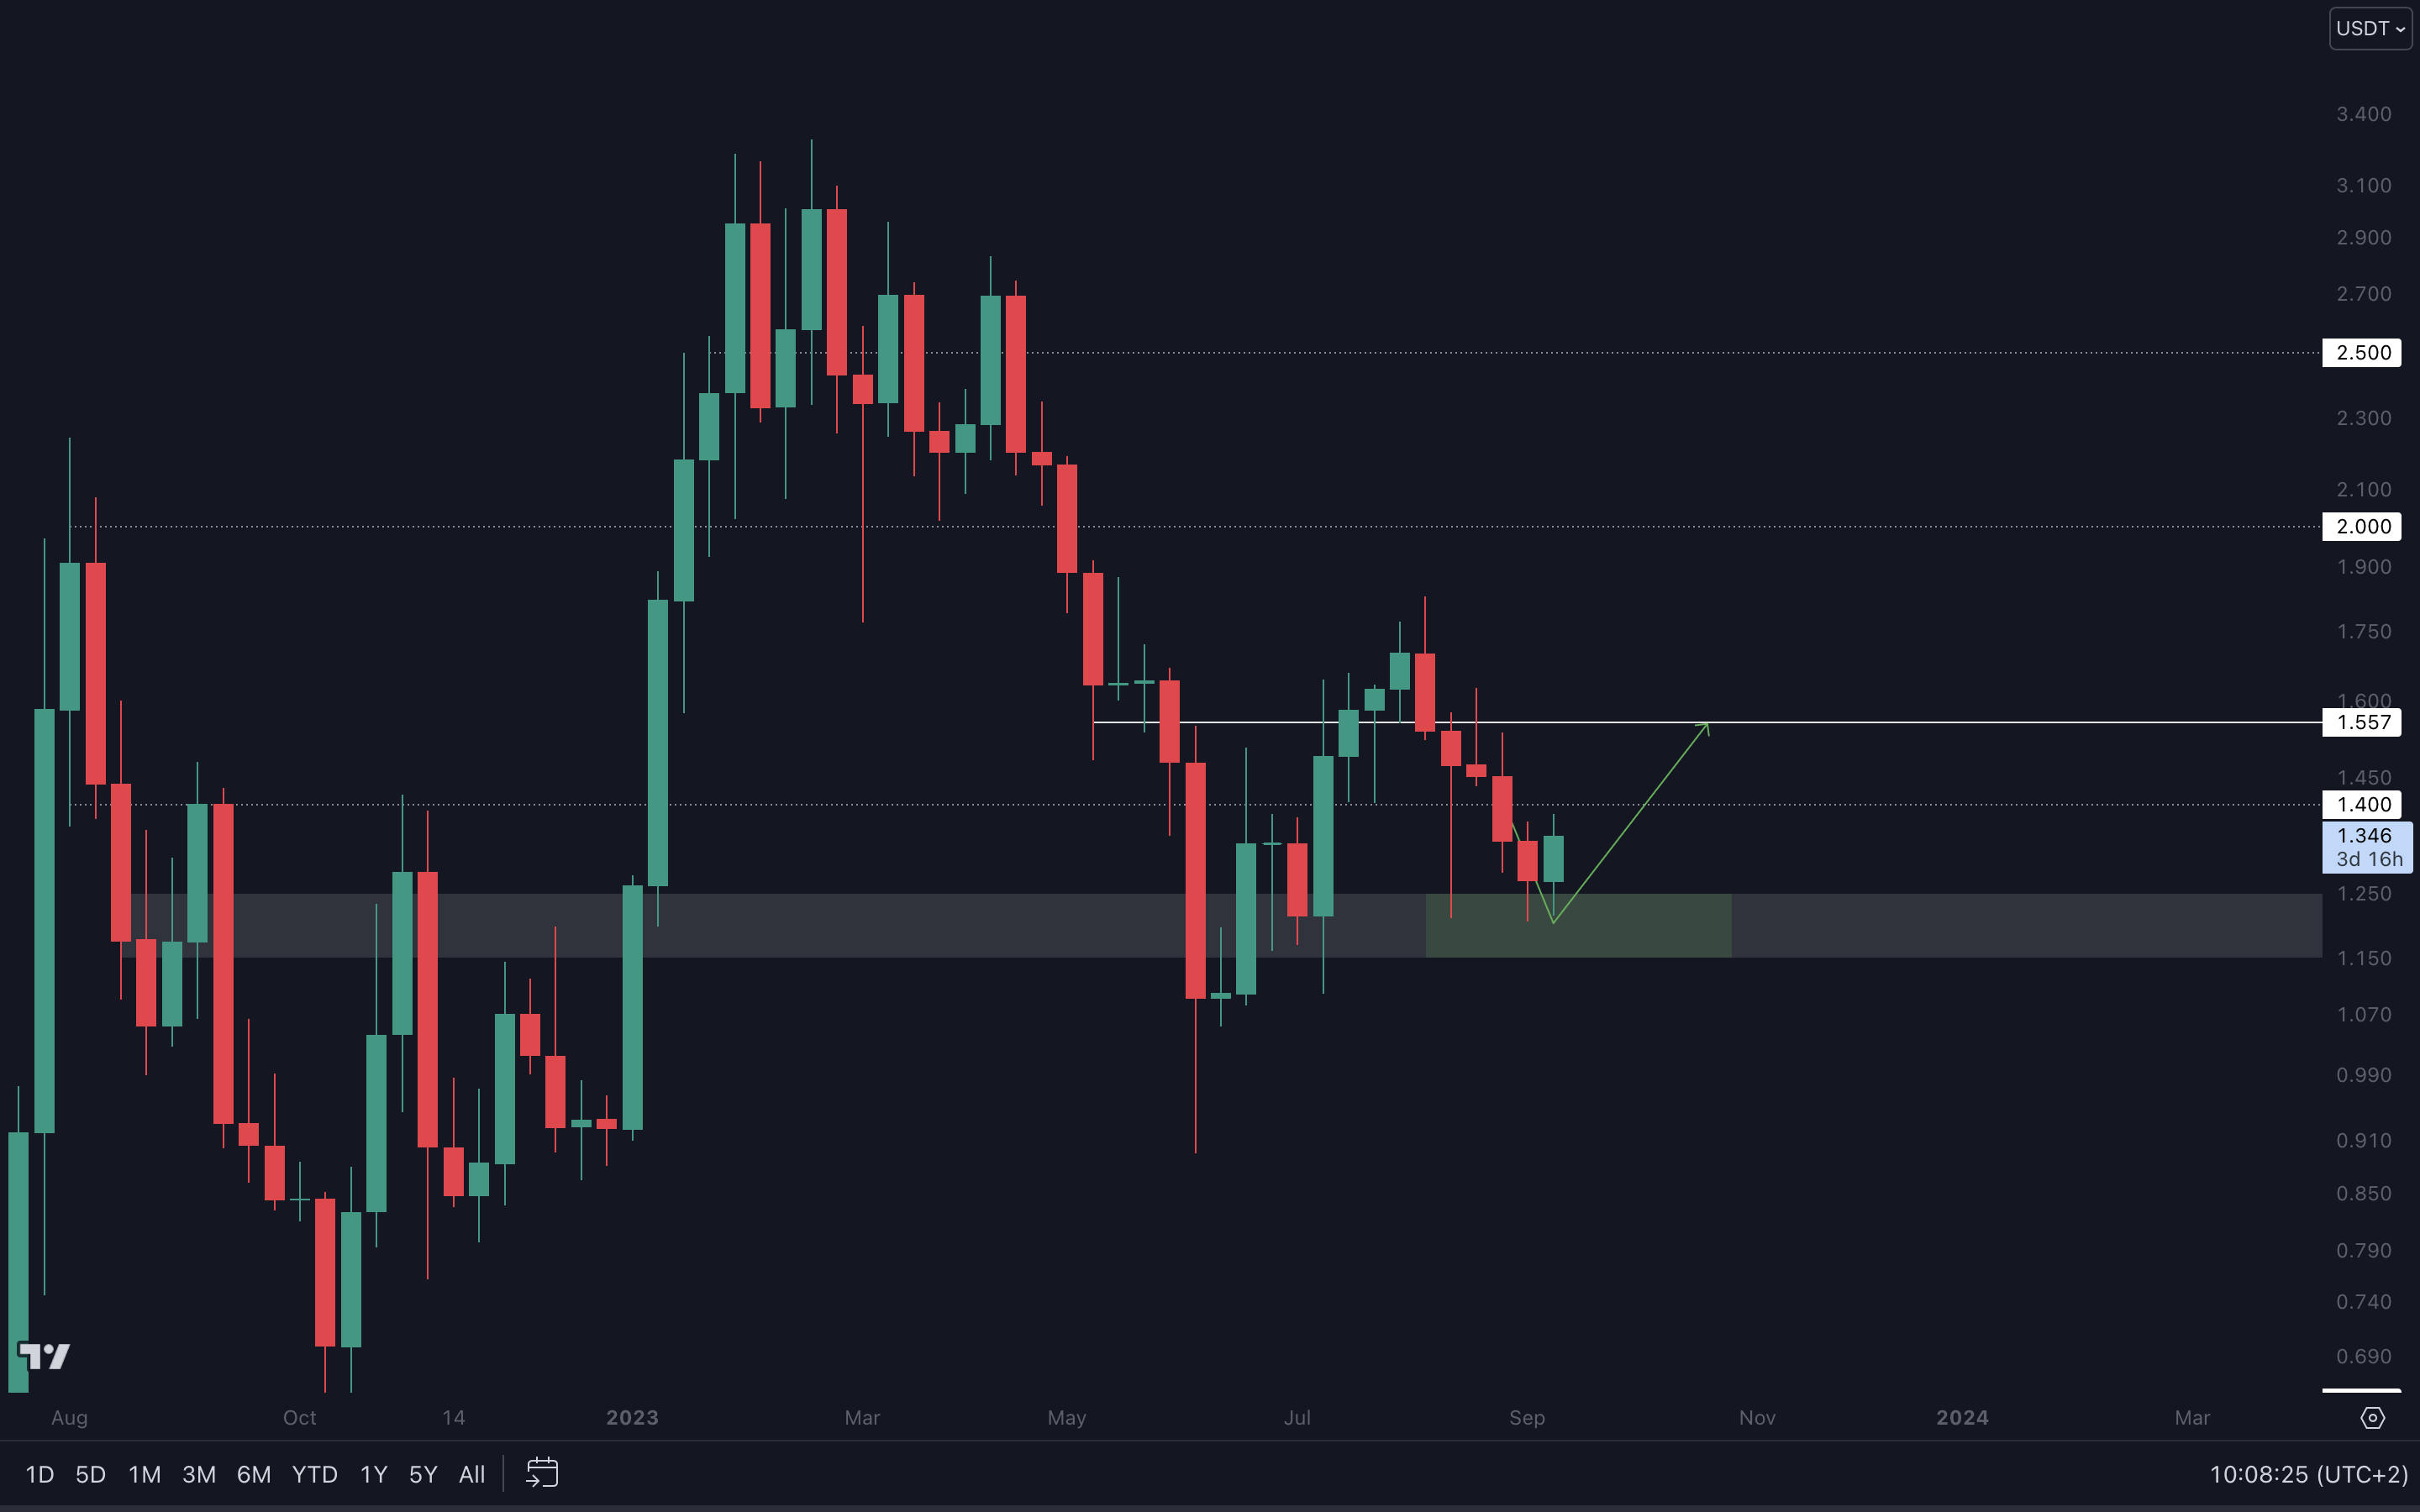
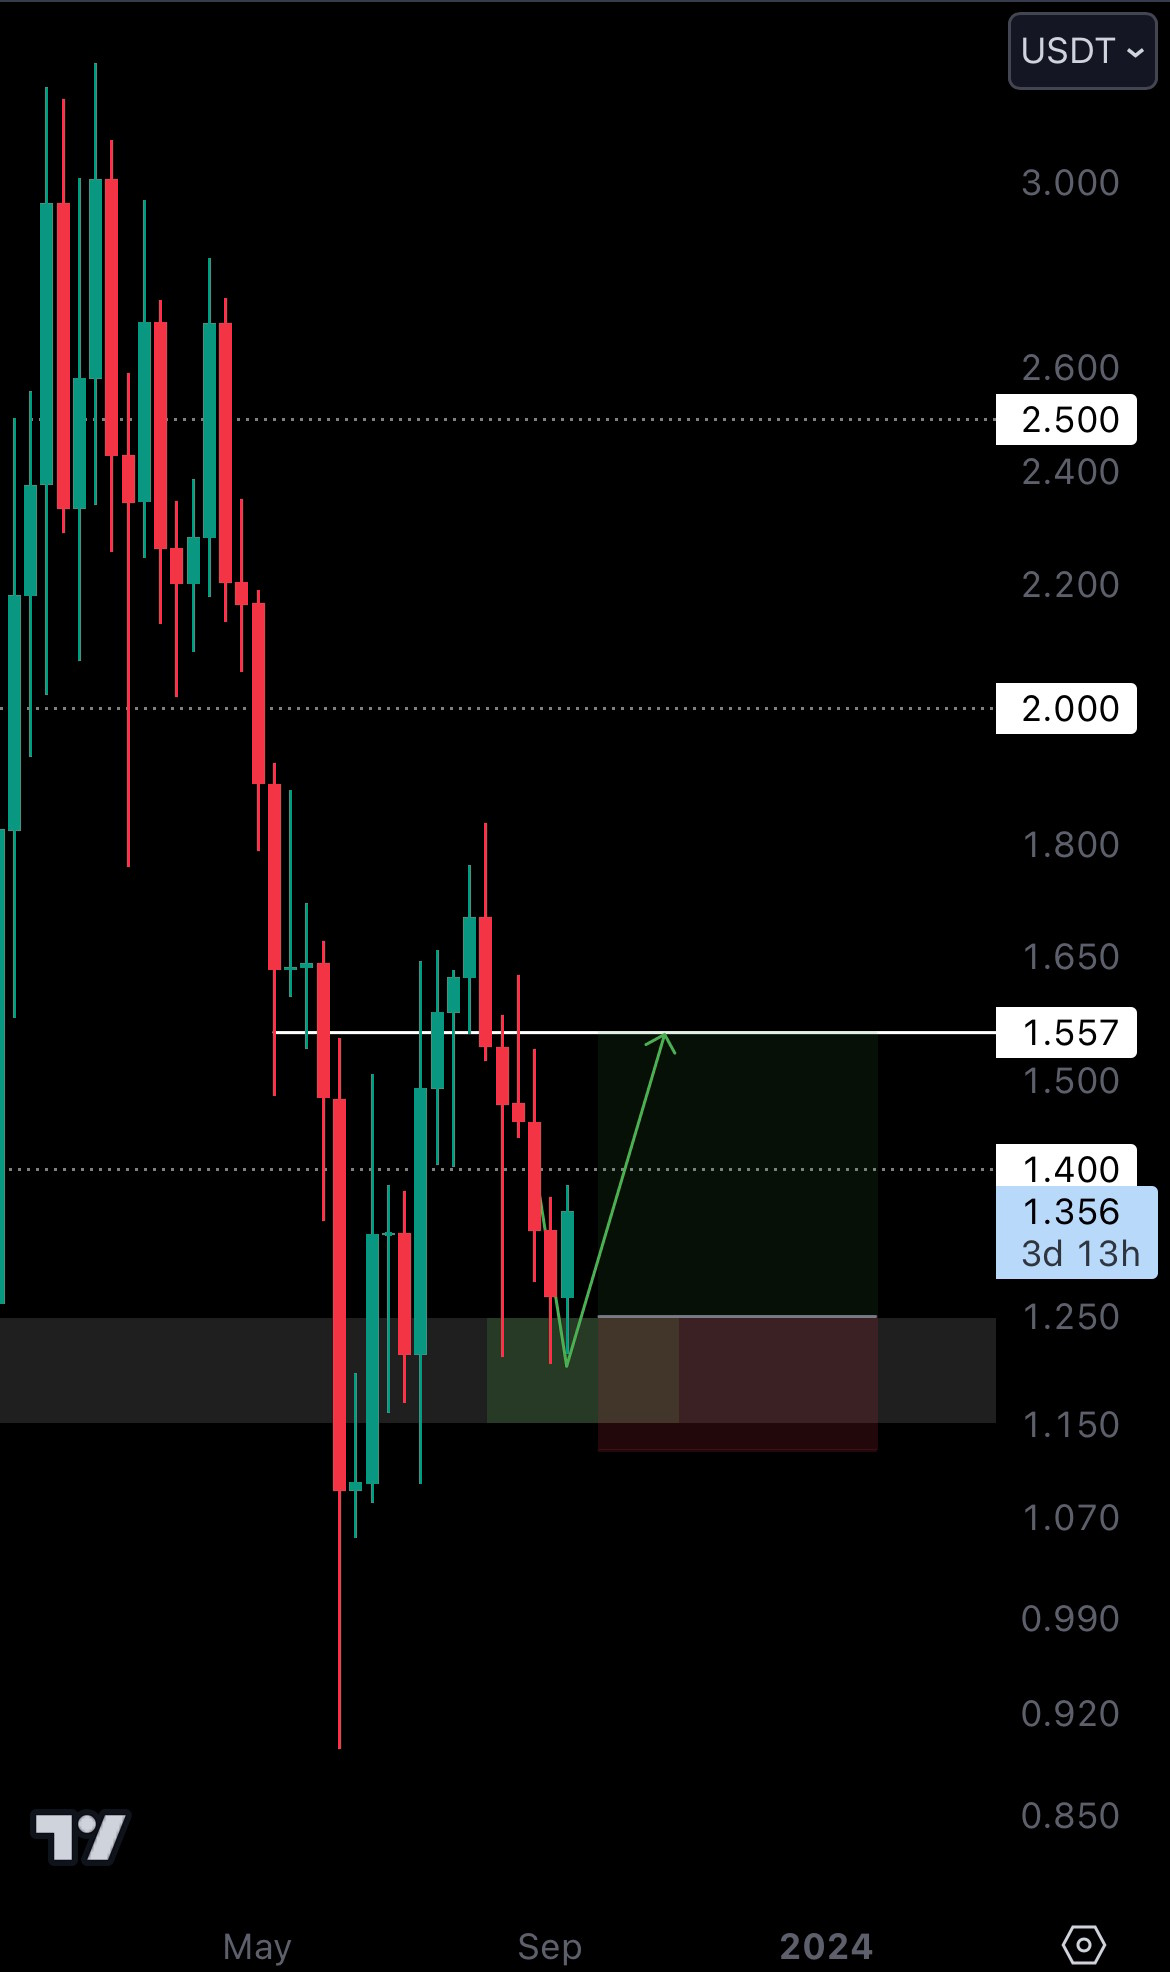 Last week, OP tested support inside the $1.25 - $1.15 region and instantly saw demand. Its price is now already on its way to $1.557.
OP’s price bouncing from this region will result in a higher low formed on the weekly timeframe, hinting at a potential market structure change. This is also in confluence with our trade.
Our plan? Let us share the move👇
Entry: $1.25 (only if price retraces again)
Exit: 50% at $1.40, the rest at $1.557 and higher prices.
Stop loss: $1.127 (or daily closure under $1.15)
Given how OP’s price is already on the move, entering now comes with more risk and a lower reward. Instead, we’ll be waiting for its price to come back down inside the $1.25 - $1.15 region and enter from there.
If it doesn’t come back down, we’d happily forego this trade and move on to the next one.
🚨NOTE: Not to be replicated without reading the disclaimer! This is not financial advice. Any decisions you make are entirely your responsibility!
Last week, OP tested support inside the $1.25 - $1.15 region and instantly saw demand. Its price is now already on its way to $1.557.
OP’s price bouncing from this region will result in a higher low formed on the weekly timeframe, hinting at a potential market structure change. This is also in confluence with our trade.
Our plan? Let us share the move👇
Entry: $1.25 (only if price retraces again)
Exit: 50% at $1.40, the rest at $1.557 and higher prices.
Stop loss: $1.127 (or daily closure under $1.15)
Given how OP’s price is already on the move, entering now comes with more risk and a lower reward. Instead, we’ll be waiting for its price to come back down inside the $1.25 - $1.15 region and enter from there.
If it doesn’t come back down, we’d happily forego this trade and move on to the next one.
🚨NOTE: Not to be replicated without reading the disclaimer! This is not financial advice. Any decisions you make are entirely your responsibility!
Can you book profits by betting against this token? 🤔
We give a different type of cake this week - a short opportunity 📉
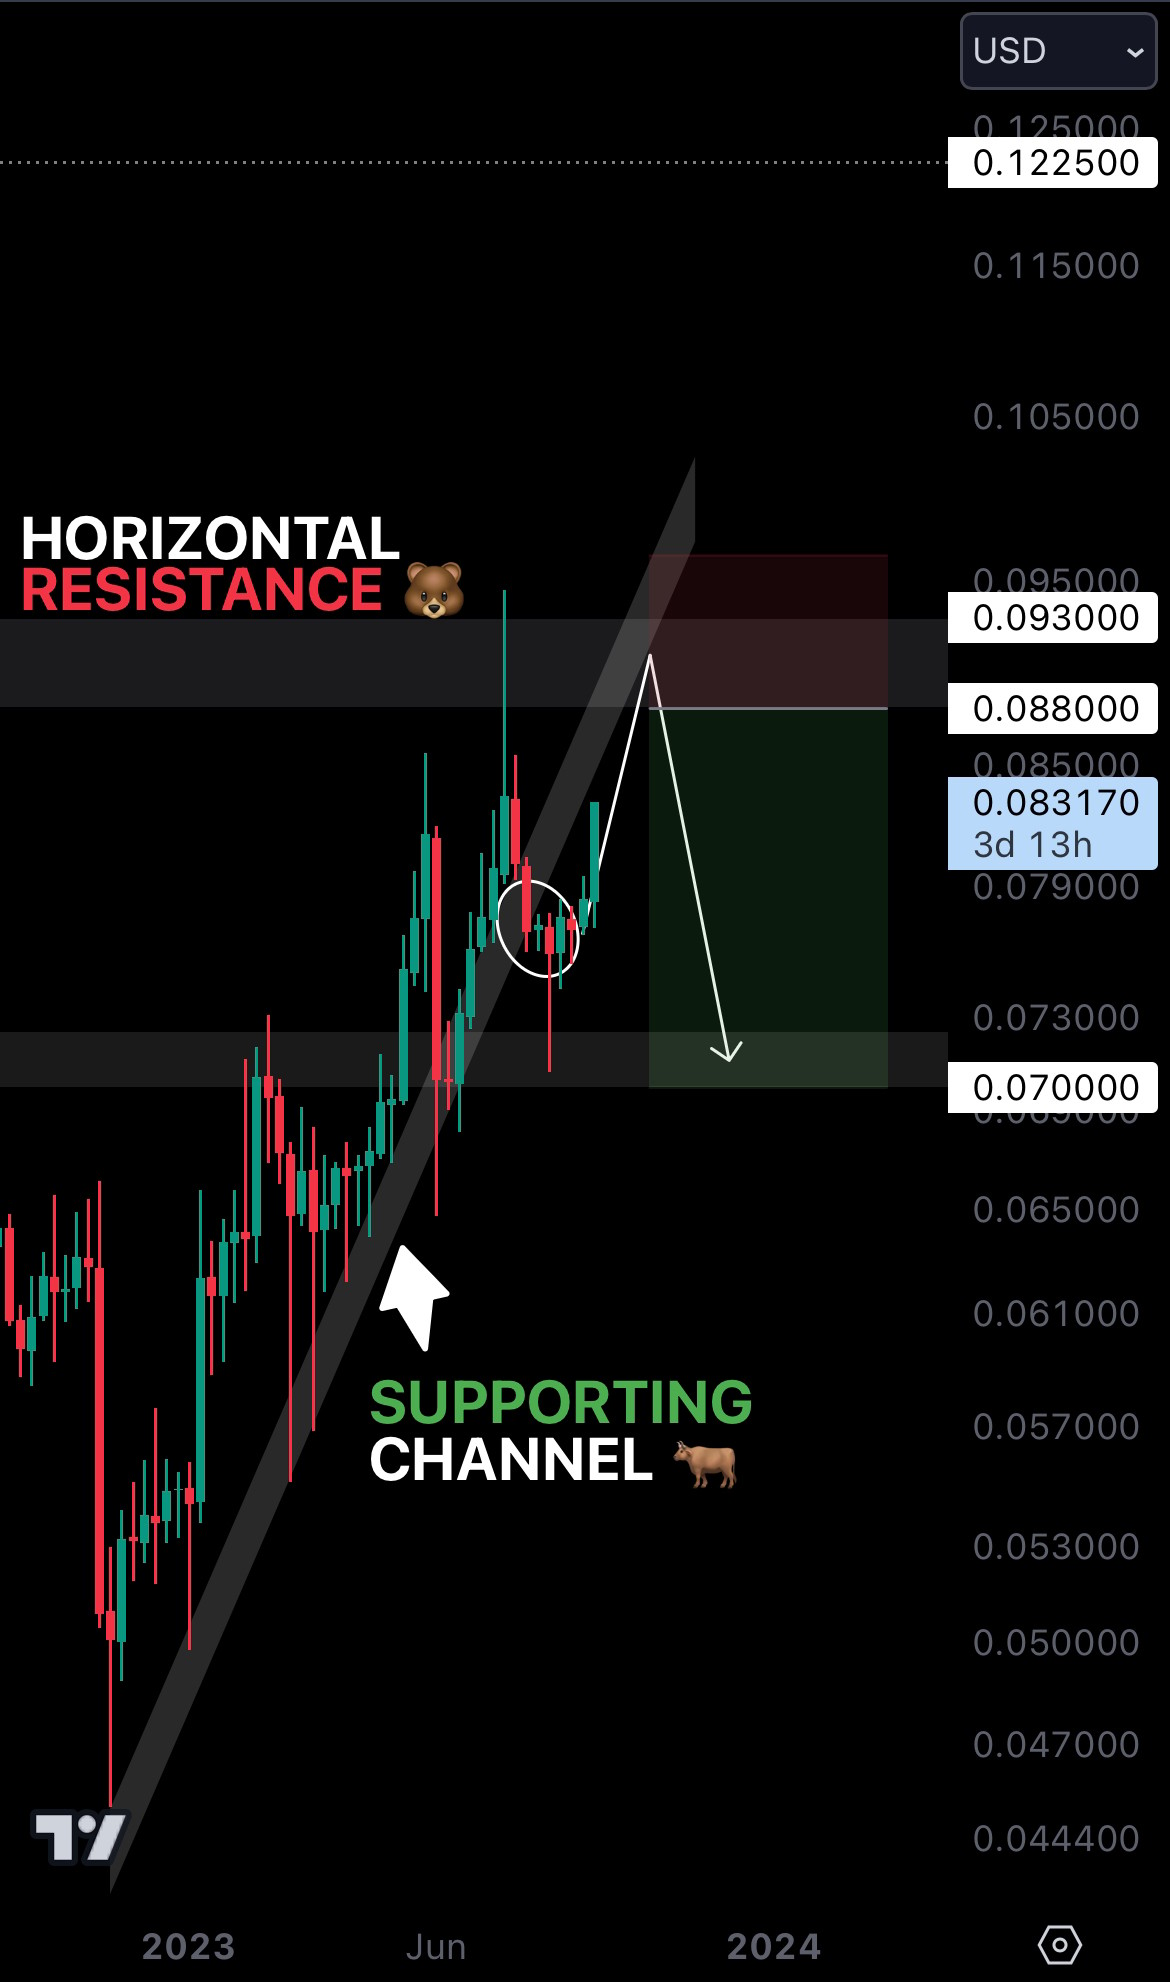 We nailed TRX in the past and caught a whopping 30% gain. Since then, its price has seen a loss of the supporting channel. This gave us a hint at a potential change of trends.
After losing the channel as support, its price consolidated for a few weeks before finding demand and starting to rise again. As a result, we might’ve formed a local bottom, and TRX is now on track for resistance again.
The interesting thing here is that the horizontal region and the diagonal channel will both coincide as resistance at some point. By our estimations, that will happen sometime in October.
So, what do we do once TRX reaches that region? We short. 👇
Entry: $0.088
Exit: 50% at $0.079, the rest at $0.07 and lower prices.
Stop loss: $0.095 (or higher, depending on risk appetite)
In full, this trade offers a 20% gain, and we reduce our risk by setting a stop loss and following the general trend. By the time TRX tests our expected entry region, Bitcoin will also be testing resistance - more on that below!
🚨NOTE: Not to be replicated without reading the disclaimer! This is not financial advice. Any decisions you make are entirely your responsibility!
We nailed TRX in the past and caught a whopping 30% gain. Since then, its price has seen a loss of the supporting channel. This gave us a hint at a potential change of trends.
After losing the channel as support, its price consolidated for a few weeks before finding demand and starting to rise again. As a result, we might’ve formed a local bottom, and TRX is now on track for resistance again.
The interesting thing here is that the horizontal region and the diagonal channel will both coincide as resistance at some point. By our estimations, that will happen sometime in October.
So, what do we do once TRX reaches that region? We short. 👇
Entry: $0.088
Exit: 50% at $0.079, the rest at $0.07 and lower prices.
Stop loss: $0.095 (or higher, depending on risk appetite)
In full, this trade offers a 20% gain, and we reduce our risk by setting a stop loss and following the general trend. By the time TRX tests our expected entry region, Bitcoin will also be testing resistance - more on that below!
🚨NOTE: Not to be replicated without reading the disclaimer! This is not financial advice. Any decisions you make are entirely your responsibility!
Understanding Bitcoin’s fate 🔮
There are two major things happening on Bitcoin at this very moment…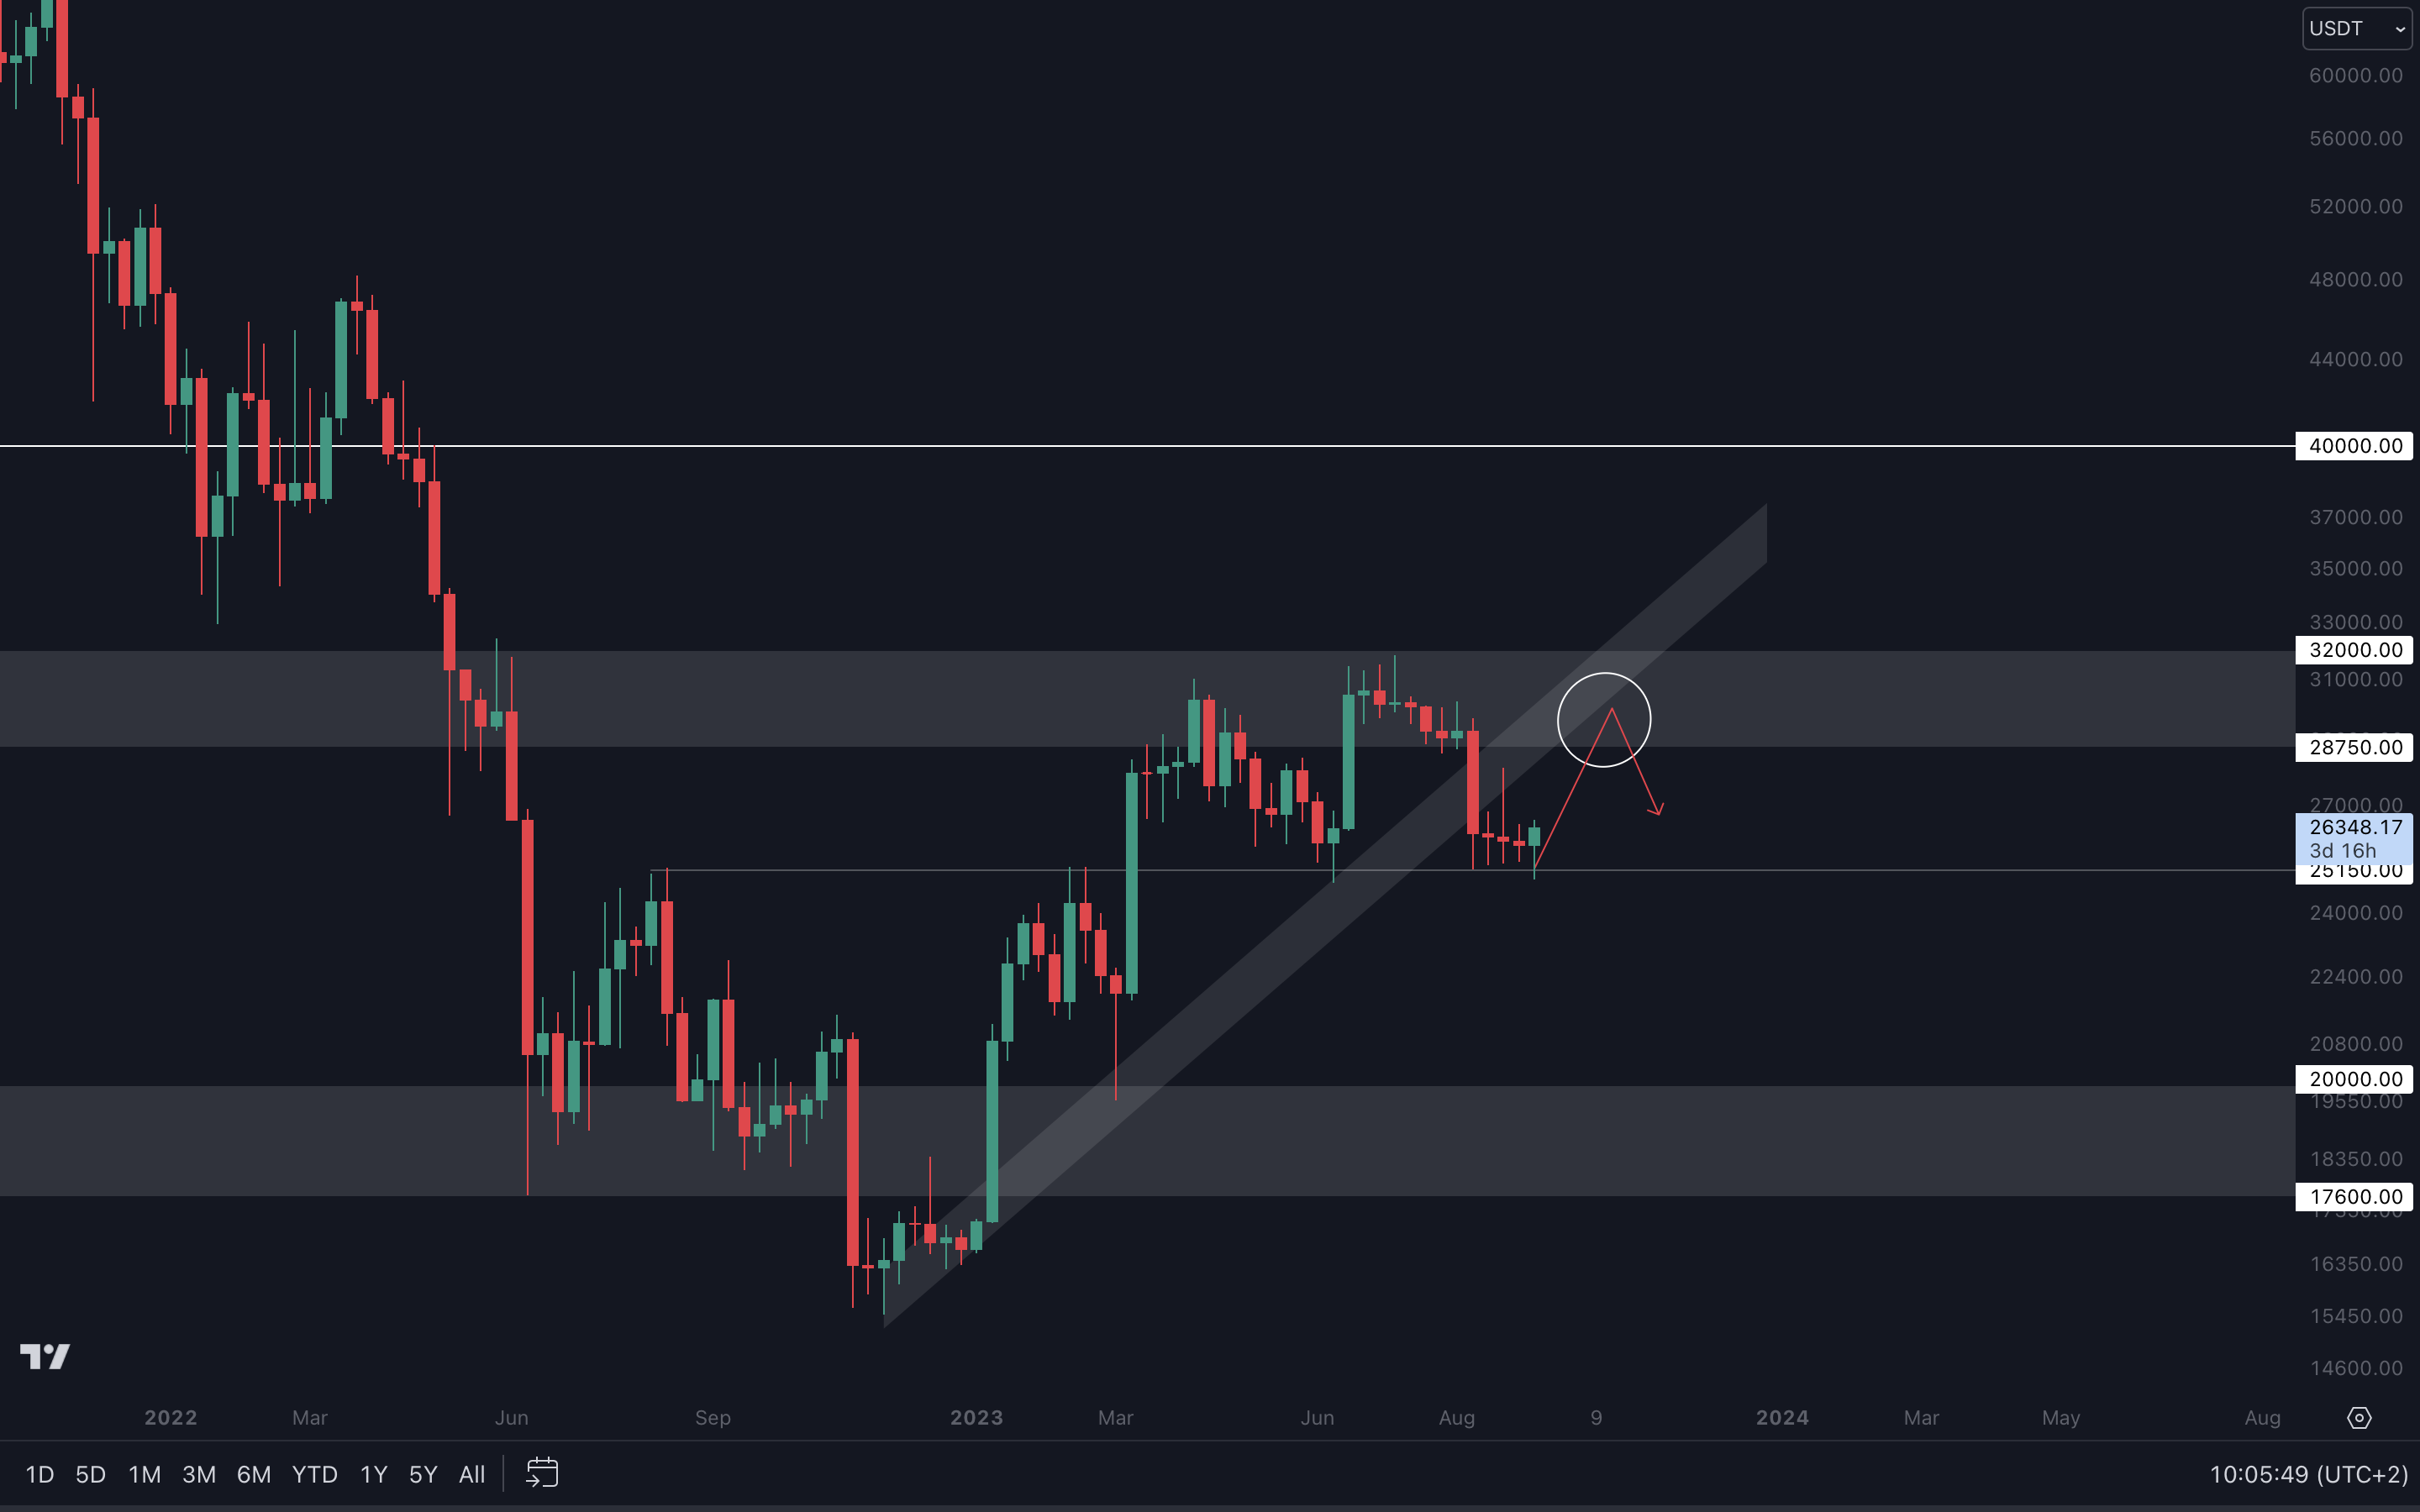
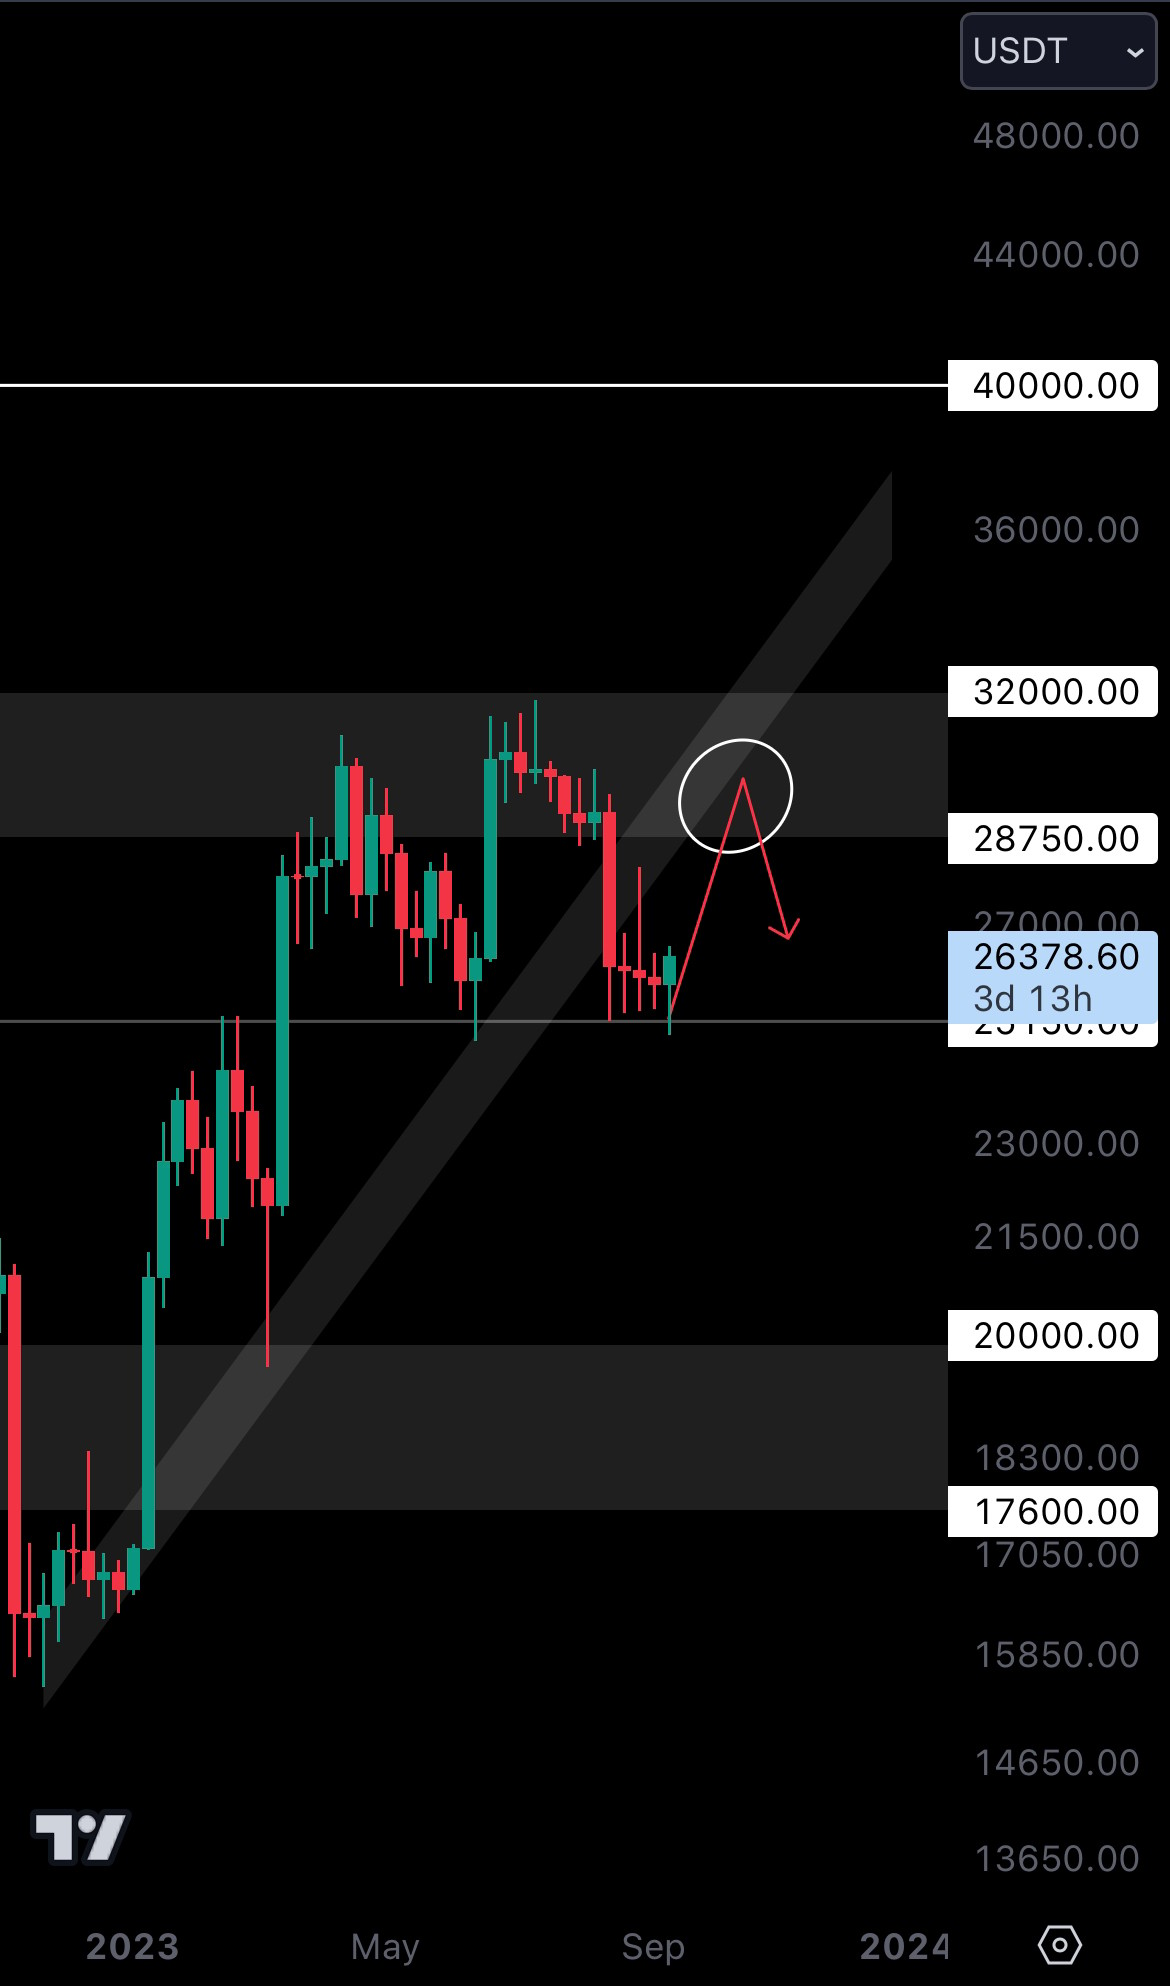
This week was nothing but surprising - just when we thought the asset was about to lose support, buyers jumped in to save the day and pushed its price immediately. This event helped avoid the formation of a lower low, which could’ve signalled much more downside to come. Plus, Bitcoin’s price managed to hold support on the lower timeframes, and closing the week as is will likely lead to an uptrend to the $28,750 - $32,000 region. Even better, the current narrative supports this move as we approach the first approved Bitcoin Spot ETF in history. Here’s where things become pessimistic 👇 The only confirmation we’ll ever have of significant upside is if Bitcoin breaks past $32,000. We’ve tried reaching and breaking that level twice multiple times in the past year, and all attempts were unsuccessful. As analysis is based on past data, the only thing we can expect from Bitcoin right now is another failed attempt at breaking past that level. As a result, we believe Bitcoin’s price can reach the $28,750 - $32,000 range, but it will ultimately fail to rise higher. Instead, it will be rejected and descend toward $25,150 again. Of course, a Bitcoin Spot ETF being approved can have an immense impact on price, and our thesis will likely change if this happens in the remaining months of 2023.
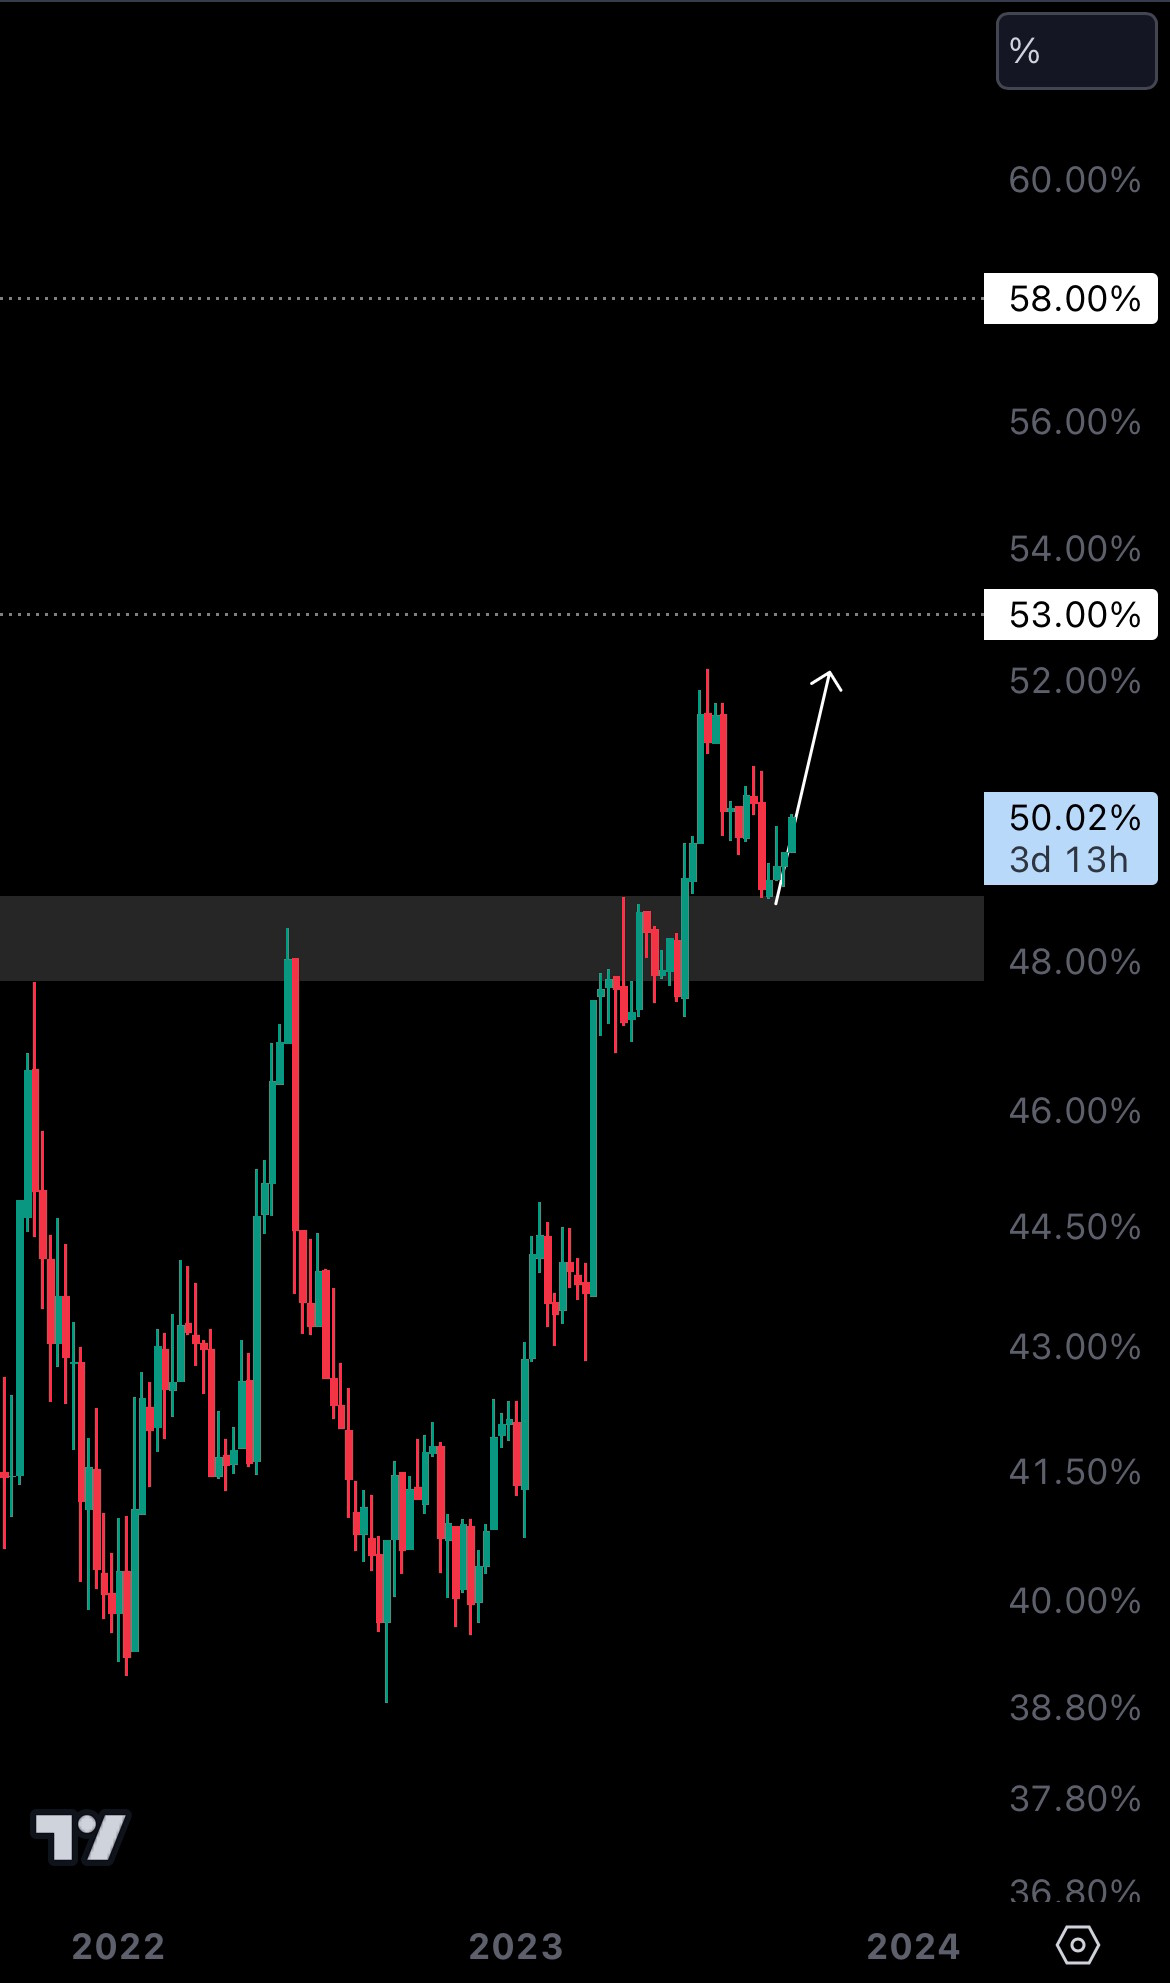
What about Bitcoin’s dominance?
Put simply, Bitcoin’s price rising whilst its dominance is on the rise also always results in a boring altcoins market. With a Spot ETF on its way, all the attention will most likely move toward Bitcoin, bringing boredom and unwanted bearish momentum to the altcoins market.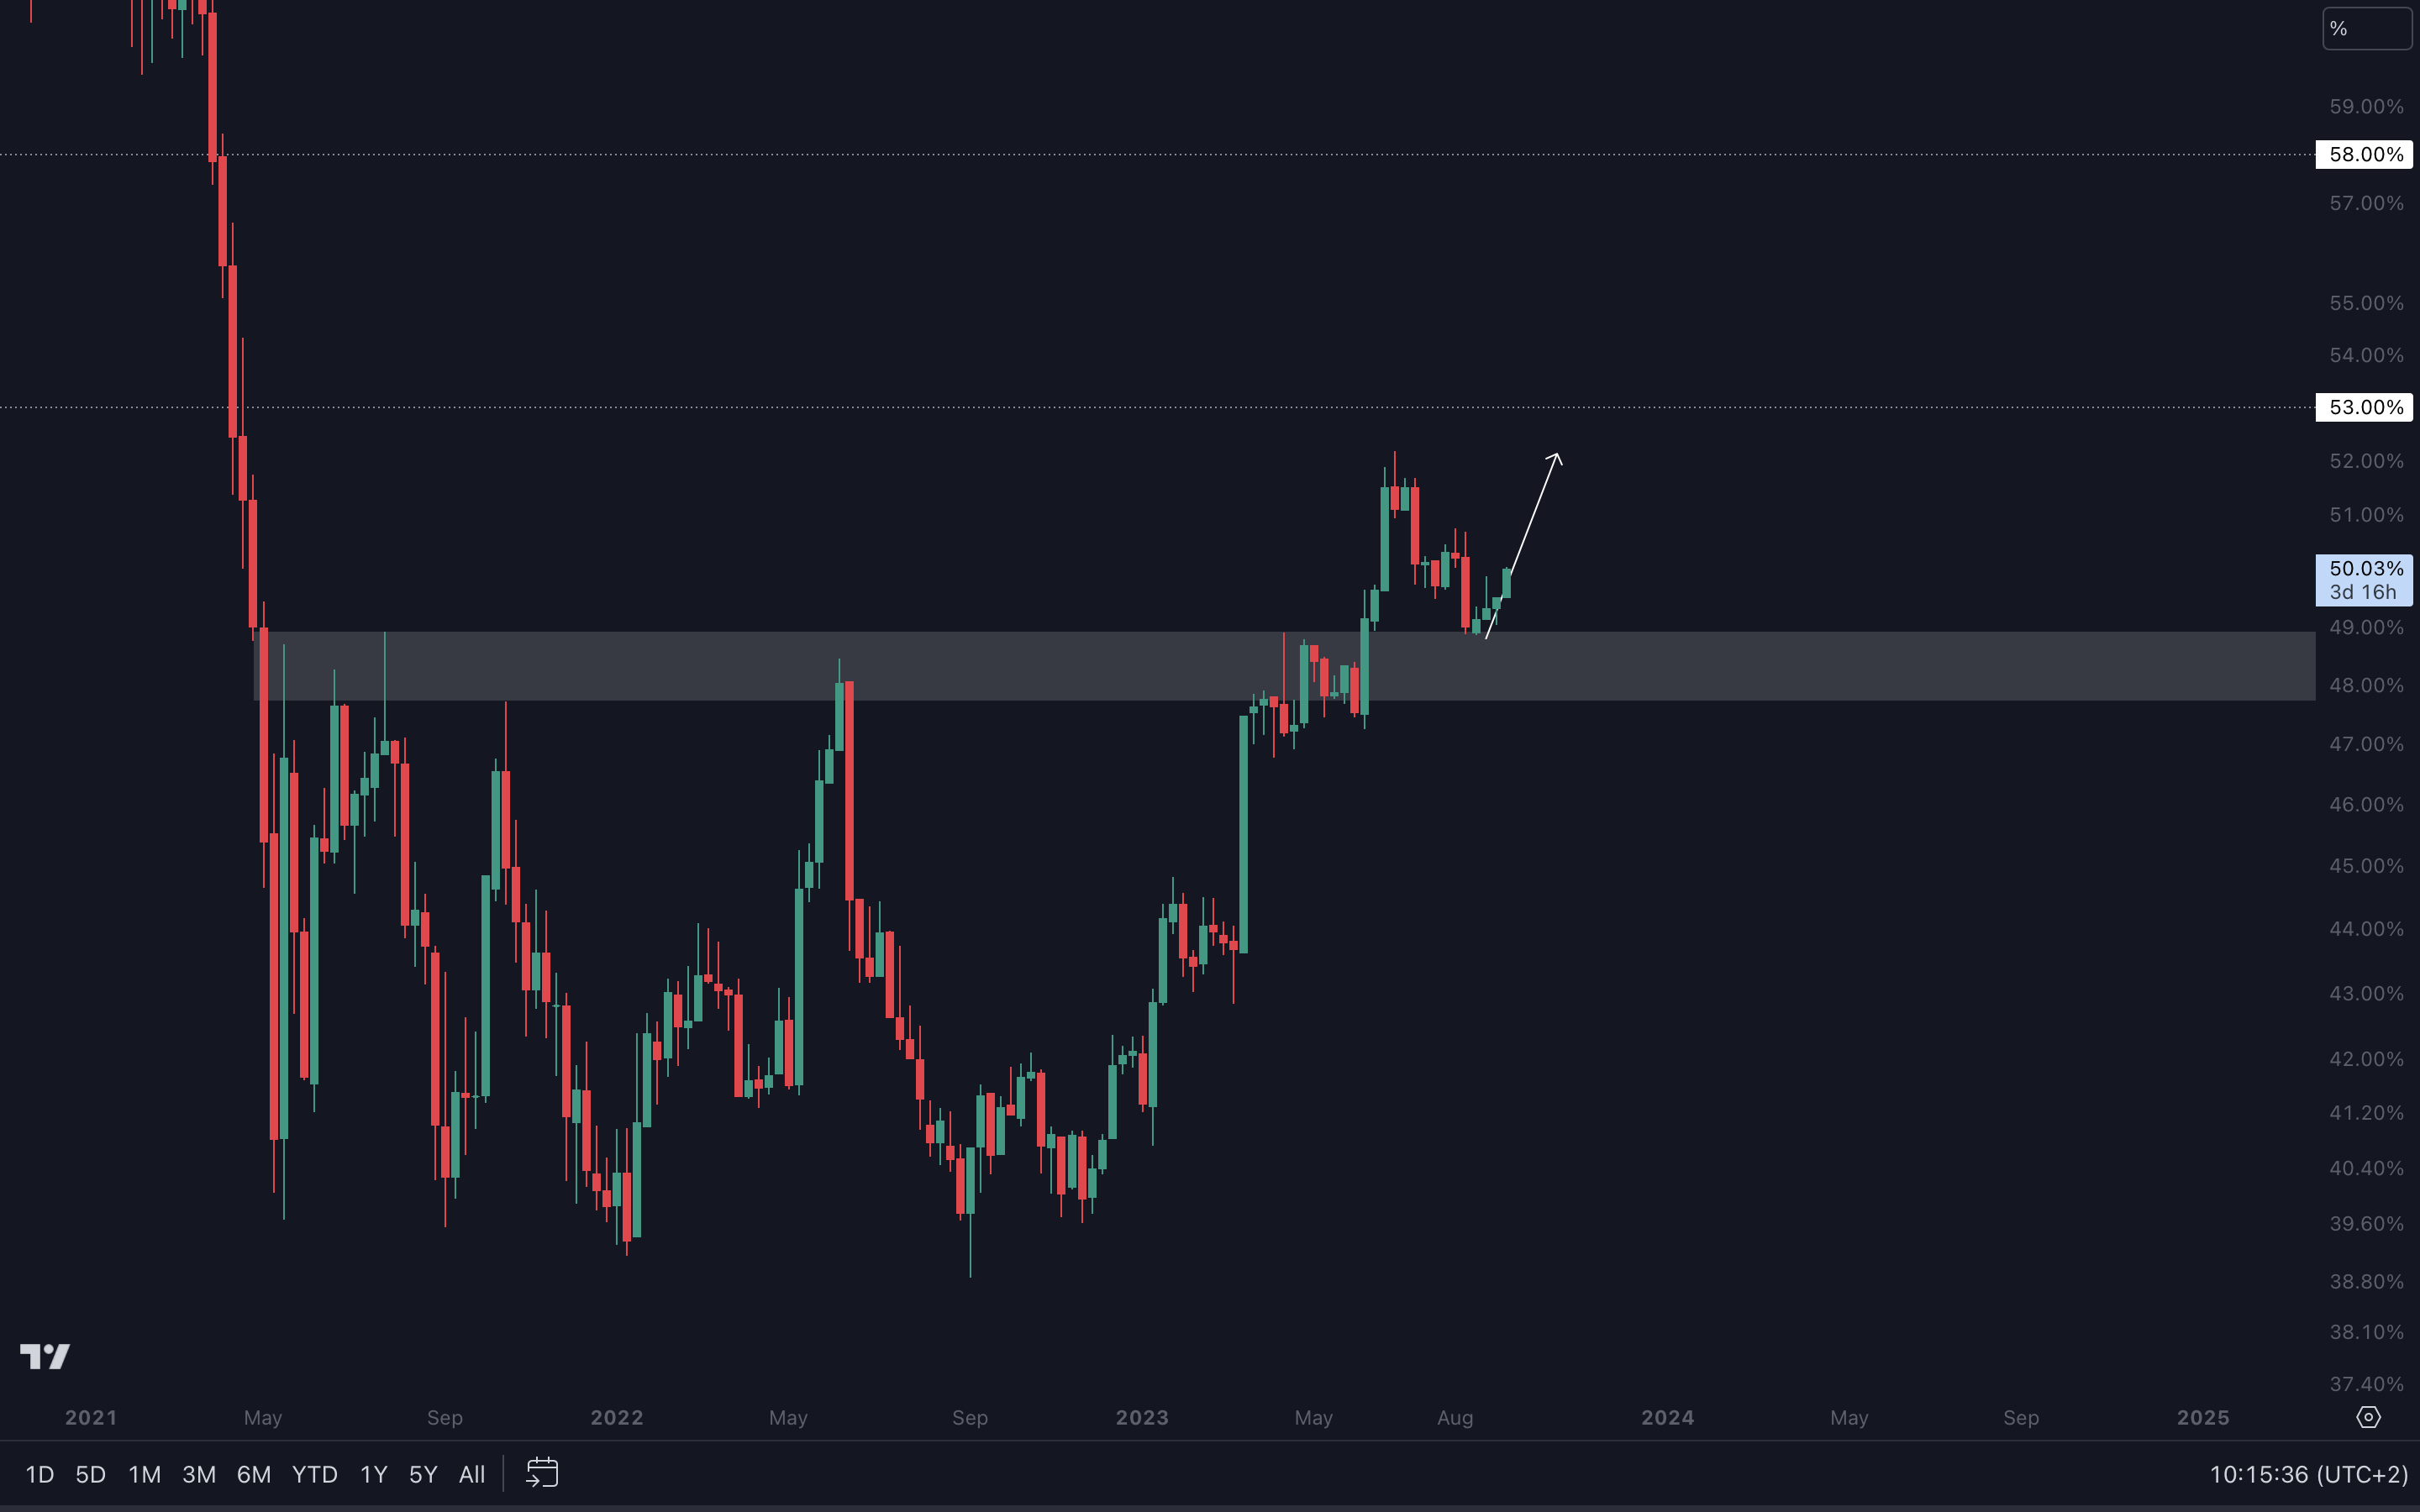
 Your best play?
Avoid heavily risking-on in altcoins, but rather investing in Bitcoin. This way, you’ll have a much better chance of actually staying profitable in what seems to be the last storm before the bull market awakens.
Cryptonary’s take 🧠
We can already feel the bulls marching toward success. With a Spot ETF on stand-by and the halving in early 2024, chances are the next months will be all about last chances. Our confidence in our thesis that Bitcoin had already bottomed at ~$15,000 in November 2022 remains extremely high. And while another crash is not impossible, we’re sure the bottom is in, and the price is now only preparing for the bull market. The time to buy is now, but we recommend a slow approach. Investing heavily into the market can result in short-term losses which could’ve been prevented. Instead, we’d rather invest periodically (i.e. dollar-cost averaging) so you can have extra capital to deploy in the case of a market crash.Action points 🎯
- The market could reverse to the upside. Take trades according to the general trend and avoid going against it (i.e. shorting in an uptrend).
- The trades we share are only ideas. Do your own analysis and research before deciding to enter, as the market could easily invalidate our setups.
- Got more questions? Hit us up on Discord in the “🌎・general” channel!
Cryptonary out!
Recommended from Cryptonary


