Save 23% ($351) & Get a Free 1-1 Call with our Team ⏰ : 0d 2h 59m 43s
Prices absolutely exploded as optimism around a Bitcoin ETF approval sent bulls into a frenzy.
But after such a parabolic surge, we have to take a step back and pragmatically assess where things stand.
Is this rally built on solid ground, or is irrational exuberance sending us into overbought territory?
Let's dive into the key factors at play.
TLDR
- Bitcoin gained 30% in the past week on ETF approval hopes, sending prices to overbought levels.
- Long-term indicators still suggest Bitcoin is undervalued relative to the next bull cycle.
- Short-term pullback is likely as prices correct from the overheated rally.
- Exercise caution in the near term, but the long-term outlook remains bullish.
- Consider increasing Bitcoin allocation at lower levels if a pullback occurs.
Disclaimer: Not financial or investment advice. Any capital-related decisions you make are your full responsibility.
What happened yesterday? And what do we expect going forward?
Yesterday, TradeFi were buying Bitcoin in anticipation of imminent Bitcoin ETF approvals. This saw $43m of inflows into public funds, where the year-to-date total inflows were $430m. So, yesterday, we saw 10% of the year-to-date inflows into public funds in a single day.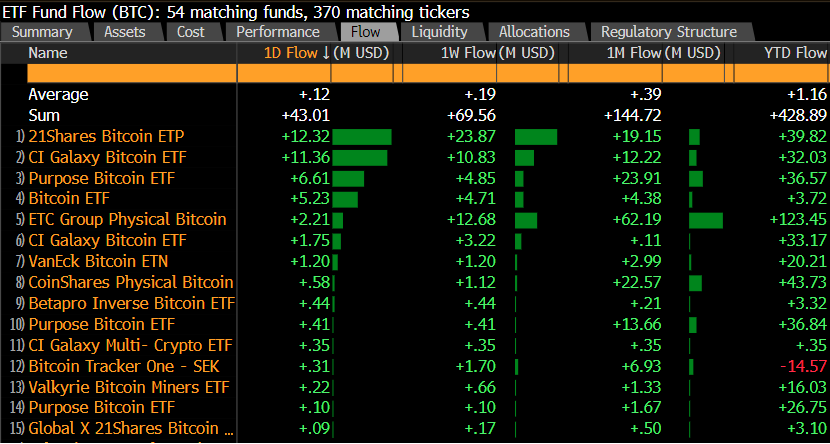
Later in the day (yesterday), the iShares Bitcoin Trust IBTC was listed on the DTCC website - this is usually a positive sign that the ETF is to be imminently approved. However, this has since been removed. Bitcoin was priced at $34,500, but since the removal from the DTCC website, Bitcoin is down to $33,400.
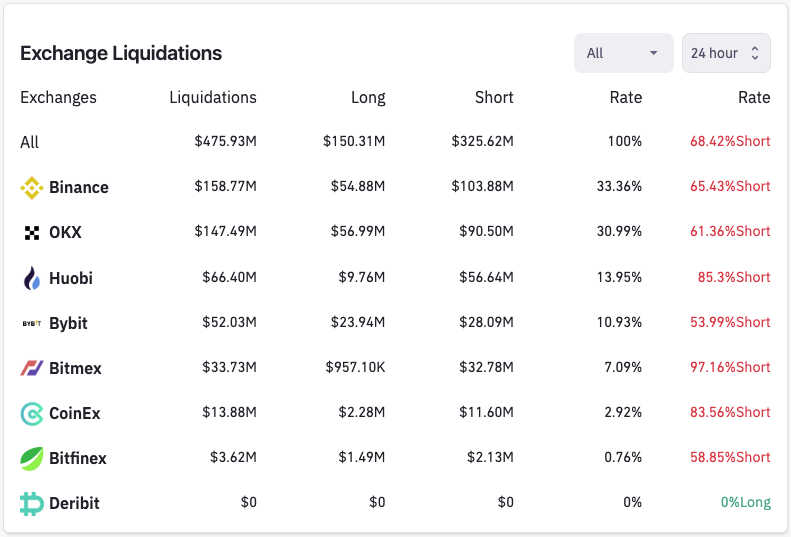
When price moved yesterday, it was bought up by TradeFi, which saw price push into $31,300 - a major horizontal resistance. Then the iShares Bitcoin Trust IBTC was listed on the DTCC website, buyers fomo’d in, and this catalysed a short-squeeze, pushing price well beyond $31,300. We can see below that the shorts were decimated.
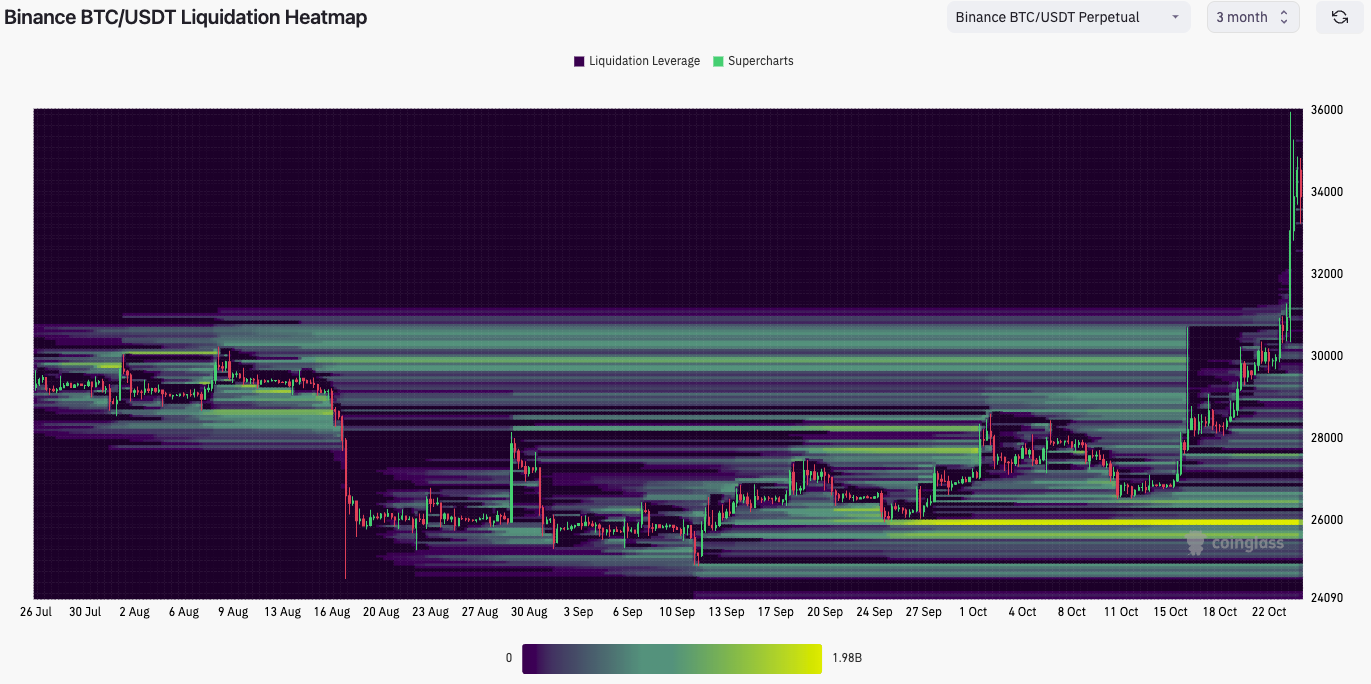
The liquidation heatmap shows that most shorts (and their liquidation levels) were taken out. We now see very thin liquidation levels for Shorts, showing that there are very few shorts for now. The largest liquidation levels now (by USD) are in the $26,000 region - this would be longs being liquidated.
What next for markets?
The last few days have shown us that a Bitcoin Spot ETF is likely very close and is a matter of time before being approved.Bitcoin has recently become less correlated to the S&P, and it has become more correlated to GOLD. This is a move AWAY from trading similarly to risk assets and a move TOWARDS trading like a safe haven asset. In a world where we’re seeing increasing regional conflict, recessionary risks and the potential for inflation to rear up again (although very unlikely to retest prior highs in the US), this is a negative environment for risk assets. So, this is a good time for Bitcoin to transition away from trading like a risk asset and trading more like a safe haven asset.
In the environment outlined above, this should be supportive for GOLD and Bitcoin, meaning that in the medium term - assuming it continues to trade like a safe haven asset, Bitcoin can continue higher even if there is a slight pullback in the very short term.
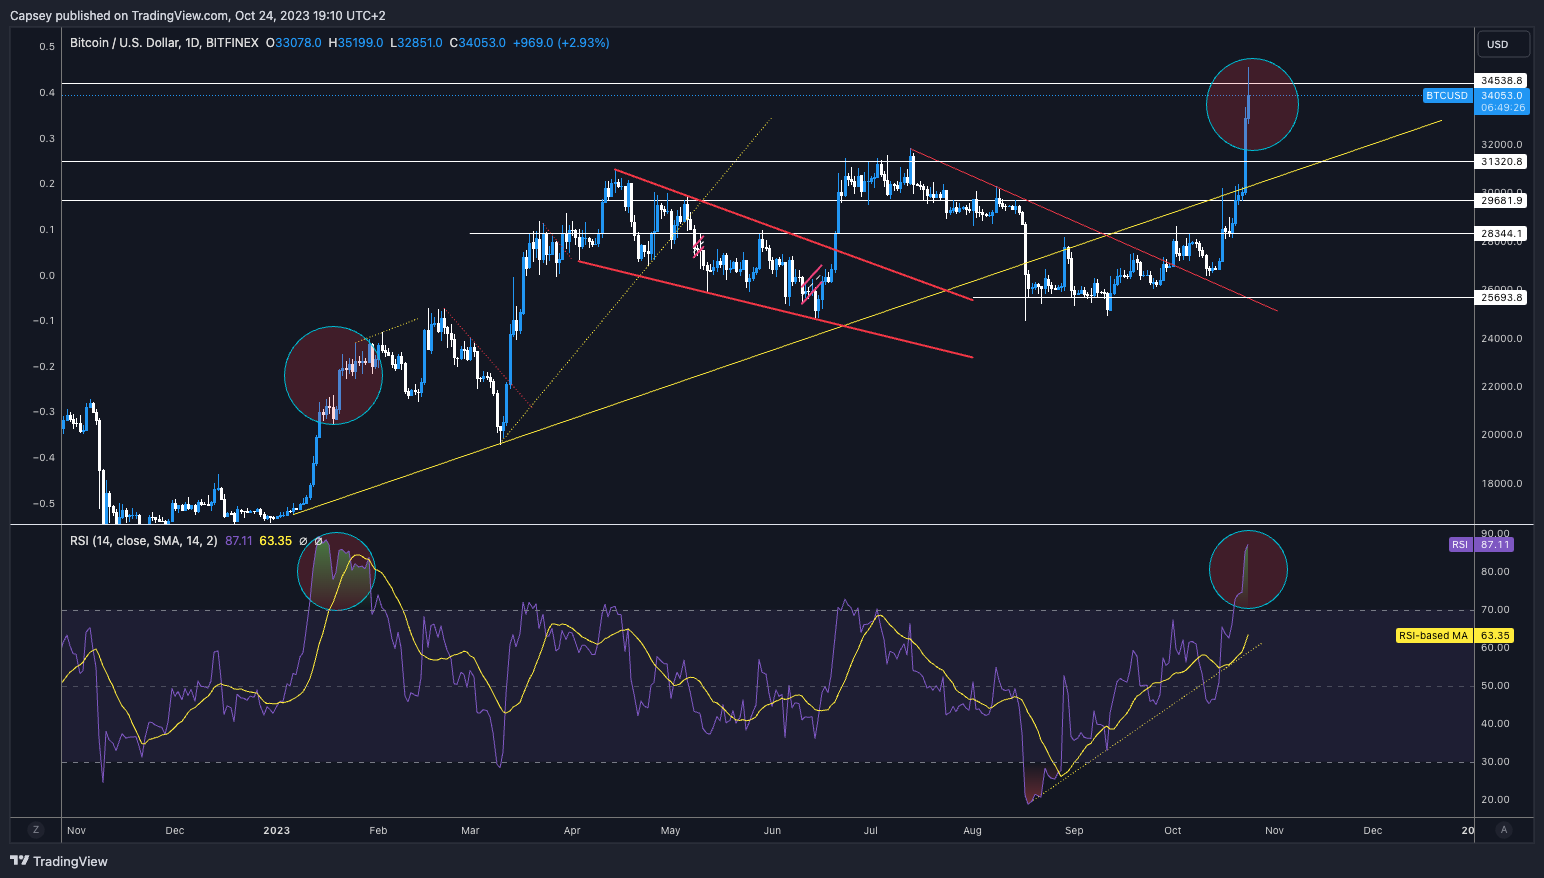
A pullback in the short-term may be due to Bitcoin being very overbought, levels last seen in January 2023. We can see this from the turquoise bubbles in the chart below.
Is Bitcoin a good buy at current prices? - $34,000
Yes, but it depends on what type of market participant you are. For instance, we expect that the bull market will be in the second half of 2024 and will finish sometime in 2025, where we expect Bitcoin’s price to reach the $100,000 to $150,000 area. That would be at least a 3x multiple on your investment from the current price. However, because Bitcoin is overbought on trading indicators, we may see a price pullback in the short term. Looking at on-chain data indicators gives us further insight into where we are in terms of the overall cycle. The MVRV Z-Score evaluates whether Bitcoin is undervalued or overvalued relative to its fair value. In the below, we can see how low this metric is and how early we are in terms of the next bull run.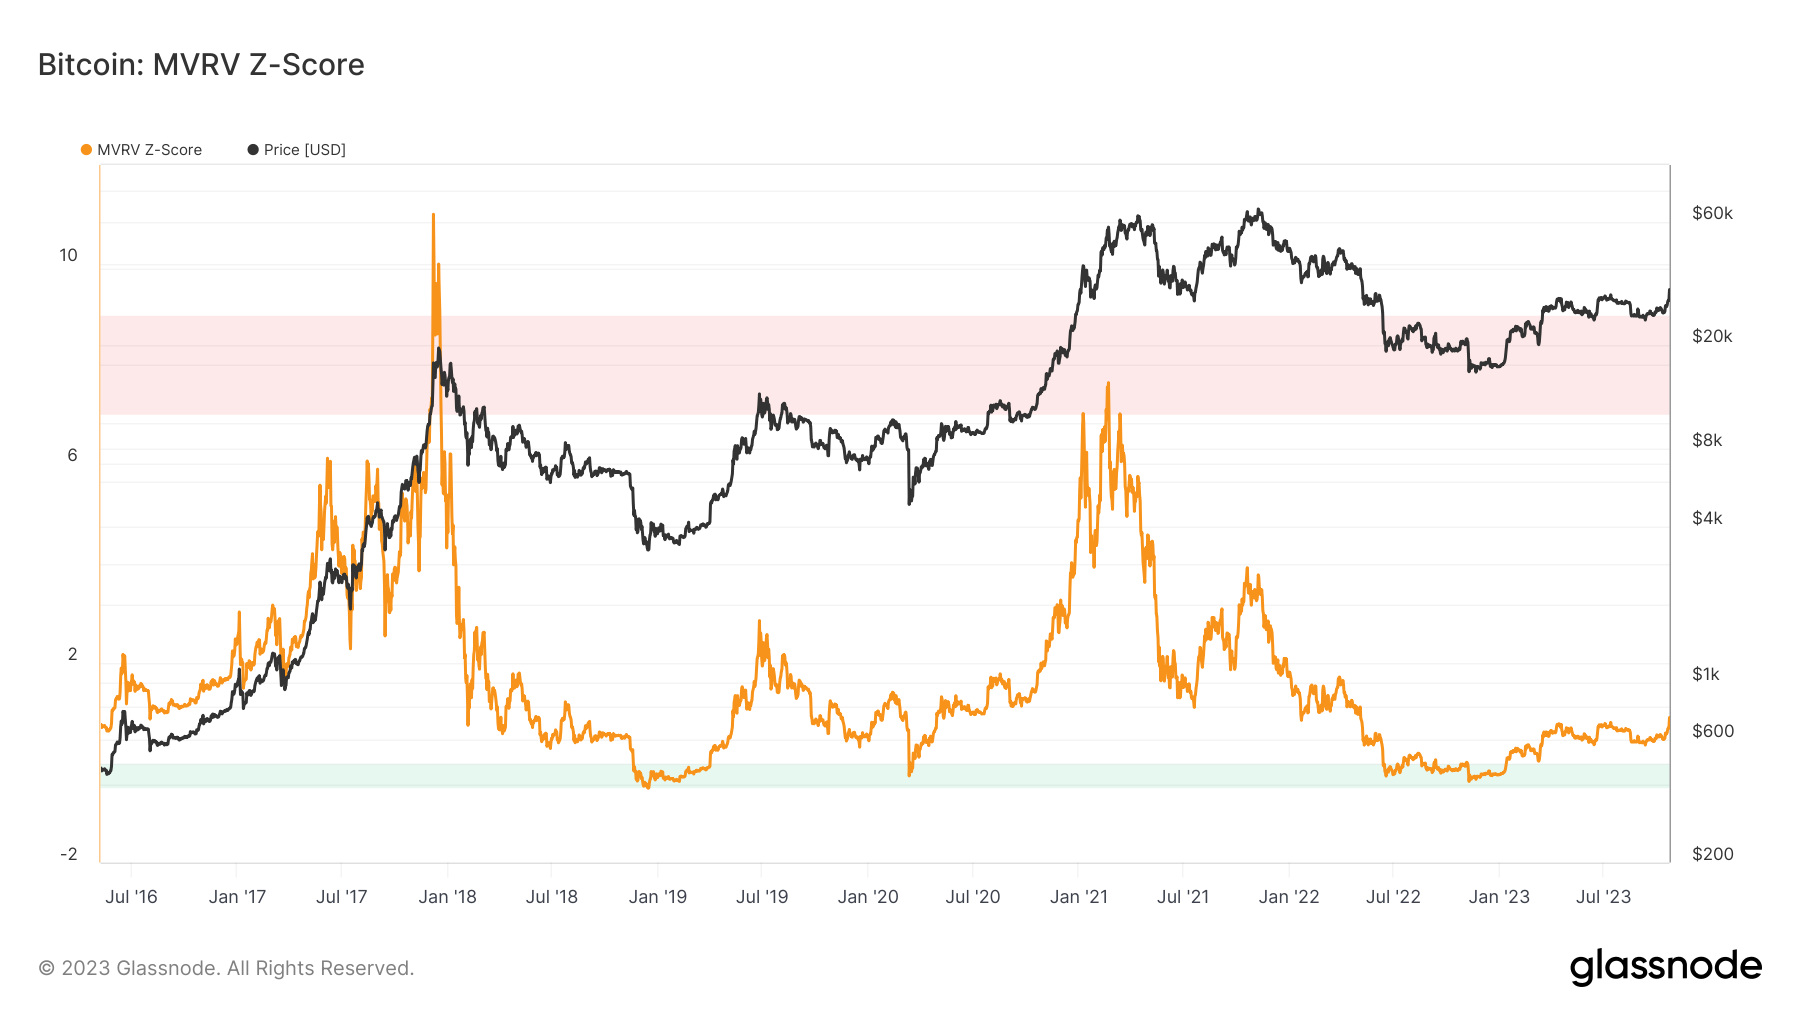
The above suggests that despite price going up nearly 30% in the past week, Bitcoin is still relatively cheap and close to the undervalued zone (green zone).
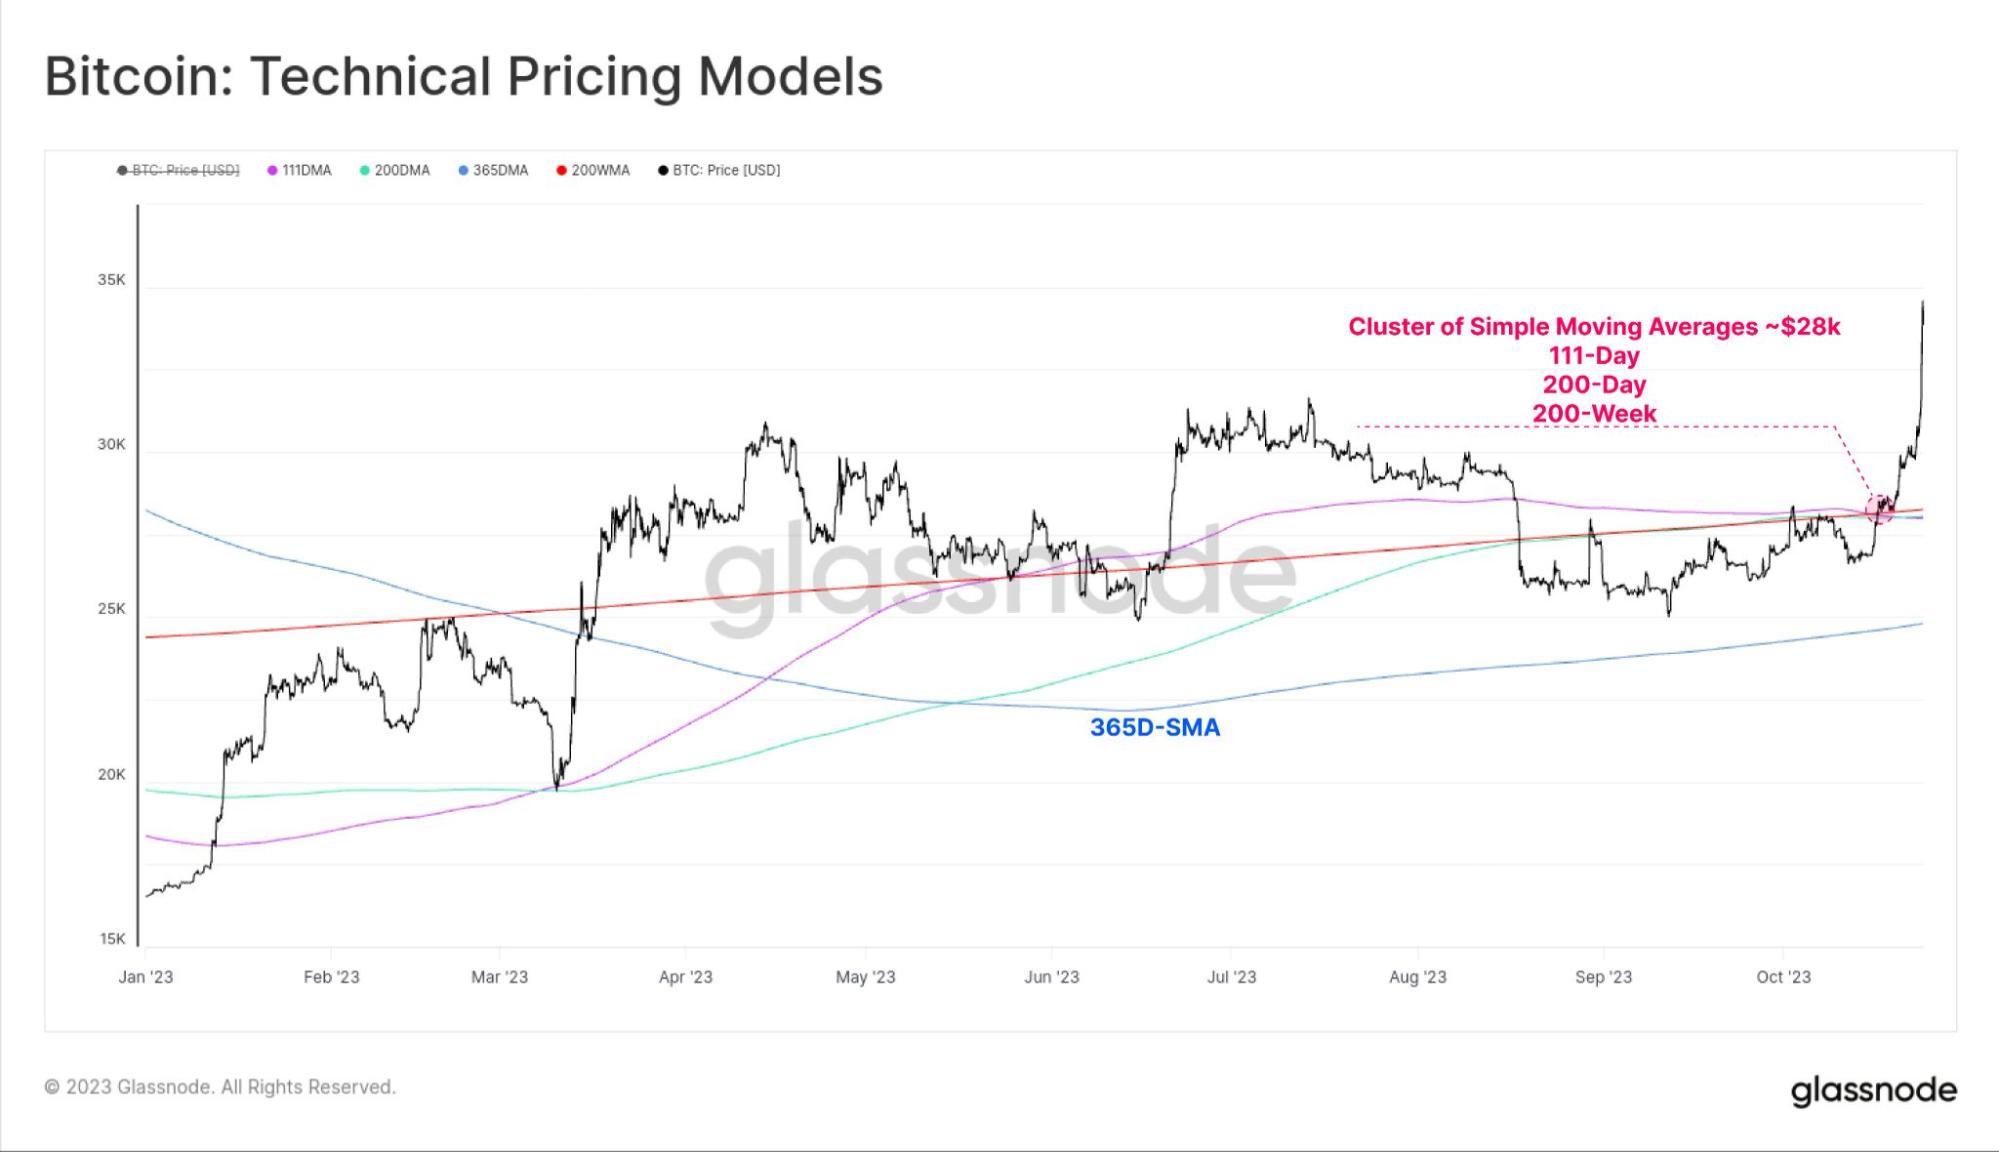
If we then look at a more zoomed-in timeframe, we can see that Bitcoin has moved back above its 111-day, 200-day, and 200-week moving averages. These had acted as prior levels of support or resistance.
 Conclusion
With a zoomed-in lens, Bitcoin is up 30% in the past week and is overbought on many technical trading indicators. This could mean that buyers are less willing to enter in the very short term, and price makes a more meaningful pullback where we expect the prior resistance level of $31,300 to act as new support on a local timeframe.
However, if you look at Bitcoin with a long-term view, is it still relatively undervalued? Yes. And, even at today’s price ($34,000), a multiple of 3x may be achievable between now and the bull run. So, the question you’d have to ask yourself is this: am I a passive investor or an active willing to look for swing trading opportunities?
If you’re more passive and have a long-term perspective, today’s price is still relatively cheap. But if you’re looking for more optimal entries, it may be worth waiting to see if Bitcoin can retest at a slightly lower level. We would suggest that with the ETF’s possible imminent approval, along with the next Bitcoin halving in April of next year, investors should consider increasing their allocations to Bitcoin in the coming weeks and months.
As always, thanks for reading.
Cryptonary, OUT!
Recommended from Cryptonary


