Save 23% ($351) & Get a Free 1-1 Call with our Team ⏰ : 0d 2h 59m 43s

I (Tom) am sensing some weakness in the market. However, I want to assess what is generating this weakness, how big a driver it is, and how long I expect the weakness to stay.
The goal is to determine whether we are seeing a short—or long-term weakness and how I am positioning myself based on all the above.
TLDR
- Bitcoin has been range-bound between $57,000 and $66,000, exhibiting weakness that needs assessment.
- Crypto markets are watching Fed speeches and bond auctions for hawkish/dovish signals that could impact prices.
- Bitcoin ETF inflows have been choppy recently, but we expect them to surge in Q3 once big providers start marketing their products.
- On-chain data suggests Bitcoin is mid-cycle, hodlers are accumulating and reduced miner selling pressure.
- We expect the mid-cycle period to last for the next 1 to 2 months before a potential breakout above $68,900
- Portfolio positioning favours the "barbell" of BTC, ETH, and SOL and some select meme coins to manage safety and risk.
Disclaimer: This is not financial or investment advice. You are responsible for any capital-related decisions you make, and only you are accountable for the results. "One Glance" by Cryptonary sometimes uses the RR trading tool to help you quickly understand our analysis. These are not signals, and they are not financial advice.
This week's Fed-speak and bond auctions
Coming into this week, the markets will be looking to see if the Fed speakers will reiterate or continue to tow the dovish line like Fed Chair J Powell did last week. Yesterday, both Barkin and Williams spoke, and they spoke with a dovish lean.For now, markets won't react too much to this, but they will if a voting Fed member (or several members) speaks in a much more hawkish tone.
Secondly, this week, we have a number of bond auctions. As we know, over the coming two quarters, there is a lot of issuance for the bond market to stomach. However, the auctions went well yesterday, although 3-Y Notes traded with a higher yield following the auction.
Again, markets will be watching this, but concern will only become more palpable once some of these auctions begin more dramatically tailing.
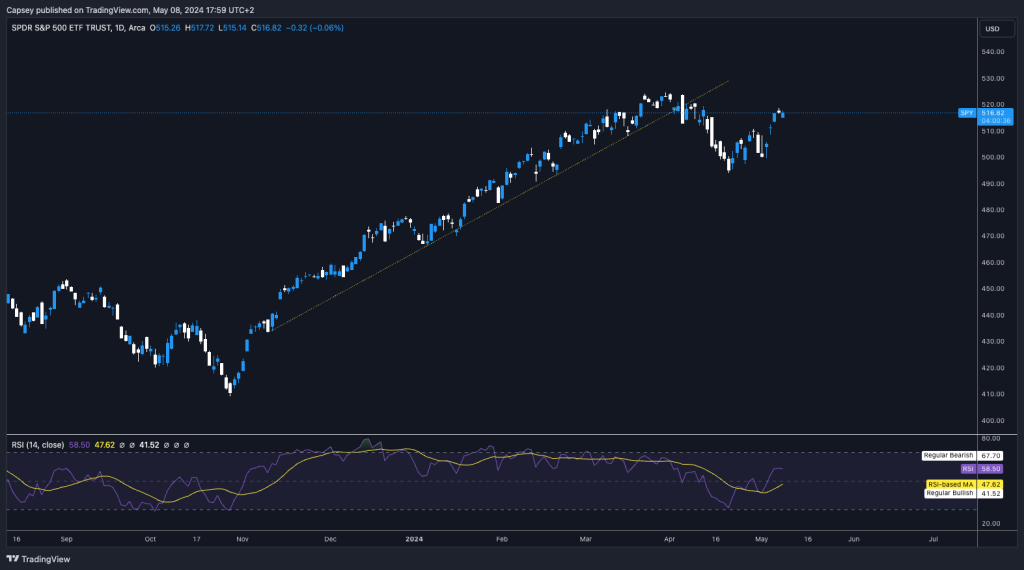
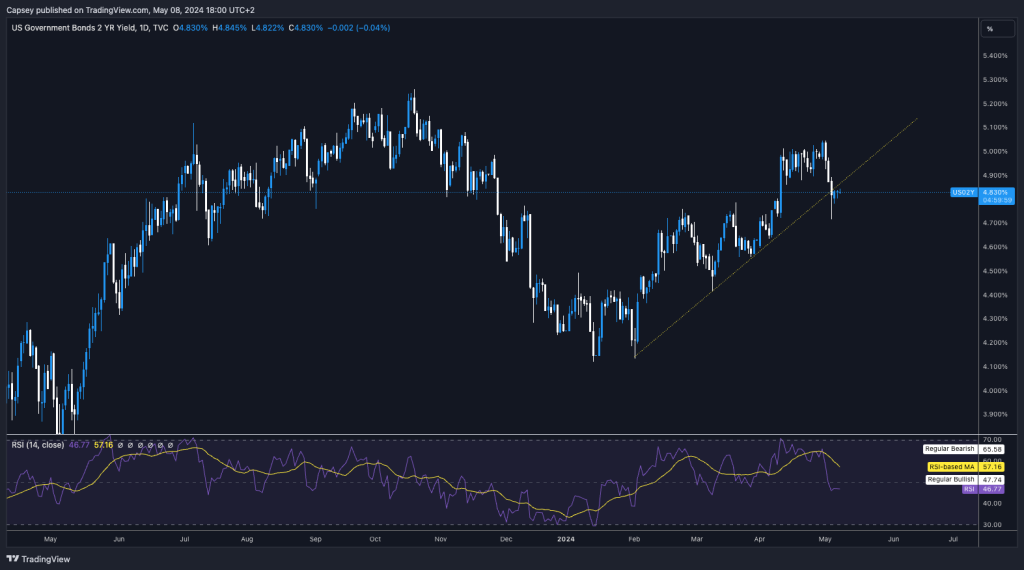
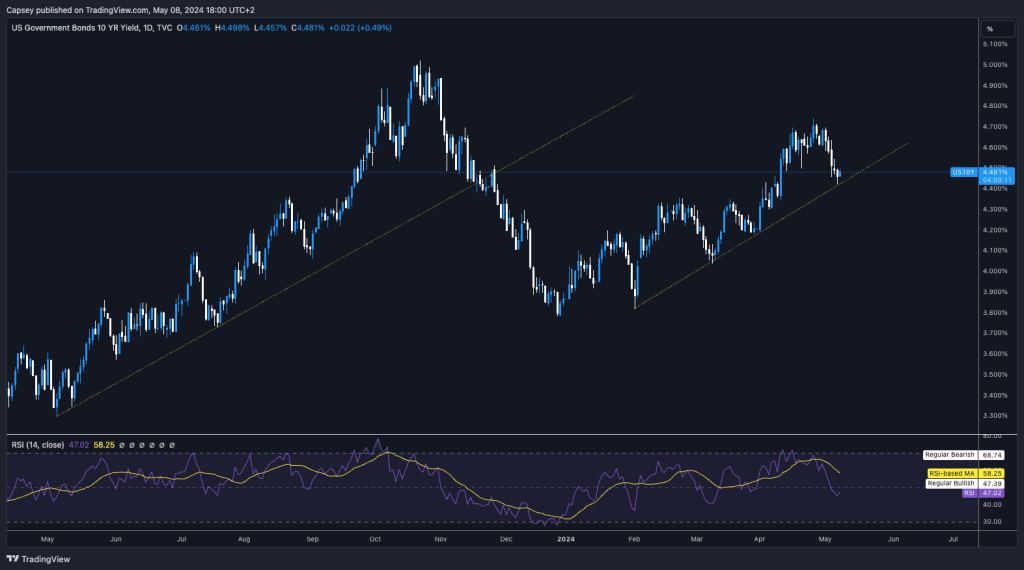
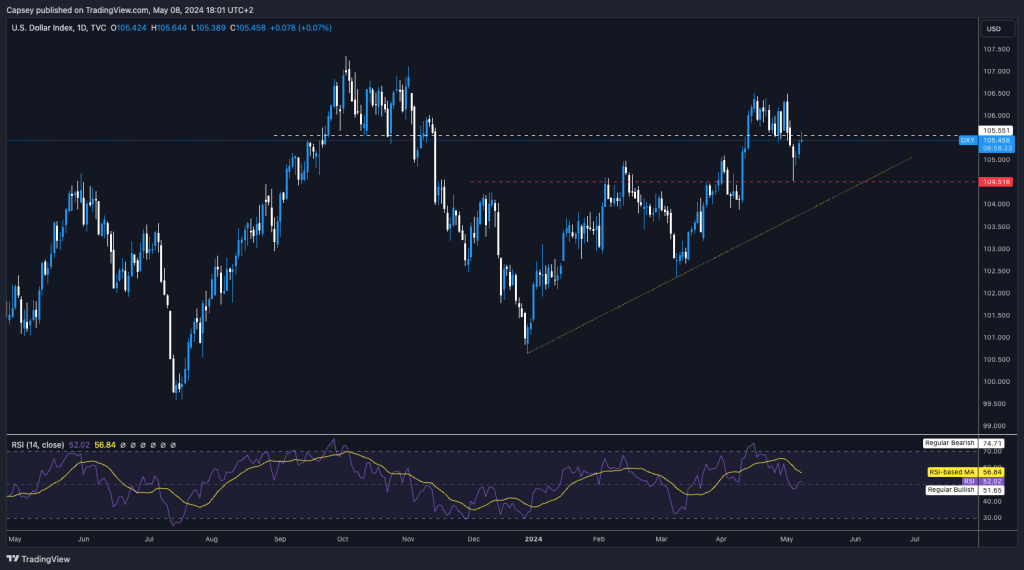
Following the above and Powell's dovish lean at last week's Fed meeting and press conference, we've seen the S&P go higher, yields, and the Dollar Index (DXY) go lower, yet crypto is essentially at similar prices despite getting a big initial bid.
$SPX 1D Chart
2Y Bond Yield
10Y Bond Yield
$DXY 1D Chart
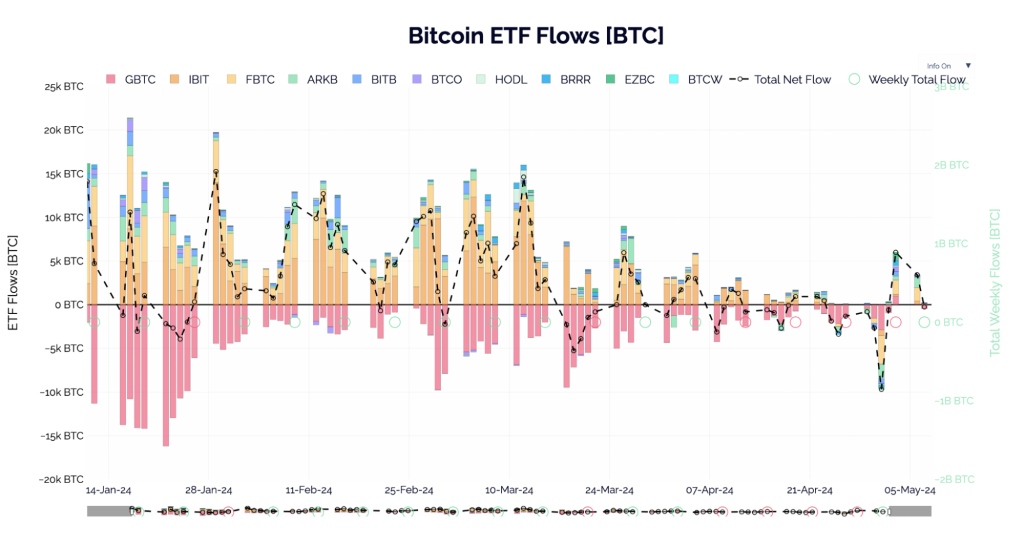
ETF data
For the last month or so, we have seen a slightly stronger net outflow from the ETFs, having seen a really strong inflow (buying) from mid-January to mid-March.In the last week or so, we've had very peculiar flows, with some days seeing large inflows and others with large outflows.
We even had Grayscale have a large inflow last Friday and this prior Monday, having previously been the largest contributor to the sell side in the first few months of the ETF's introduction.
Seeing more substantial inflows into these ETFs may take another month or two. This will likely happen in July when Blackrock, Fidelity, etc., start pushing/advertising their ETFs more. However, this may mean some more chop in the coming month or two.
On-chain data
Firstly, this cycle is unique in that Bitcoin has reached an all-time high price before the Bitcoin halving. In prior cycles, price highs have always come 6-9 months post-halving as there is a supply squeeze. This year is also an election year, which has historically been very positive for risk assets. This means we have a bullish bias going into the next 6 to 12 months.Firstly, we'll look at prior cycles in terms of their length and the drawdowns from the all-time highs that Bitcoin experiences and then compare that to this current cycle to assess how normal or irregular these current drawdowns are.
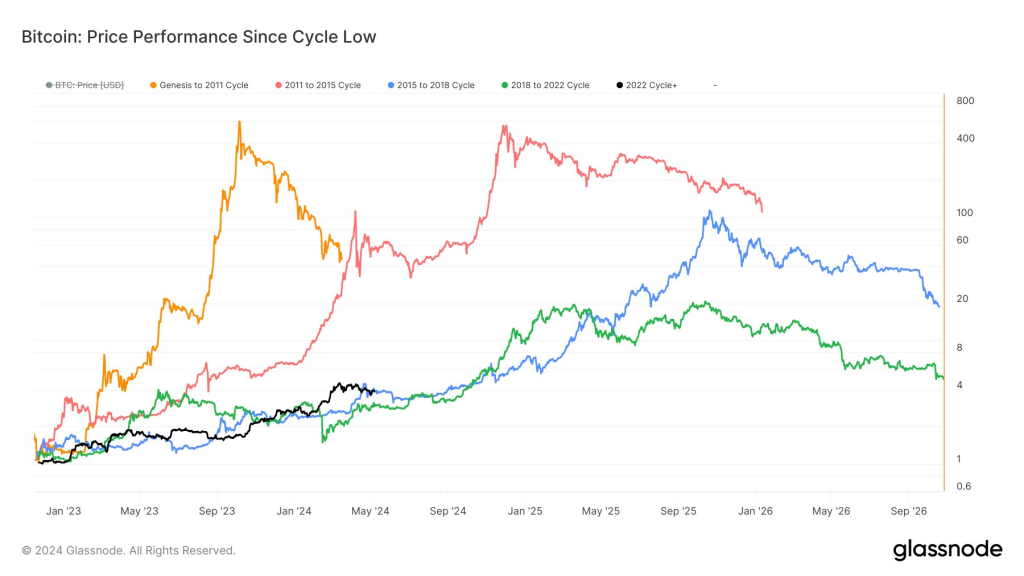
Timeline for prior cycles
When we look at prior cycles, they're substantially longer than the current one, and it would be irregular for the current cycle to have peaked at the recent high of $73k.Bitcoin's price is currently up just shy of 300% since the cycle lows in late 2022. This echoes prior cycles, which have seen Bitcoin put in substantial multiples from this current point of the cycle.
Drawbacks
We have covered this in recent updates. But, this most recent Bitcoin price pullback from $73k to the local lows of $57k is, in fact, very normal and less of a percent drawdown than what we have seen in prior cycles.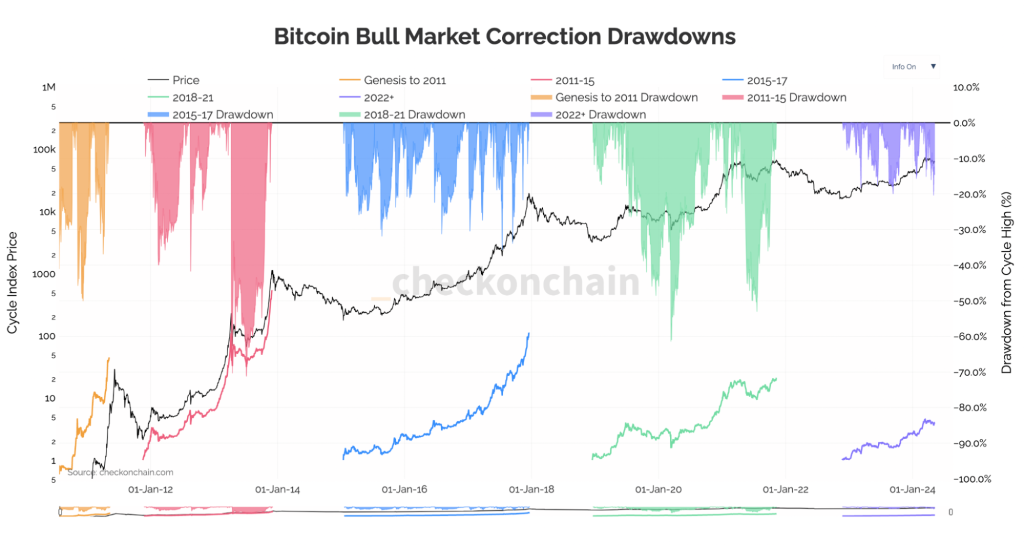
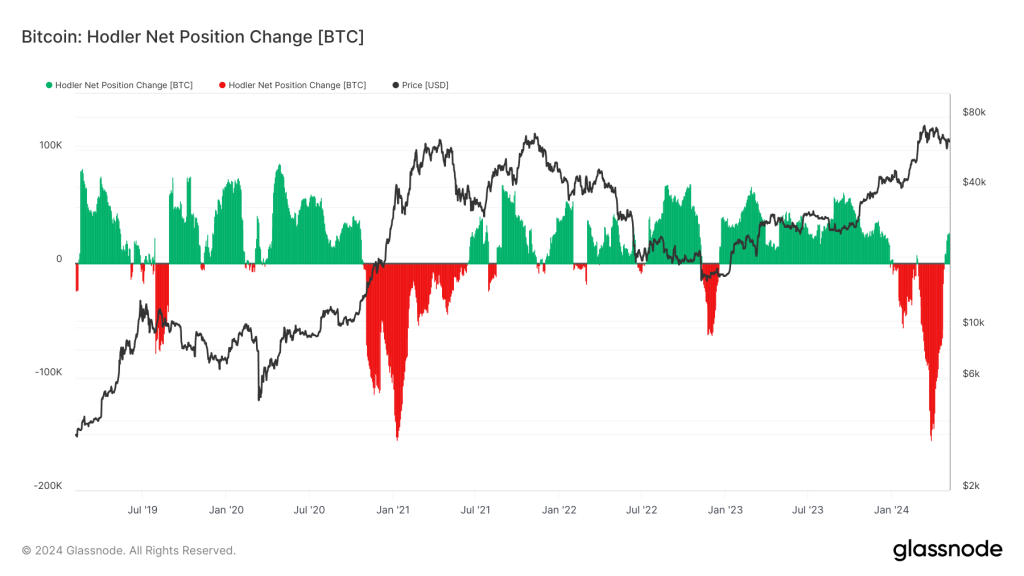
Holder net position change
The Hodler net position change shows that coins were distributed (sold) at a price high north of $70k. This is demonstrated by the large downside red spikes on this metric, indicating a negative BTC position change.However, this metric has now turned positive (green) again, indicating that hodlers are holding and accumulating more coins rather than distributing (selling) them.
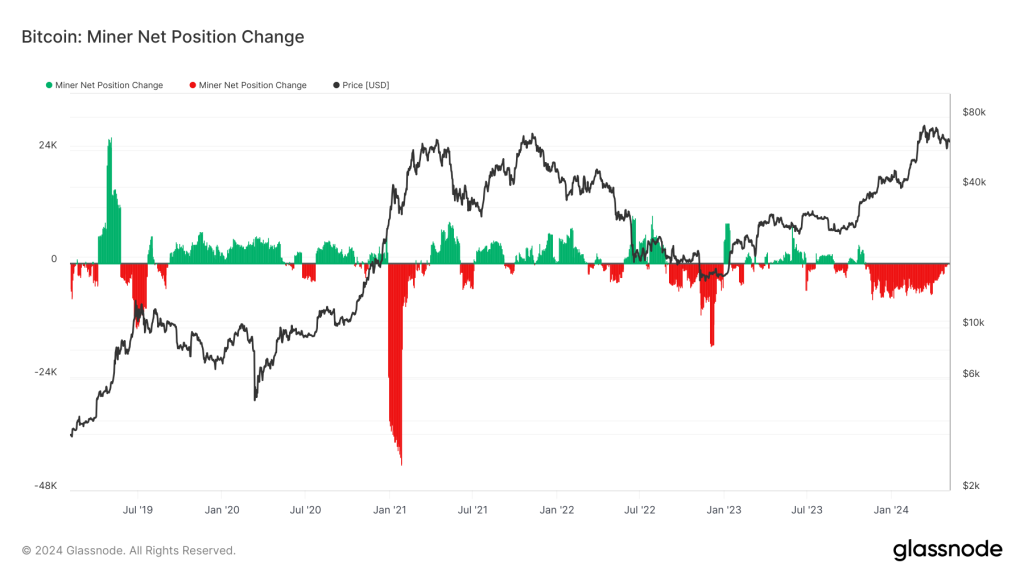
Miner net position change
After the BTC halving, we usually see inefficient miners adding to sell pressure. In the price move up from $36k to $73k, Miners were distributing (selling) coins. This is shown by the red in the chart on the far right-hand side.However, we can now see that that's decreasing, indicating reduced sell pressure, with this metric actually turning positive/holding/accumulating coins (green). This turnaround suggests that miners expect higher prices in the coming quarters and are less willing to part with their coins at today's prices.
MVRV Z-score
This is one of the key metrics we use to assess whether Bitcoin is under or overvalued. This metric currently shows that Bitcoin is in a mid-cycle range, while this metric has also reset substantially on the 20% pullback in Bitcoin's price that we have seen recently.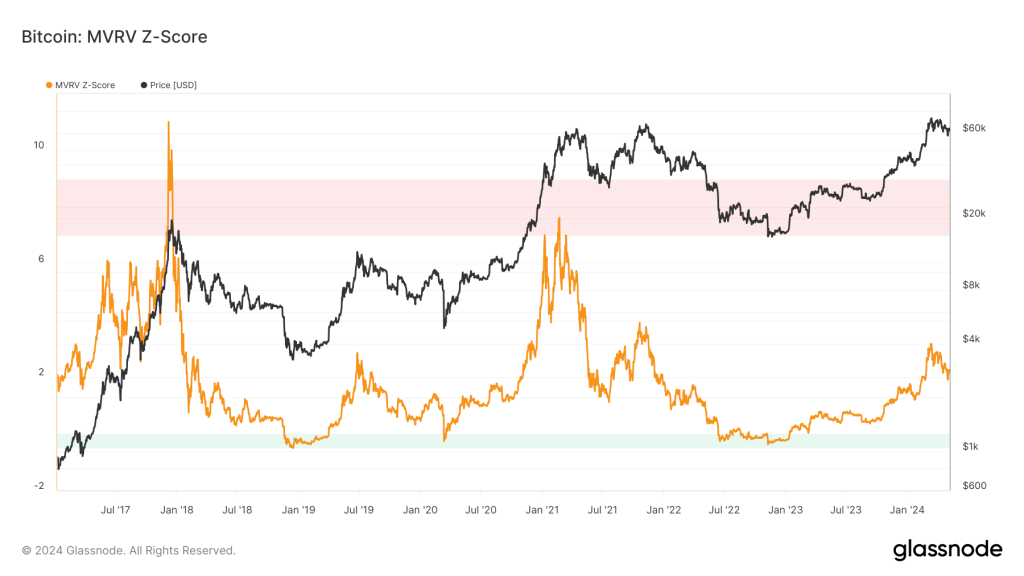
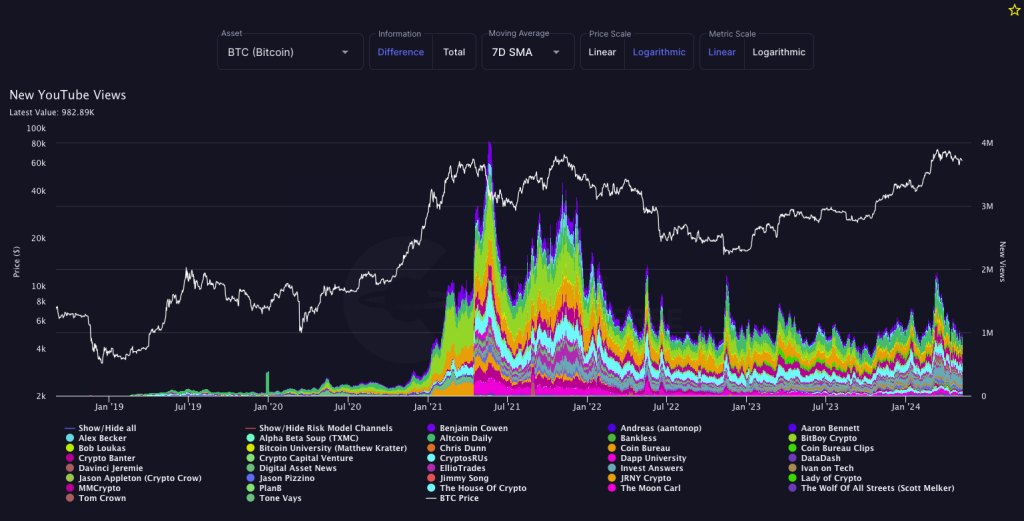
YouTube views
Lastly, we'll look at YouTube views.We can see that in this metric, the number of YouTube views of the top crypto YouTube channels is now back to bear market levels.
It did spike up slightly, but not to a level that would indicate that retail has come back and been flushed out. We've had some come back, but we certainly haven't seen retail flood back in their droves.
Cryptonary's take
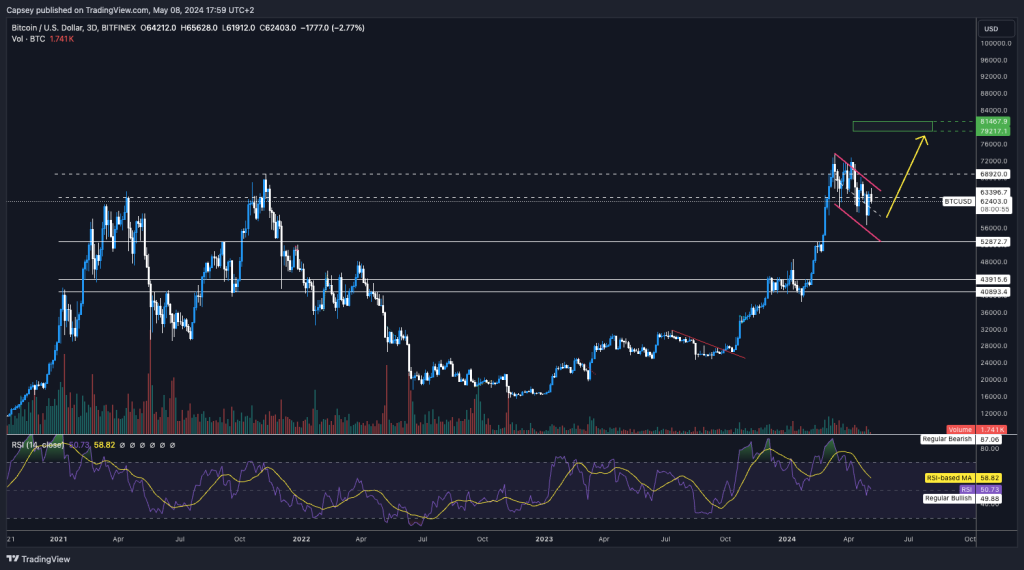
Assessing all the above suggests that we're currently mid-cycle and that there may be another month or two of chop for prices.In this period, prices will likely remain range-bound between the lows of $56k and $57k and the highs, which will likely be the top border of the Bitcoin bull flag. Beyond that, price will see a more substantial breakout at the $68,900 level.
Even though we expect more subdued/range-bound price action over the next month or so, we believe we'll see growing demand for Bitcoin ETFs from Q3. This will also pair up with what's likely to be improved liquidity conditions going into Q3 and Q4 ahead of the US Presidential Elections in November. This setup should be very positive for Bitcoin and the rest of crypto.
BTC 3D Chart
Action plan
How to position your portfolio.If we expect range-bound price action over the coming month or two, we would expect majors to perform ok and hold up the best to the downside.
We'd expect alts to underperform on the upside (if prices go higher) and to bleed more on the downside if prices go lower.
Memes? We'd expect them to also bleed to the downside but to drastically outperform to the upside if the general market price sees an uptrend. Therefore, we prefer, for now, to stick with the barbell portfolio. This is an allocation to Majors and Core Memes:
This portfolio provides a nice balance: We won't suffer so badly when prices go down, and we also get outperformance on the upside by holding relatively large meme positions.
Therefore, this enables us to participate in the most risk on a subset of the market whilst also providing some protection to the downside. If/when the market turns full bull mode, that's when we'd look to divest out of some BTC and ETH and rotate that capital into alts, but we don't expect we'll do this until Q3.
Let's go!!!!!
Recommended from Cryptonary


