Save 23% ($351) & Get a Free 1-1 Call with our Team ⏰ : 0d 2h 59m 44s
Market Direction

Bitcoin is battling resistance at $63,400, Ethereum is holding support at $2,557, and Solana is testing its downtrend line, while meme coins like WIF and POPCAT are making notable moves. Understanding these dynamics can help you stay ahead of the curve and make you money.
Let's break down the technical analysis and dive into what's next for these assets!
Disclaimer: This is not financial or investment advice. You are responsible for any capital-related decisions you make, and only you are accountable for the results.
BTC:
- Overall, Open Interest has remained relatively unchanged over the last few days, although the Funding Rate has come down slightly.
- There isn't enough of a change in OI and Funding for it to affect our trading outlook over the coming 2-5 days.
- On local timeframes, there were some Shorts that went on at $64k, which brought the Funding Rate down slightly.
Technical analysis
- Bitcoin has battled now at the horizontal resistance of $63,400 for a number of days, with large wicks on either side of $63,400.
- BTC has broken out of the downtrend line, and now, at the local resistance of $63,400, it wouldn't be surprising to see a slight pullback to possibly the Yellow box (between $60,200 and $61,700).
- If BTC can break above $63,400, then $65,000 is likely to be the stopping point as this is where Ask liquidity has built up in the orderbooks.
- The RSI is at 62, so there's room to go higher, but it is relatively close to overbought territory.

Cryptonary's take
The market has performed well over the last few weeks, so we are open to the idea that the price can pull back to and consolidate at the $61k to $62k level. We're expecting more subdued price action from BTC, at least over the next few days. It's likely price remains in a tight range between $60,200 and $65,000. We're, therefore, not looking to be too active here, and we're looking to sit tight whilst BTC potentially has a few days of just consolidating. Nothing is too exciting here, but it is appropriate following a 19% price increase of the September 6th lows.ETH:
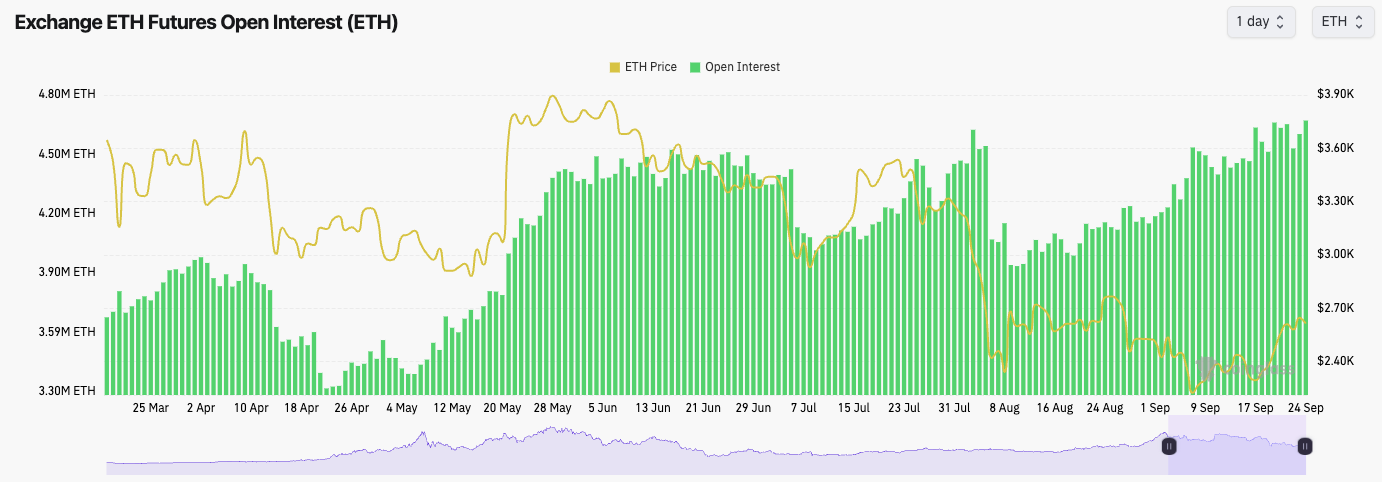
- ETH's Open Interest continues to grind higher, whilst Funding remains relatively positive, indicating that there is a slight bias amongst traders to be Long.
Continues the grind higher.
Technical analysis
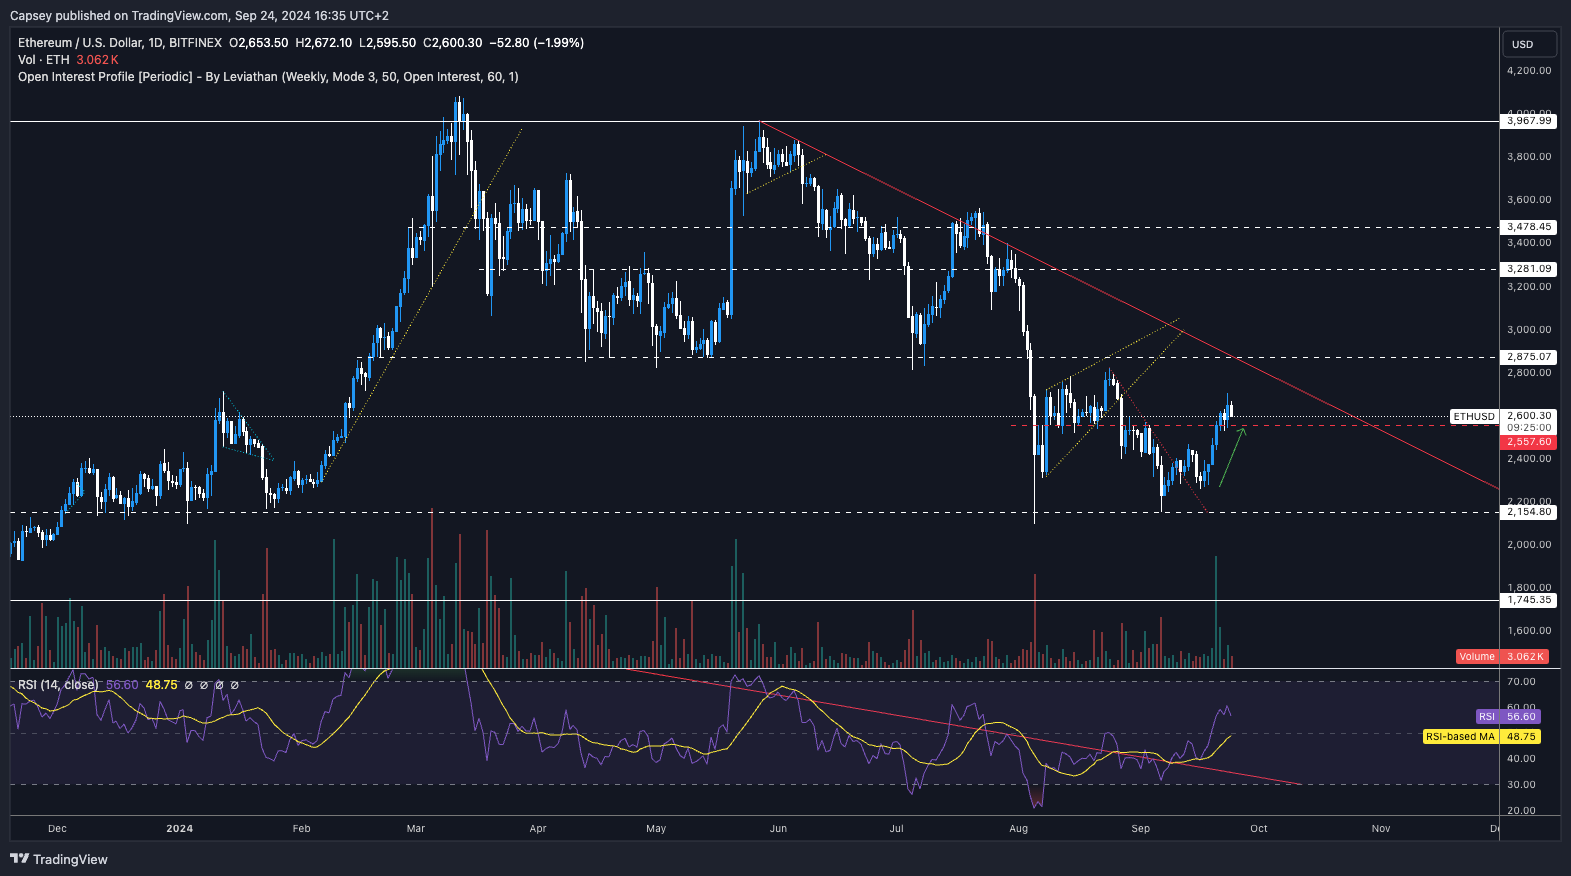
- We thought that the price might not have enough strength to get beyond the local resistance of $2,557, but the price was able to get a clean break above - positive.
- We're now looking for a price to pull back slightly and use the $2,557 horizontal level as new support. If there is a price deviation below, this is fine, assuming it's quickly recovered.
- ETH is still in a longer-term downtrend beyond this local move. A breakout of the downtrend line (red line) and the horizontal resistance of $2,875 would likely bring the full bull reversal. This may take more weeks.
- On the downside, the major support remains at the $2,150 level.
- The RSI is at 56, so it is middle territory. We don't take much of a signal from this here.
- On the 3D RSI, we have had a clean breakout of the downtrend line, so this should be positive for the price going into the next few weeks.
Cryptonary's take
Like Bitcoin, ETH probably needs a 3-5 day period where price pulls back a tad and consolidates, as this might then fuel a healthy, next leg higher. We're looking for ETH to hold above $2,557, but if the price does fall below, we'd be looking for a quick recovery. If there is no quick recovery upon the price falling below, that would concern us in the short term. We're looking for ETH to consolidate here over the coming days and use the $2,557 horizontal level as a support base to move higher over the coming 1-2 weeks, with the price eventually being able to break out of the main downtrend line and retest the major horizontal resistance at $2,875.SOL:
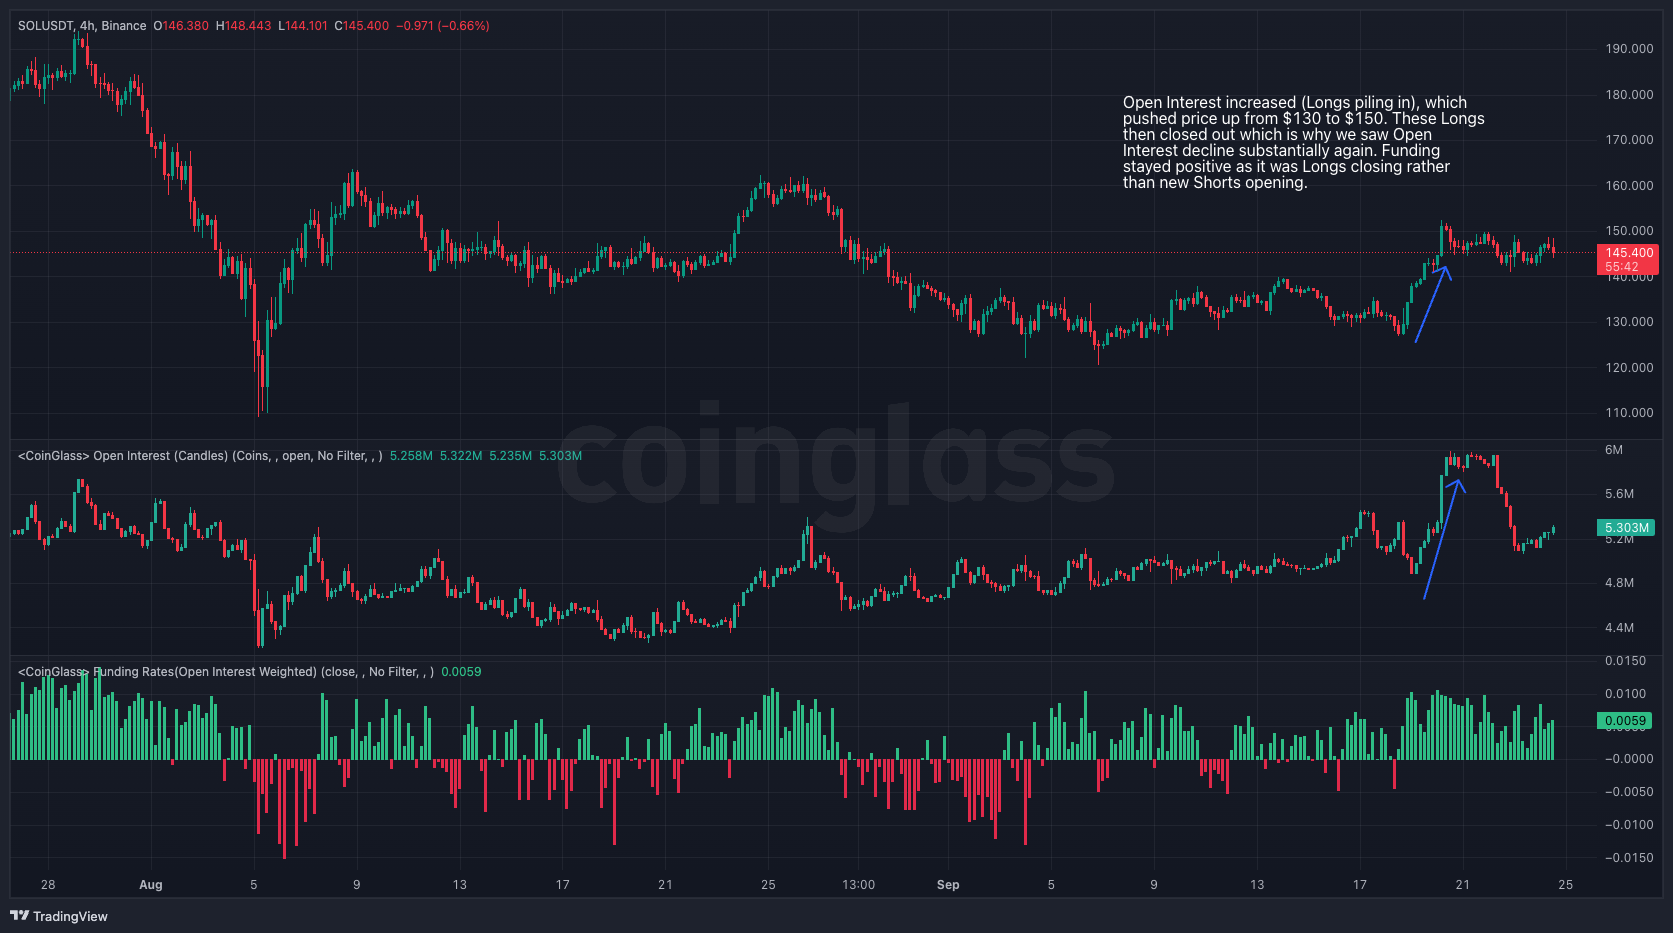
- Over the last week, SOL's Open Interest increased substantially (Longs piling in) before then dramatically declining (Longs closing out).
Technical analysis
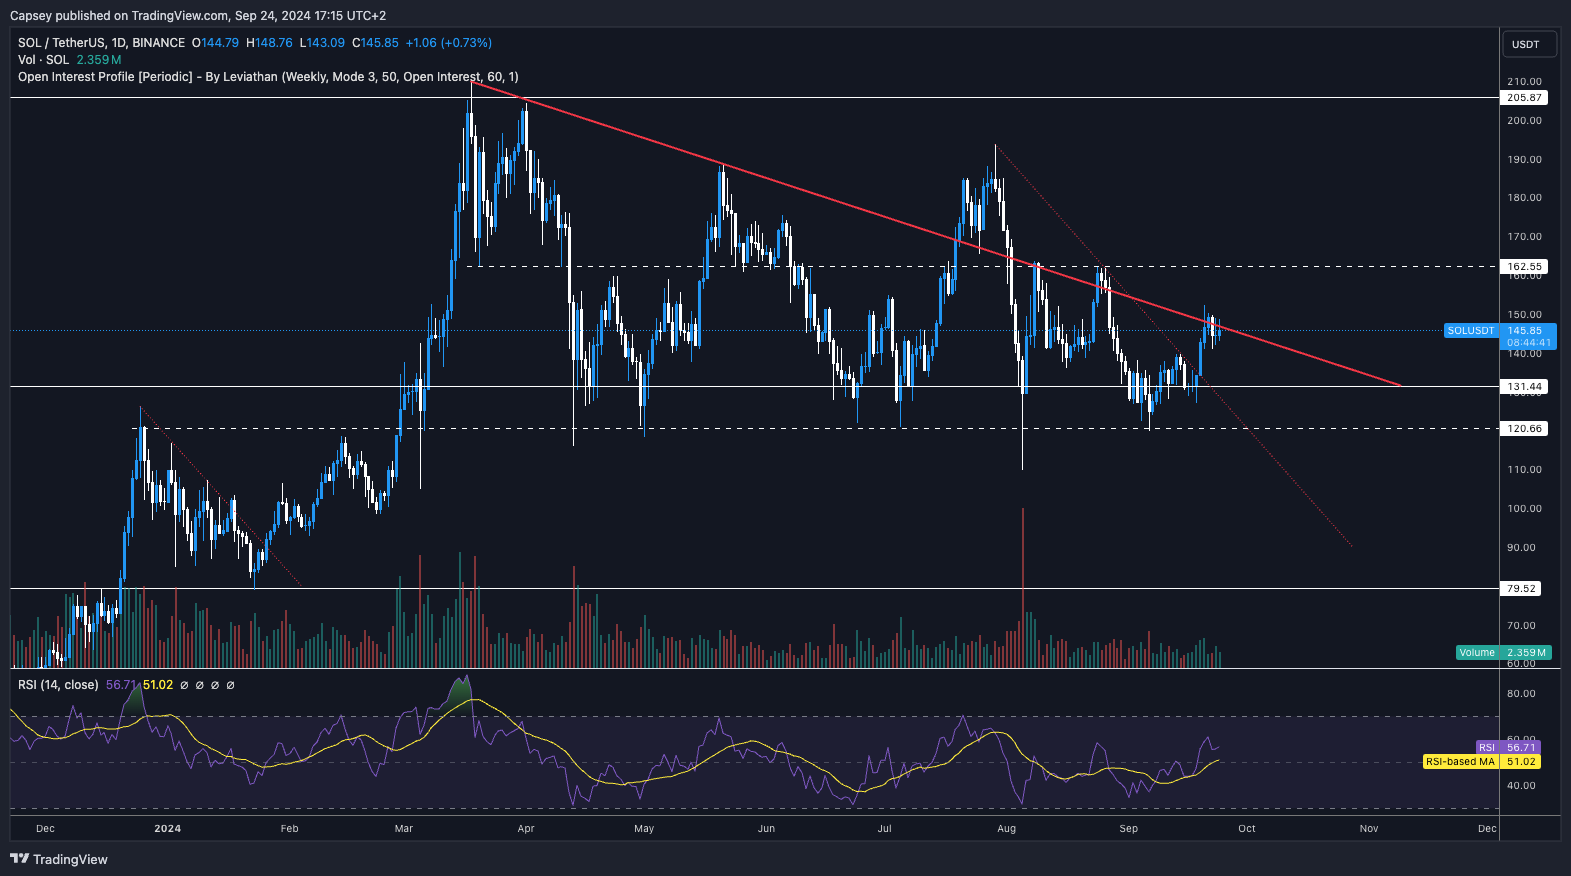
- SOL is currently battling and has been, for a few days now, at the main downtrend line.
- Currently, the main downtrend line is proving to be resistance, although a breakout above it likely sends the price quickly to retest the main horizontal resistance at $162.
- On the downside, the major support zone remains between $120 and $131. If the price pulls back to that level, we would expect this zone to hold.
Cryptonary's take
In the immediate term, SOL is battling at the main downtrend line, with a breakout potentially pushing SOL higher to retest $162. But, if we zoom out, SOL remains in the much wider range between $120 ($131) and $162. Until we see a clear breakdown or clear breakup, we're just sitting tight, with not much to get too excited about in the meantime. Holding Spot bags and exercising patience as we move into the US Elections and beyond, where we're expecting more significant outperformance.WIF:
- Nice move from WIF overall to break out from the local downtrend line (red dotted line), reclaim above $1.60, and then begin the push higher to the local horizontal resistance of $1.96.
- $1.96 local resistance also converges with the underside of the local uptrend line (yellow dotted line). This area may, therefore, prove to be a short-term resistance area.
- Beyond $1.96, the main overhead horizontal resistance is at $2.20. If the price can comfortably break above this level, then there's little resistance (bar the main downtrend line) until $3.05.
- To the downside, we expect $1.60 to hold as support if the price pulls back as far as that.
- The RSI is pushing up towards overbought territory, but it's possible there's further upside to be had here in the short-term.
- What's also positive is that volumes have increased significantly. A significant move higher in price, backed by good volume, is a sign that the move higher is potentially more sustainable.
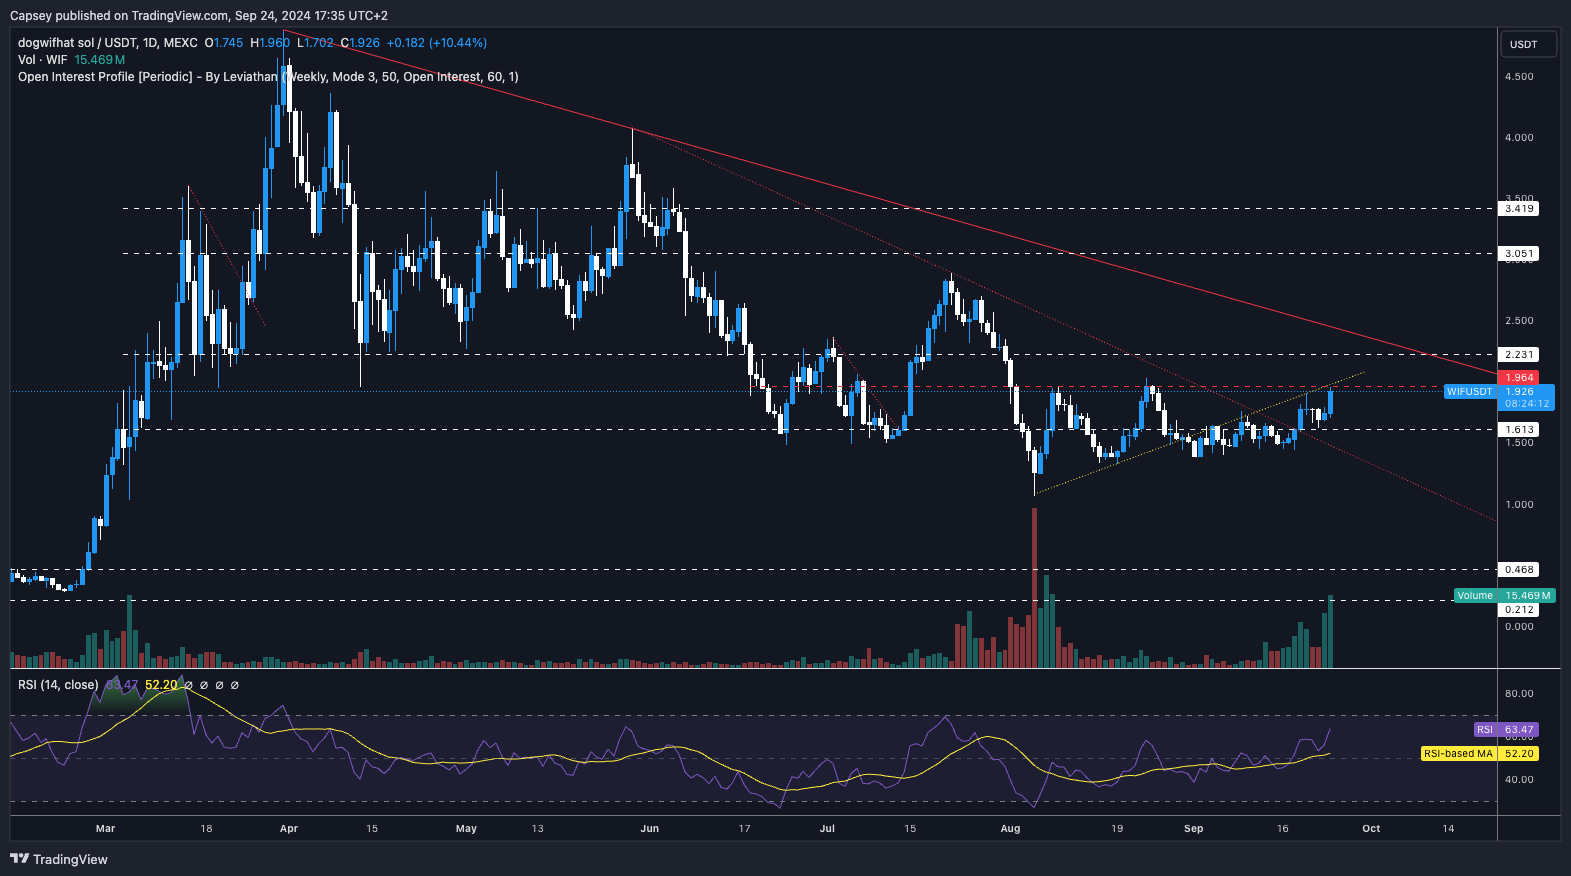
Cryptonary's take
A really positive move higher for the price, which we felt was expected considering other SOL memes had been moving but WIF lagged. We've now seen it catch up somewhat. In the short-term, it's possible that $1.96 acts as a resistance, but we think in the coming week or two, WIF can retest $2.20, which will be the key testing area for the price.POPCAT:
- After a massive move from the lows at $0.4 in early September, POPCAT broke out of its main downtrend line, shoving price higher to retest the major horizontal resistance at $0.96.
- Price now looks to have formed a double top, similar to the local top we saw in late June.
- Price is still in its local uptrend, and even a retest of $0.77 would maintain the local uptrend.
- Below the current price, the horizontal line of $0.77 is potentially a local support. However, for POPCAT, the price is known to have deeper pullbacks, therefore a retest of the next horizontal level at $0.65 is possible.
- The RSI was also in overbought territory, whilst it also put in a bearish divergence (higher high for price, but lower high on the oscillator). Since this, the price has pulled back to $0.87 but the RSI is now retesting its Moving Average, where it may find support.
- If the price can breakout above $0.96 to $1.00, then the price would go into discovery and $1.20 to $1.40 would be on the cards in the short-term.
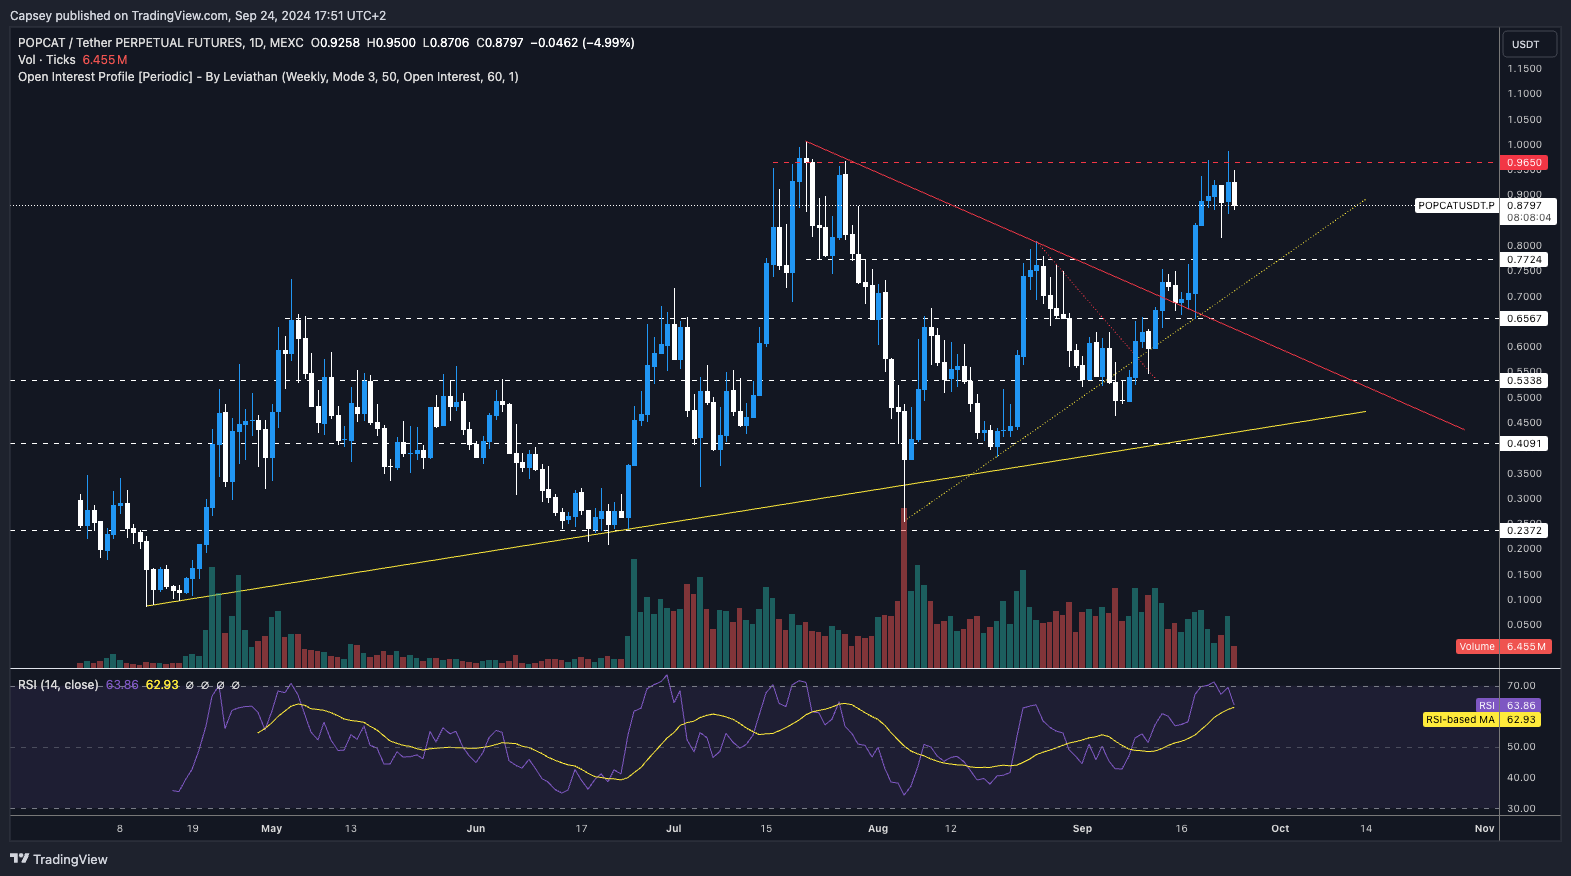
Cryptonary's take
Again, another that's hard a great move, so a slight pullback/period of consolidation could be expected here. If the price does pull back (we think it can), then we'd be looking at $0.77 to provide support, but if not, then $0.65. Despite this being our assessment, we're certainly not looking to sell Spot bags as we expect the price to be substantially higher in the coming months. For now, we're sitting tight and riding out what we think can be a consolidation period.Recommended from Cryptonary


PRO
Market Direction
12 min read
Mar 13, 2026

PRO
Market Direction
13 min read
Mar 10, 2026

PRO
Market Direction
12 min read
Mar 6, 2026
