Save 23% ($351) & Get a Free 1-1 Call with our Team ⏰ : 0d 2h 59m 43s
Disclaimer: This analysis is for informational purposes only and not financial advice.
TLDR:
- BTC: Bullish above $105k; needs Spot strength to break $110k–$112k. Target: $120k.
- ETH: Range-bound ($2,420–$2,720) with bullish setup; breakout could target $3,280.
- SOL: Holding $144 support; upside target $185, with potential >$200 later.
- HYPE: HYPE at resistance, likely pullback.
- AURA: AURA showing bullish pattern, targeting $0.50.
BTC:
- BTC's Open Interest is up 10% from the $105k levels, suggesting that the positive price action we've seen in the last few days was mostly leverage driven. There is still a positive Spot bid, although there were a lot of Asks/Sellers into $110k.
- BTC's Funding Rate is positive, suggesting there is a slight bias amongst traders to be Long, however, the Funding Rate has fluctuated between slightly positive and negative over the last week.
- There are little signs of froth in the leverage market, and for BTC to breakout of $110k-$112k, it'll likely need a greater Spot bid.

Technical analysis
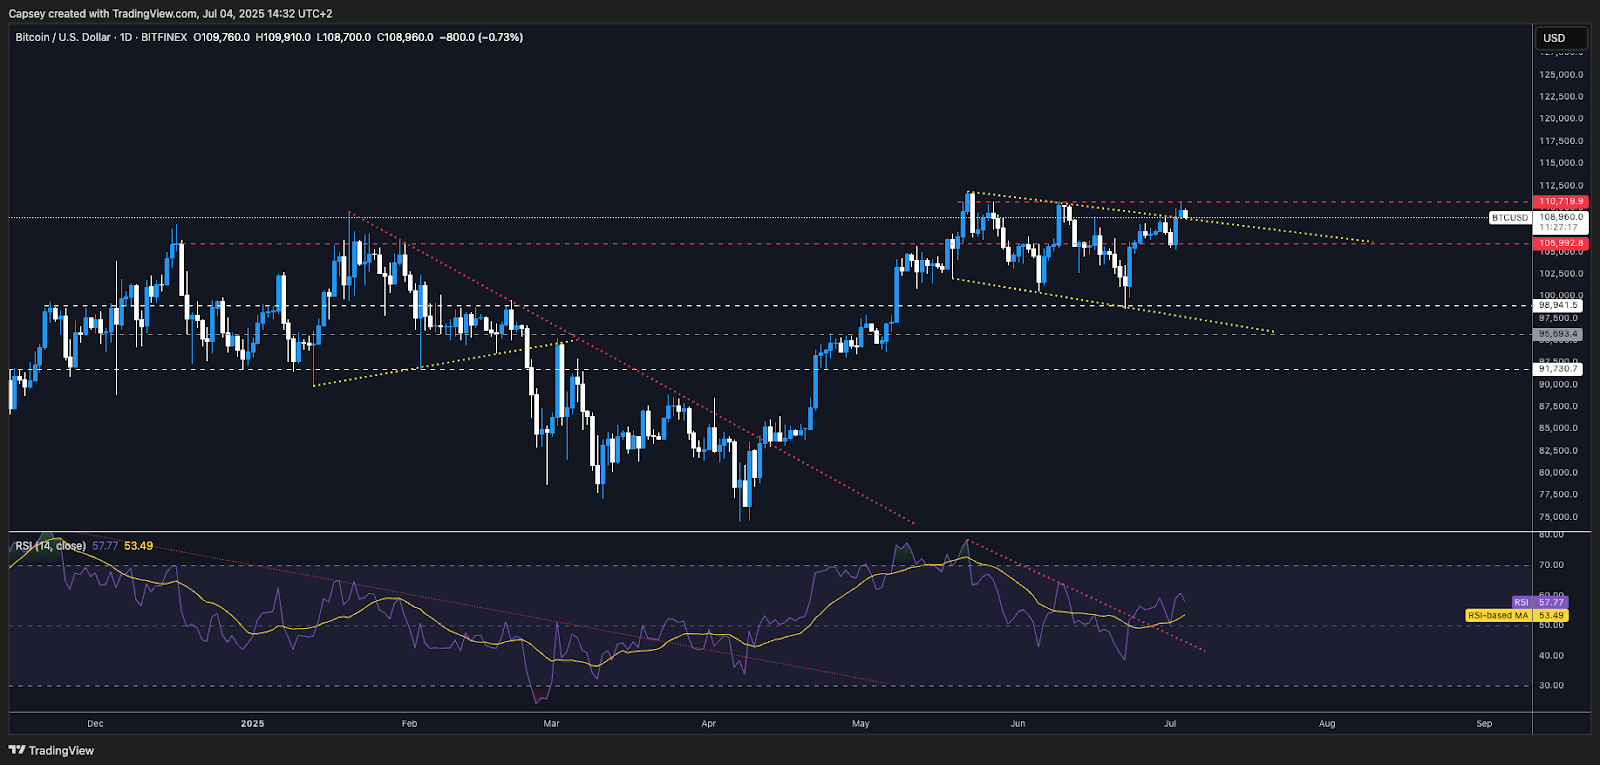
- BTC pulled back to the horizontal level of $106,000 and bounced, as we expected it would, and called for in Monday's Market Direction.
- BTC has been in a broadening downtrend wedge pattern since late May. Price has just broken out above the top border of the broadening wedge pattern in the last two days.
- It's important that price holds above the top border of the broadening wedge, however, if price is north of $105k, it remains in a bullish structure.
- The local resistances are at $110,700 and then the all-time high of $112,000.
- To the downside, the horizontal supports are at $106,00 and then a zone between $102,500 and $103,500.
- The RSI has broken out of its downtrend line and it's above its moving average, whilst it remains in middle territory. This is a bullish structure, and it suggests that there is more upside to be had in the medium term.
Cryptonary's take
BTC remains in a bullish structure having broken out of the top border of the broadening wedge pattern. Price has initially pulled back from the $110,700 level following a stronger than expected jobs report yesterday, which saw Interest Rate cuts pushed slightly further out. This stalled the rally in the short-term. But with ETF flows holding firm and no new macro shocks, the bullish structure remains intact.
It is possible now that we see 1-2 weeks of chop due to rate cuts being slightly pushed out. However, the bullish chart structures remain, and therefore we remain bullish in our view that BTC will move higher over the coming weeks. Should BTC breakout of $110k-$112k, the expected first target is $120k.
- Next Support: $106,000
- Next Resistance: $110,700 (then $112,000)
- Direction: Neutral/Bullish
- Upside Target: $120,000
- Downside Target: $106,000
What's next?
BTC sets the stage, but ETH and SOL both eye breakouts—will ETH finally clear $2,720 and can SOL push for the $185–$200 zone? HYPE and AURA both hover near critical inflection points.ETH:
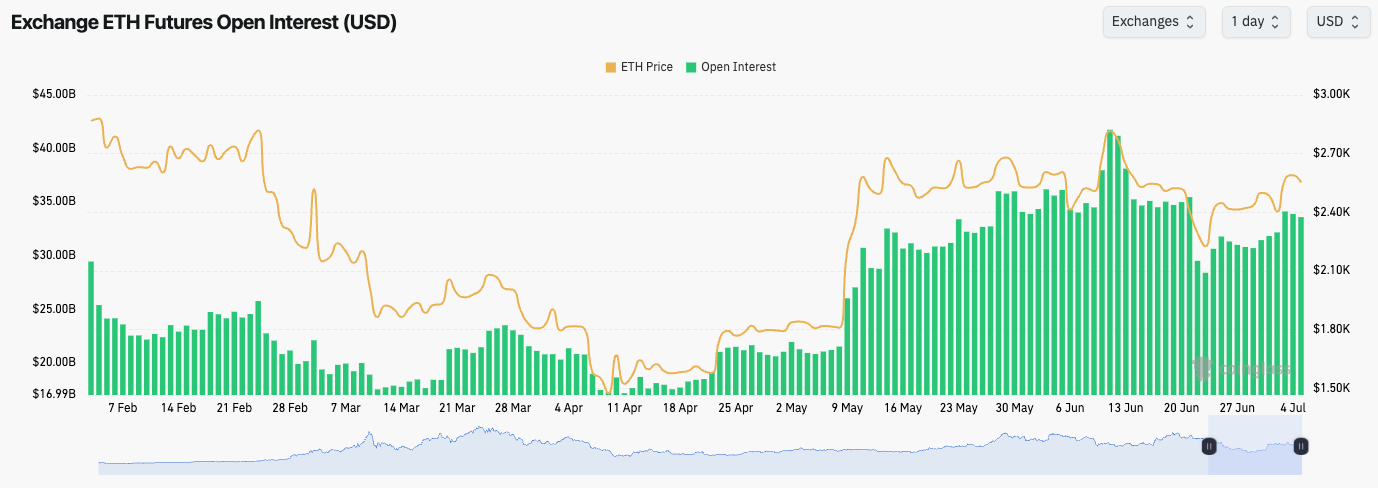
- ETH's Open Interest has increased slightly following the lows of 23rd June; however, it remains relatively subdued.
- ETH's Funding Rate has fluctuated between 0.00% and 0.01% suggesting that there is a slight bias to be Long, but there are little to no signs of froth in the leverage market.
Technical analysis
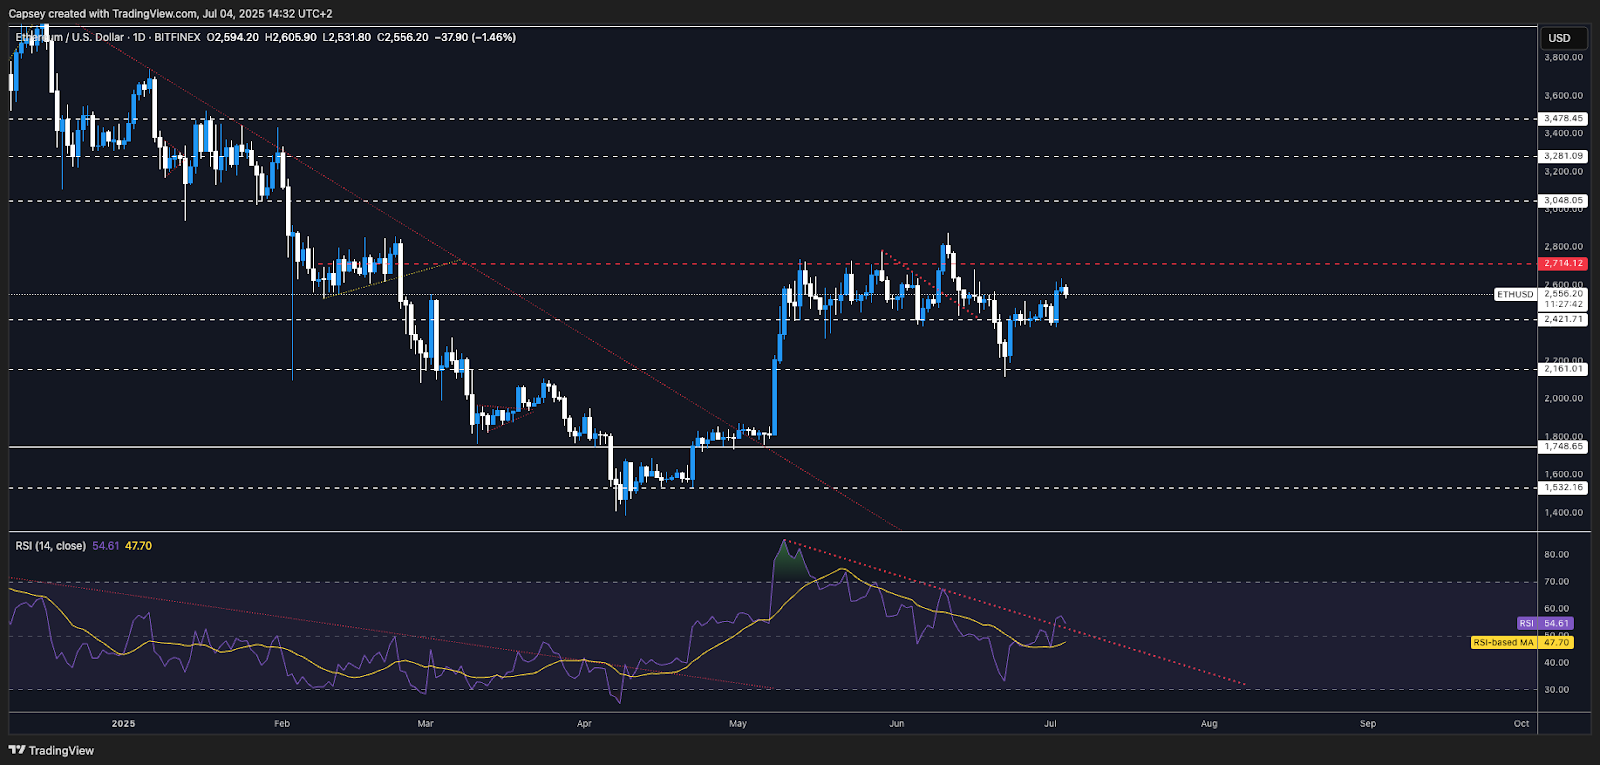
- ETH bounced perfectly from the $2,160 horizontal support, with price quickly reclaiming the key horizontal level of $2,420.
- Price found support at $2,420, and has now moved higher, recovering the mid-level of the range, with price now sitting on top of a local support at $2,550.
- The main horizontal resistance is at $2,720, and then at $2,870 beyond that.
- A breakout of $2,870 would likely send ETH to $3,280.
- The RSI is in middle territory, and it's currently attempting a breakout of its downtrend line, whilst it's being nicely supported by its moving average. This is a bullish structure.
Cryptonary's take
ETH is back in its main range between $2,420 and $2,720. We're expecting ETH to chop between this range for the next 1-2 weeks, however, our expectation is that ETH's next major move is a breakout above $2,720. Assuming we see this, ETH is likely to retest $3,000 in the coming months.
We would use retests of the range lows ($2,420) as levels to accumulate ETH if you're currently under-exposed, with a view to selling the position in 12 months’ time, well north of $3,200.
- Next Support: $2,420
- Next Resistance: $2,720
- Direction: Neutral/Bullish
- Upside Target: $3,050
- Downside Target: $2,420
SOL:
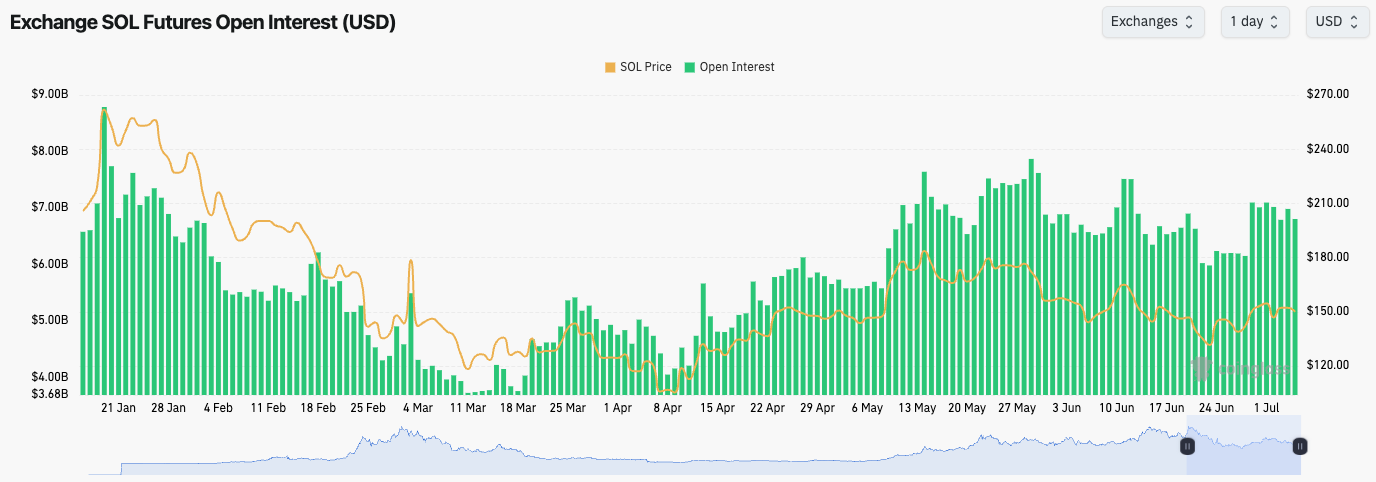
- SOL's Open Interest has picked up in the last week following price bouncing from $130.
- SOL's Funding Rate has fluctuated between positive and negative, suggesting indecision amongst traders.
- For now, there are no signs of froth in the leverage market, although price needs to see a more sustained Spot bid for price to move more meaningfully higher.
Technical analysis
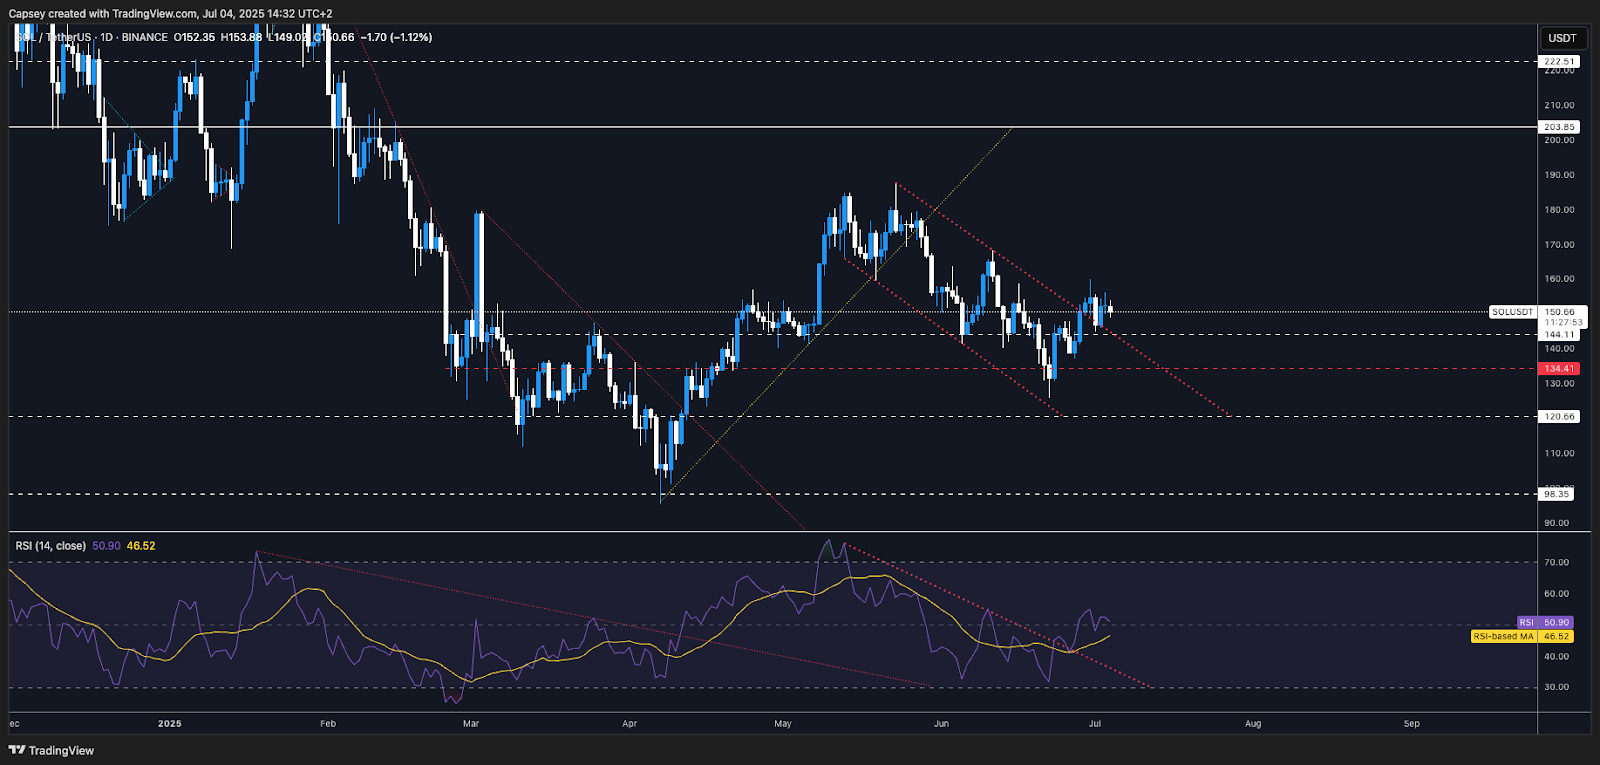
- Price bounced from $130, and it swiftly recovered the key horizontal level of $144.
- In the last week, price has broken out of the downtrend channel, and pulled back to the $144 horizontal level, using it as support and bouncing from there. This is a bullish setup.
- To the downside, $144 is the horizontal support, which will need to hold to maintain the bullish breakout.
- To the upside, $155 is a local horizontal resistance, with $185 being the major horizontal resistance.
- The RSI is in middle territory, having broken out of its downtrend line and now using its moving average as support.
Cryptonary's take
Despite the labour market data coming in strong (which pushes Interest Rate cuts out), SOL remains in a bullish structure here if it can maintain above $144. It is possible that we might now be in for 1-3 weeks of chop, which is typical during a summer period, although our view is that SOL's next major move will be a breakout to the upside that retests $185.
We will continue to buy SOL should it retest the lows between $120 and $135. However, we believe having meaningful exposure between $144 and $150 is good positioning ahead of the next leg higher.
It's possible that price is range bound throughout the summer, before more meaningfully breaking out above $200 in late Q3 or early Q4. We're looking to use the next weeks to get well positioned for that.
- Next Support: $144
- Next Resistance: $155
- Direction: Neutral/Bullish
- Upside Target: $185
- Downside Target: $135
HYPE:
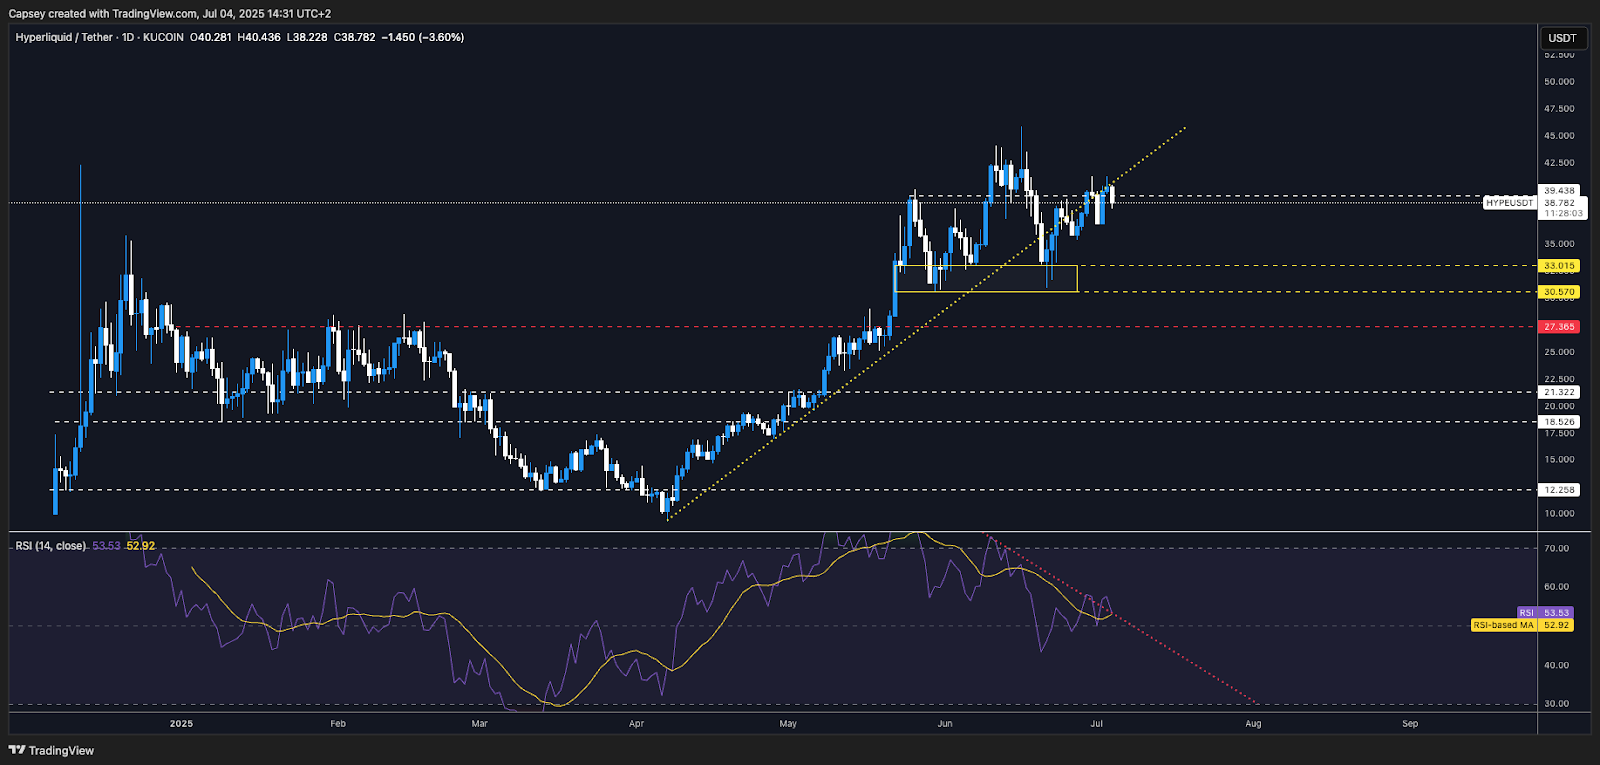
- HYPE broke below its uptrend line and filled the Yellow Buy Box between $30.50 and $33.00.
- Price has since bounced and it's retesting the underside of the horizontal resistance at $39.40 ($40.00 psychological level).
- $39.40 to $42.00 is a key zone for price to clear above, we see this as a meaningful zone of resistance.
- Price is at a big resistance here, as there is convergence between the $39.40 to $42.00 zone, and the underside of the main uptrend line, which price is currently rejecting from.
- To the downside, we still see the Yellow Buy Box as a strong zone of support, between $30.50 and $33.00.
- The RSI, however, does look good. It's in middle territory, whilst it's using its moving average as support as it squeezes into its downtrend line. If the RSI can be supported here, then there is room for upside.
Technical analysis
Cryptonary's take
HYPE has been one of the strongest performers off the early April lows. However, in the short-term, price seems to be stalling out here as it runs into a meaningful resistance. In the short-term, HYPE is likely to pull back to the $30 to $33 range, as it's currently forming a bearish structure.
If price is to revisit the $30.50 to $33.00 area, we'd consider some light buys for the long-term. However, we'd look to add more aggressively between $25 and $30, should price move as low as that.
- Next Support: $33.00
- Next Resistance: $42.00
- Direction: Bearish
- Upside Target: $42.00
- Downside Target: $30.50
AURA:
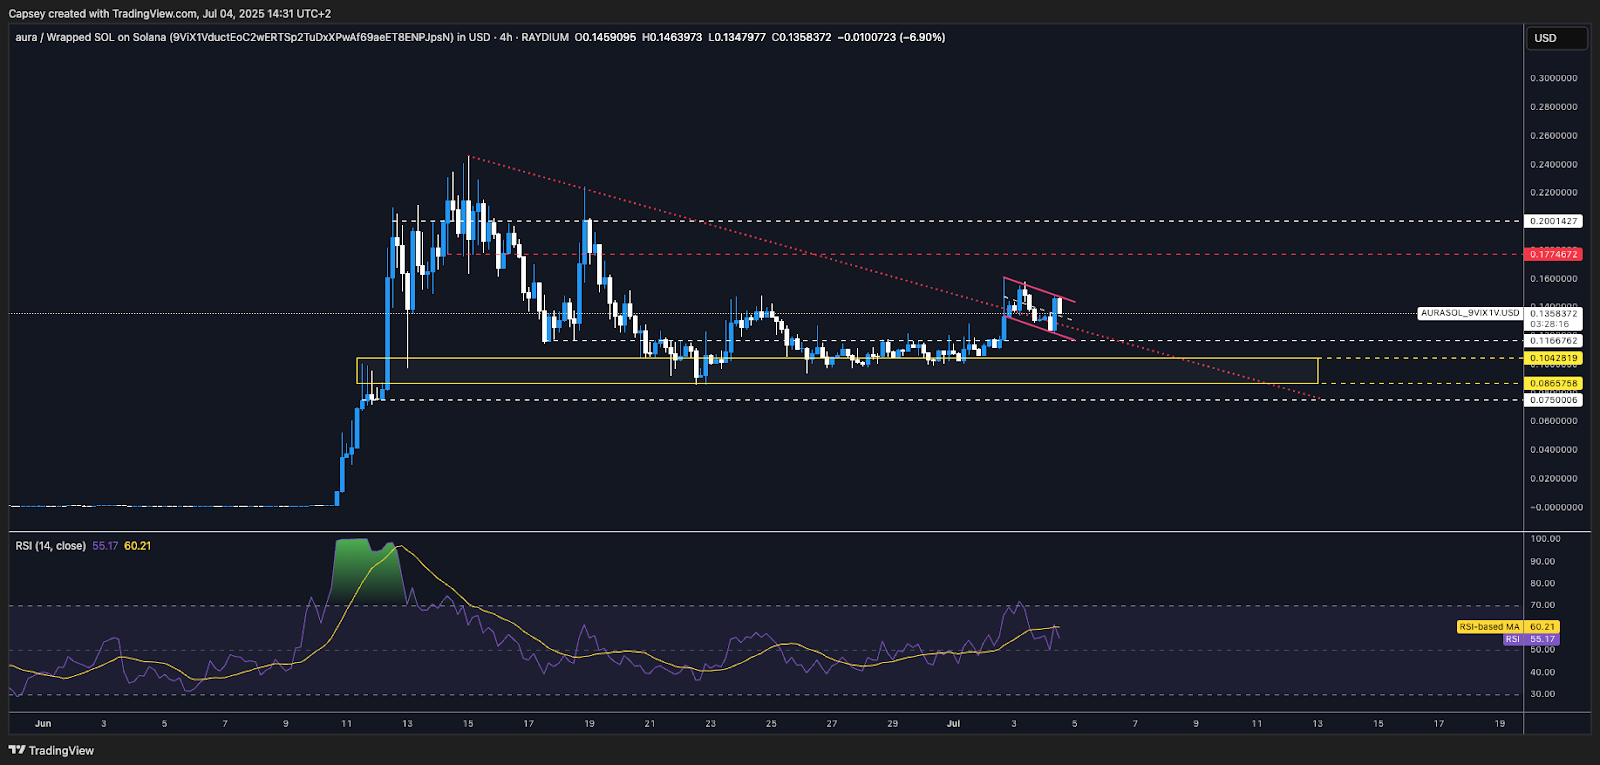
- Note: we are assessing the AURA chart on the 4hr timeframe rather than the Daily timeframe as it is currently more appropriate for analysis.
- Price pulled back from the highs of $0.24, and put in a 65% retracement, which is typical in the memecoin space.
- Price found support in the Yellow Buy Box between $0.085 and $0.104.
- Price has since squeezed into its downtrend line, and now price has broken out, having put in a small pullback to retest the downtrend line as new support. This is a bullish chart structure.
- Price is also in a local bull flag. This is a bullish structure on a local timeframe.
- In terms of local supports, $0.13 is a key horizontal support that we'd like to see price hold above.
- To the upside, the main horizontal resistances are at $0.177, and then $0.245, although there is a small local resistance at $0.161.
- The RSI on the Daily timeframe is in middle territory, having fully reset. It now has clear room to break to the upside.
Technical analysis
Cryptonary's take
AURA has taken time to put in a bottoming process where we have seen the distribution reset as old holders sell out. AURA is now forming a 'cup and handle' pattern, having formed its base between $0.085 and $0.104. This is a very bullish structure should it play out. This would suggest a move higher in the coming week to retest $0.20 and potentially becoming range-bound between $0.17 and $0.24 for a period. We would then expect price to breakout beyond $0.24 and likely push a lot higher.
In the long run, we believe the $0.085 to $0.245 is the long-term accumulation zone before a structural breakout toward $0.50 and beyond happens. The 'cup and handle' pattern gives a breakout target of $0.50. However, longer-term, our expectation is that this is a multi-billion $ MCap play.
- Next Support: $0.13
- Next Resistance: $0.177
- Direction: Bullish
- Upside Target: $0.245
- Downside Target: $0.116
Recommended from Cryptonary


