Save 23% ($351) & Get a Free 1-1 Call with our Team ⏰ : 0d 2h 59m 43s
BTC, ETH, and More: Support levels strained under pressure
Iran-Israel conflict intensifies while Fed maintains dovish stance despite inflation concerns. Key cryptocurrencies face pivotal technical levels as markets navigate heightened uncertainty and elevated open interest across major assets.

TLDR:
- Macro: Iran-Israel conflict ongoing; FED dovish despite inflation – markets cautious.
- BTC: Neutral-bearish; watch $106.9K resistance and $102.5K–$98.9K support.
- ETH: Range-bound; key levels at $2,420 (support) and $2,720 (resistance).
- Alts:SOL: Bearish; support at $120–$135.HYPE: Pullback likely; support at $32–$34. AURA: Bullish outlook; key support at $0.116, target $0.40.
In this section, we'll cover the Iran/Israel conflict and the outcome of Wednesday's FED Meeting and their potential impacts on risk assets/Crypto.
Iran/Israel: The Iran/Israel conflict continues to remain front and centre, with both sides continuing to fire missiles, with the Israelis' urgency due to them thinking that the Iranians were just weeks away from developing a nuclear weapon.
The US/Trump has indicated that they may enter the war with the goal of taking out the Iranian nuclear sites, although Trump has left the door open for a two-week negotiation. The Iranians have suggested they're open to this negotiation and installing limits on their nuclear enrichment programmes.
If there were to be an agreement/truce between Iran and Israel and the US, risk assets would likely move substantially higher upon this news. We'd also likely see Oil revisit $60/barrel, which would then likely alleviate the inflationary pressures.
Wednesday's Fed meeting:
On Wednesday, the FED released a new Summary of Economic Projections, which showed that the FED expected inflation to move up. This is a stagflationary setup, which then surprised traders to see that the FED still saw 2 Interest Rate cuts in the Dot Plot for 2025. This suggests a dovish FED that would likely be looking to cut Interest Rates now if tariffs weren't a part of the picture.
Let's now move on to Crypto and the charts for today's Market Direction.
BTC:
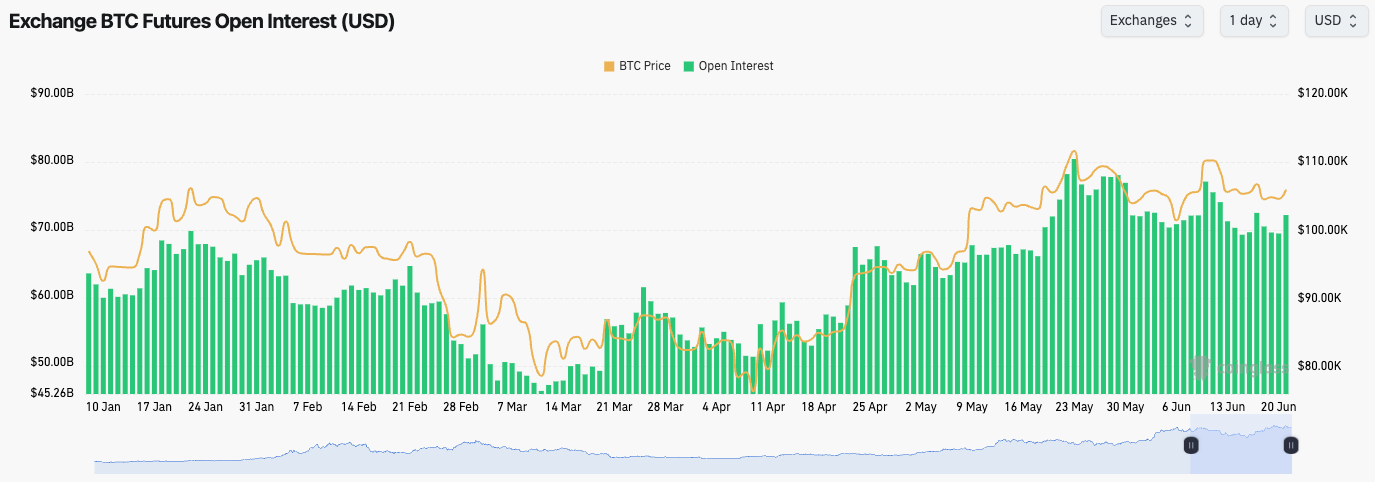
- BTC's Open Interest remains high overall, having ticked up slightly as price has moved from $103k back to $106k.
- Funding Rates are positive, but they're not meaningfully high, suggesting that there is a balance between Longs and Shorts here.
- We're not expecting a flush out, but a small flush out might be healthy here, just to reset Open Interest further.
Technical analysis
- BTC remains in a pennant pattern with price having found support at the bottom border of the pennant.
- Price is now squeezing into a horizontal resistance at $106,900. If the price can break through this level, then this sets up a move to $110,500 (the next horizontal resistance).
- If price does break below the bottom border of the pennant, then the horizontal supports are at $102,500 and then $98,900.
- The RSI has meaningfully reset, and it's now in middle territory. However, it is underneath its own average, which may act as a form of resistance.

- Next Support: $102,500
- Next Resistance: $106,900
- Direction: Neutral/Bearish
- Upside Target: $110,500
- Downside Target: $98,900
Cryptonary's take
With the ongoing Iran/Israel conflict and with tensions elevated, investors/traders are not looking to risk-on with meaningful size and are likely adopting a more cautious stance for now. This may negatively impact Bitcoin in the short term, and it might mean that the price breaks down from the pennant rather than up.We expect BTC to pull back to $102,500, with the potential for $98k to be reached. If $98k is reached, we'll begin building a position in BTC, whilst we'd also bid down to $92k, although we don't currently expect more downside below $98k.
ETH:
- ETH's Open Interest also remains elevated whilst price has remained range-bound.
- The Funding Rate is positive but not frothy, suggesting that there is a bias to be Long, but that positioning is evenly balanced.

Technical analysis
- ETH has had very boring price action, with the price mostly remaining range-bound between $2,420 and $2,720.
- Price did break out above $2,720 but swiftly rejected back into the range upon the escalations in the Middle East.
- So far, price has used the $2,420 horizontal level as support. If the price were to break below $2,420, then the next major level of support would be at $2,160. We would be buyers of ETH at these levels should they be retested.
- To the upside, the major level to clear above is $2,720, and then $2,850.
- The RSI has meaningfully reset, and it's using its downtrend line as new support. However, the RSI is below its moving average, which may prove to be a resistance for upside.

- Next Support: $2,420
- Next Resistance: $2,720
- Direction: Neutral/Bearish
- Upside Target: $2,850
- Downside Target: $2,160
Cryptonary's take
Like BTC, ETH looks somewhat fragile here, although price has held well considering the escalation we've had in the Middle East, which has been due to relatively good ETF flows. We expect ETH to retest $2,420, and if it breaks, then we'd look to bid ETH into $2,160, should it go as low as that.However, this isn't our base case, and we are impressed that ETH has remained range-bound under recent macro and geopolitical uncertainty. If there is a resolution to the Iran/Israel war, then we'd expect ETH to move up to $2,720 upon this. If the conflict drags out, then it's possible we see price break $2,420 and visit $2,160.
SOL:
- SOL's Open Interest is down trending, suggesting a less frothy leverage market.
- SOL's Funding Rate also remains positive but not too elevated.
- Ultimately, from a leverage market perspective, SOL looks positive here, although a flush out would likely see a significant resetting, and longer-term, this may be healthy for SOL.

Technical analysis
- SOL remains in its downtrend channel, with price having rejected the top border of the channel on several occasions.
- Price is currently finding support at its main horizontal support ofm$144. If this level is broken, then the next supports are at $135 and $120.We expect this zone (between $120 and $135) to be a strong support for the price.
- To the upside, the key levels are $165 and then $185. If there is a breakout in the short term (maybe on war resolution), then we'd expect a move up to $165.
- The RSI is in middle territory, and it is battling at its moving average, which may prove to be resistance.

- Next Support: $144
- Next Resistance: $165
- Direction: Bearish
- Upside Target: $165
- Downside Target: $135
Cryptonary's take
SOL is in a precarious position here, particularly with the uncertainty around the geopolitical picture, which we expect shouldn't last long. However, this uncertainty may result in a short-term breakdown for price in the coming days/week, meaning a test of $135 is possible in that time.Should SOL breakdown, we would be aggressive buyers of SOL between $100 and $120, whilst we’d be slowly and progressively buying (in lighter size) should SOL visit the $120 to $135 range.
HYPE:
- HYPE put in several back-to-back bearish divergences (higher highs in price and a lower high on the oscillator) in overbought territory. We therefore suggested that price may see a more meaningful pullback, which is what's happened.
- In terms of the RSI and divergences, HYPE is now putting in a hidden bullish divergence (higher low in price, and a lower low in the oscillator). This may help the price bounce back to $39–$40 in the short term.
- There is relatively strong support for HYPE between $32 and $34. We'd expect this to be a relatively strong area to bid.
- Should the $32–$34 area of support be lost, then $28 is the next major horizontal support for HYPE.
- To the upside, the local resistance is at $39.40, with the main horizontal resistance being the all-time high of $45.70.
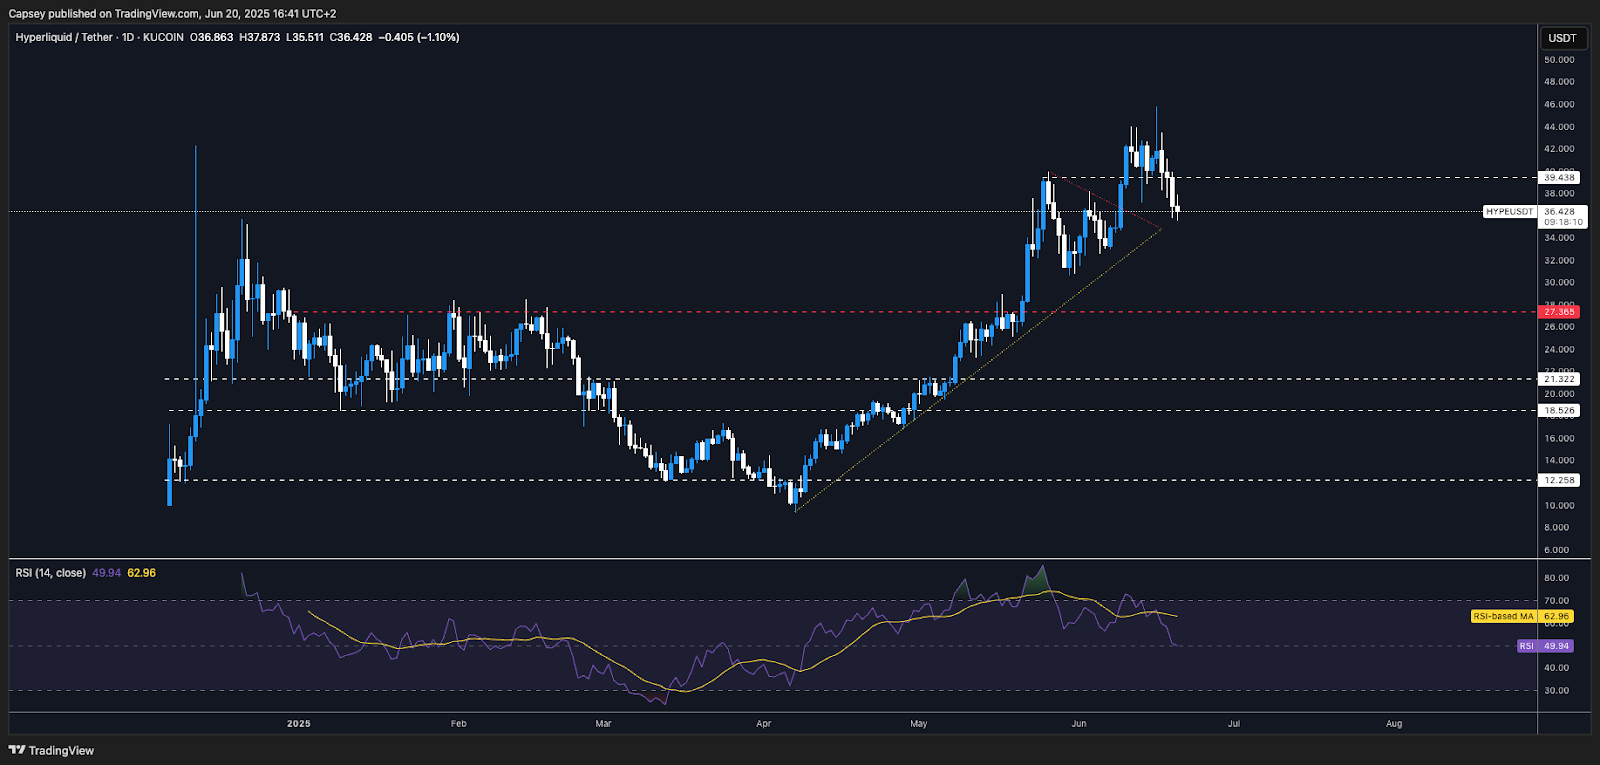
- Next Support: $32-$34
- Next Resistance: $39.40
- Direction: Bearish
- Upside Target: $39.40
- Downside Target: $32
Cryptonary's take
This pullback for HYPE has been needed in our view having put in back-to-back bearish divergences in overbought territory, after a long run up, and over 4x up after the lows in early April. Whilst it's possible a small relief rally could be put in, pushing price to $39, our overall view is that HYPE has more room to go lower in the short-term. In terms of buying HYPE, we prefer building a position between $25 and $28, but we may begin between $32 and $34 if structure confirms.AURA:
- AURA has had a huge run higher from the lows, so this pullback should be expected, and it's healthy to see from a chart and a holder's distribution perspective.
- Firstly, this is just a 4-hour chart, but we're running off less Daily candle data, hence it's needed for us to zoom in to give a better analysis.
- Price has broken out of two downtrend lines, but it has continued to revisit its support at $0.116 to $0.120, having put in a resistance at $0.21.
- There is strong support below $0.116, should price break below it, at $0.075 and $0.092. If price does break below $0.116 (not our base case), then we expect a deviation move into $0.092 and for aggressive bidders to step in.
- Long-term, nothing has changed in the bigger structure, and we'll use deeper levels to scale in more aggressively.
- If price were to break above $0.21 (we expect it to eventually), then the short-term upside target is $0.35 to $0.40.
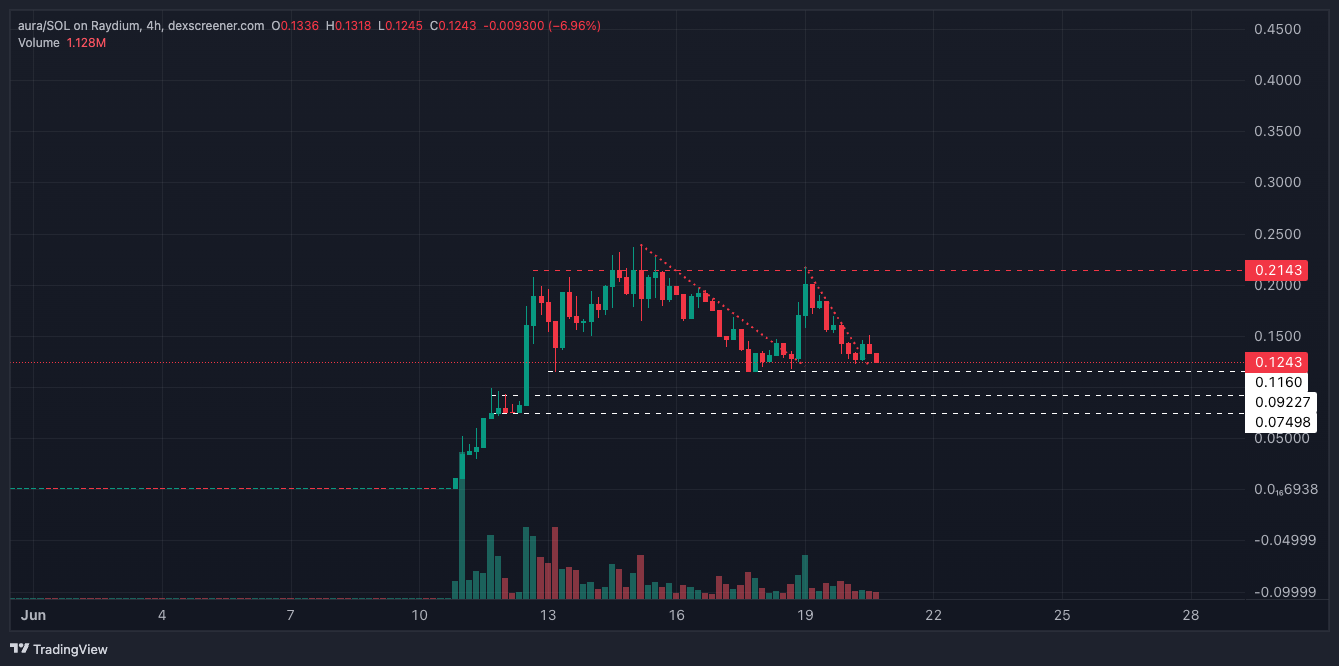
- Next Support: $0.116
- Next Resistance: $0.214
- Direction: Bullish
- Upside Target: $0.40
- Downside Target: $0.092
Cryptonary's take
Our expectation is that the chart has seen huge upside, and we now need to see a period of consolidation as Aura matures more. If price were to break below $0.116, then there are huge supports between $0.075 and $0.092, should price visit as low as that, although this is not our base case.Our medium to long-term targets remain multi-billions, with our short-term price targets being between $0.35 and $0.40.
For those who are still sidelined or looking to add to their bags, we'd suggest bidding the support levels, with $0.116 being the major support level.
Disclaimer: This is not financial or investment advice. You are responsible for any capital-related decisions you make, and only you are accountable for the results.
Recommended from Cryptonary


