Save 23% ($351) & Get a Free 1-1 Call with our Team ⏰ : 0d 2h 59m 43s
Market Direction
BTC, ETH, SOL, WIF, POPCAT, SPX set for moves
Bitcoin ($BTC) approaches $108k, Ethereum ($ETH) targets $4k, and Solana ($SOL) consolidates near $222. Meanwhile, WIF, POPCAT, and SPX rally toward resistance amid surging leverage and technical strength. Dive into our detailed analysis of this week’s crypto trends.
Disclaimer: This is not financial or investment advice. You are responsible for any capital-related decisions you make, and only you are accountable for the results.
BTC:
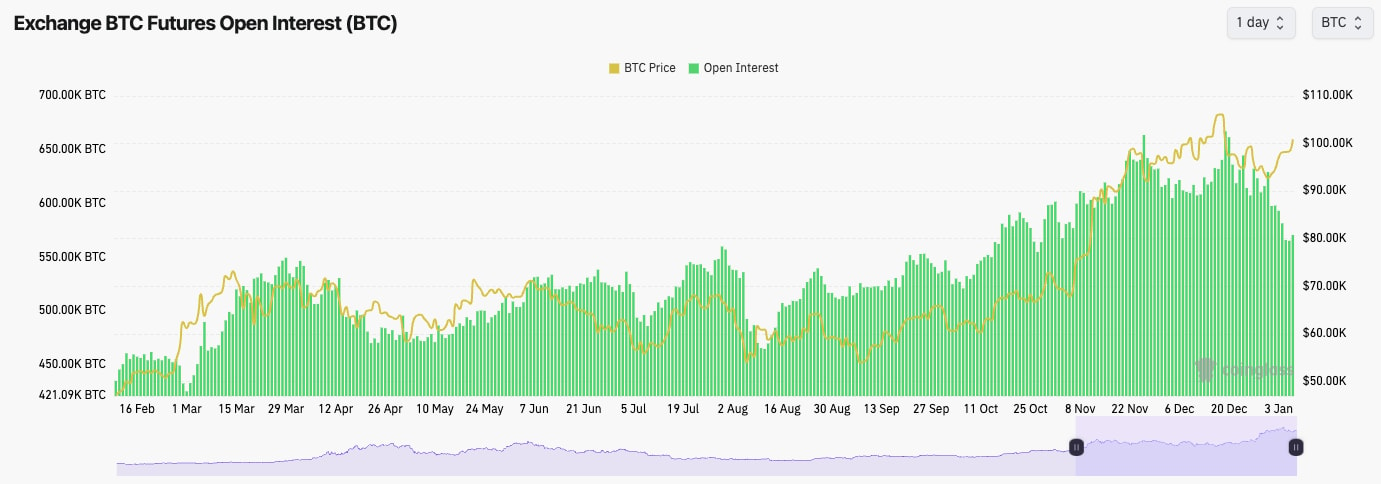
- BTC's Open Interest is down to 570k BTC from the local high of 667k BTC. This approximate 15% drawdown in OI is good and healthy to see. It means that excess leverage has been flushed, and BTC sits at $101k... super strong.
- Funding Rates are also at normal levels of 0.01%; again, excess leverage has been flushed, which is good to see.
- Overall, this is a healthy setup from a leverage perspective.
Technical analysis
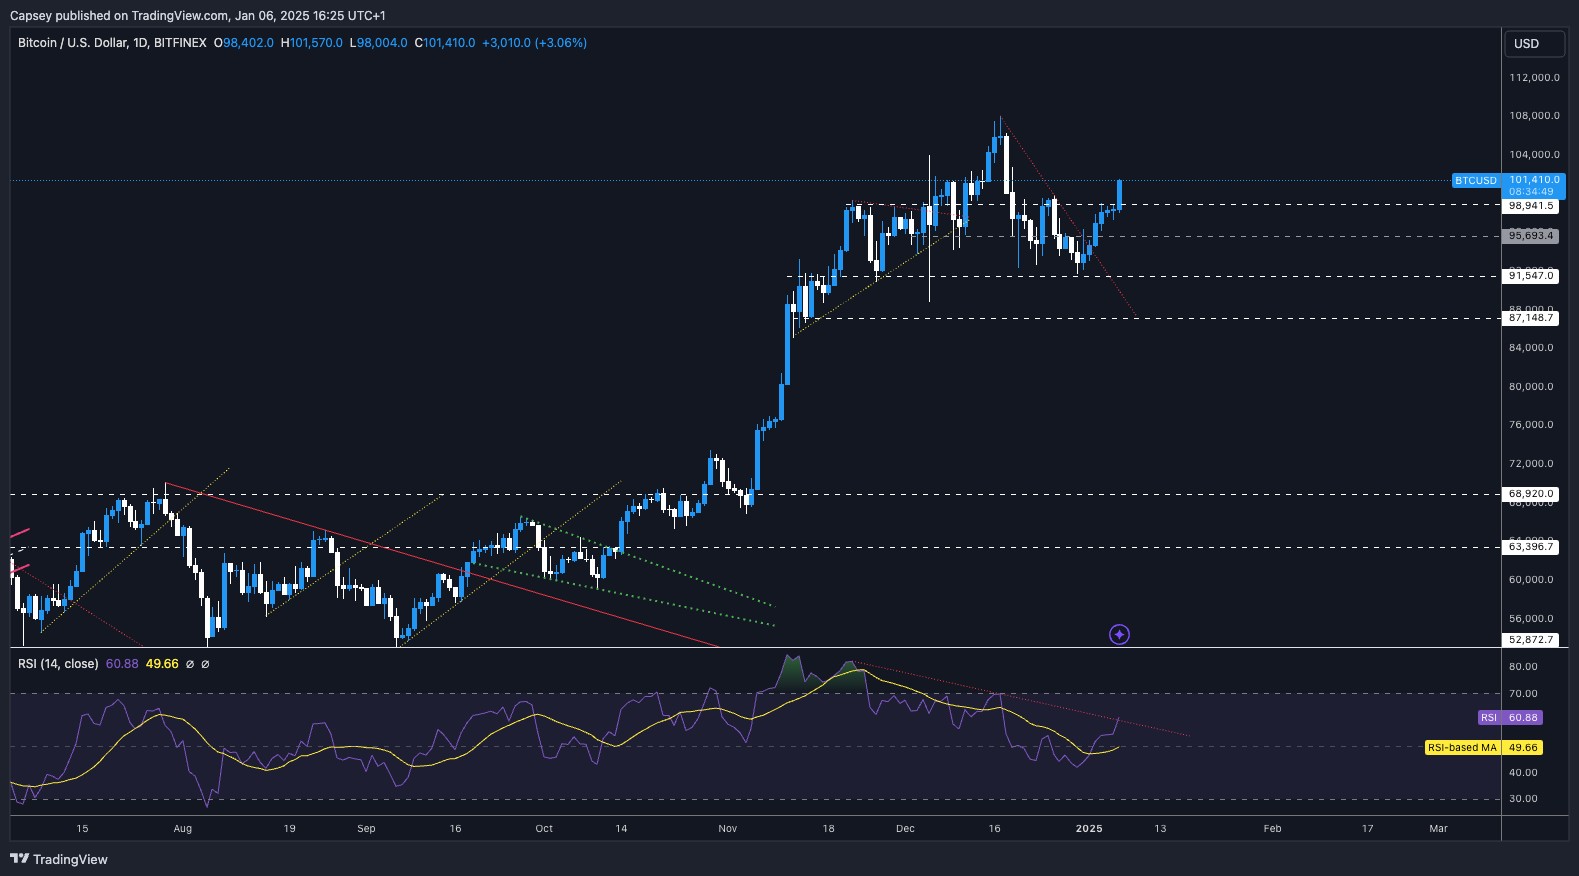
- BTC found support at $91,500, and it has broken out of the local downtrend line, sending prices higher.
- We've had a move higher into the local horizontal resistance at $98,900, and on the US open today, we've had a convincing break above. We'll now be looking for today's candle closure to be in this kind of area ($101k; anything north of $100k is good).
- Beyond $98,900, the main horizontal resistance is between $101,700 and $102,500. A break above this level, and you'd expect a swift retest of $108k.
- If we get a strong close today, we'll be looking at $98,900 to become new horizontal support.
- The RSI is above its moving average, and now it's retesting its downtrend line. A breakout from here is what likely pushes us to $108k again.
- The RSI is also not too close to being overbought yet. Room to go higher here.
Get the latest Bitcoin price prediction—dive into our detailed analysis to stay one step ahead!
- Next Support: $98,900
- Next Resistance: $102,500
- Direction: Bullish
- Upside Target: $108,000
- Downside Target: $95,500
Cryptonary's take
Overall, it was a really nice and clean move so far, exactly what we wanted to see going into the first few trading days of 2025 when the big boys have come back to their desks. Today, the US open drove prices higher, which again is a positive sign. We'll be looking to see strong ETF inflows today. In the short term, we expect BTC to continue to move up here. It's possible that $108k will be retested again in the coming 5-10 days.ETH:
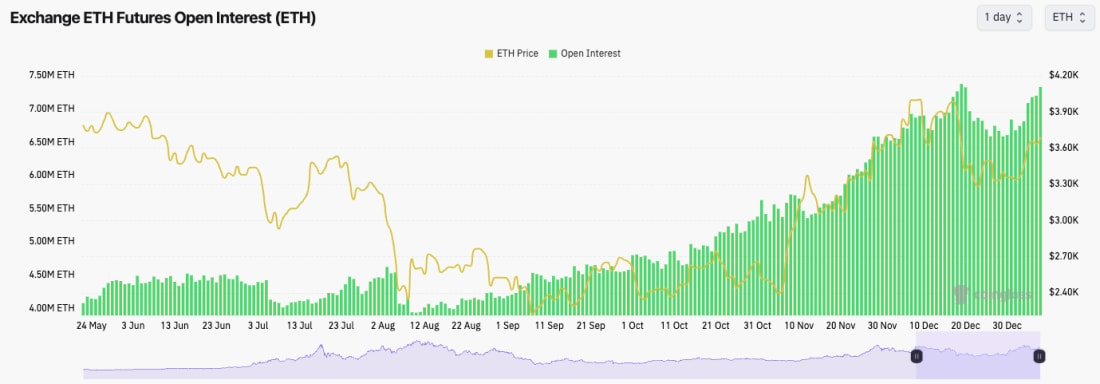
- It's really interesting to see that ETH's OI (by number of coins) is back to its highs. This shows that a lot of leverage has been put into ETH recently.
- ETH's Funding Rate is flat at 0.01%, meaning that the increased Open Interest is a relatively even mix of Longs and Shorts.
- This leverage setup is likely TradFi players taking advantage of the basis trade - Long the ETH ETF, Short the Futures, and take the Funding Rate as the arbitrage risk-free.
Technical analysis
- Exactly what we were expecting and looking for: a clean break above the range resistance at $3,480.
- $3,700 is a local resistance, but it might just be a short-term stopping point before ETH ends up heading higher to $4,000 again.
- If there is a more meaningful pullback (we're not expecting one), then $3,480 is likely to be old resistance now flipped into new support.
- The RSI has broken above its moving average, and at 58, it's still a long way from even being close to overbought. More upside likely.
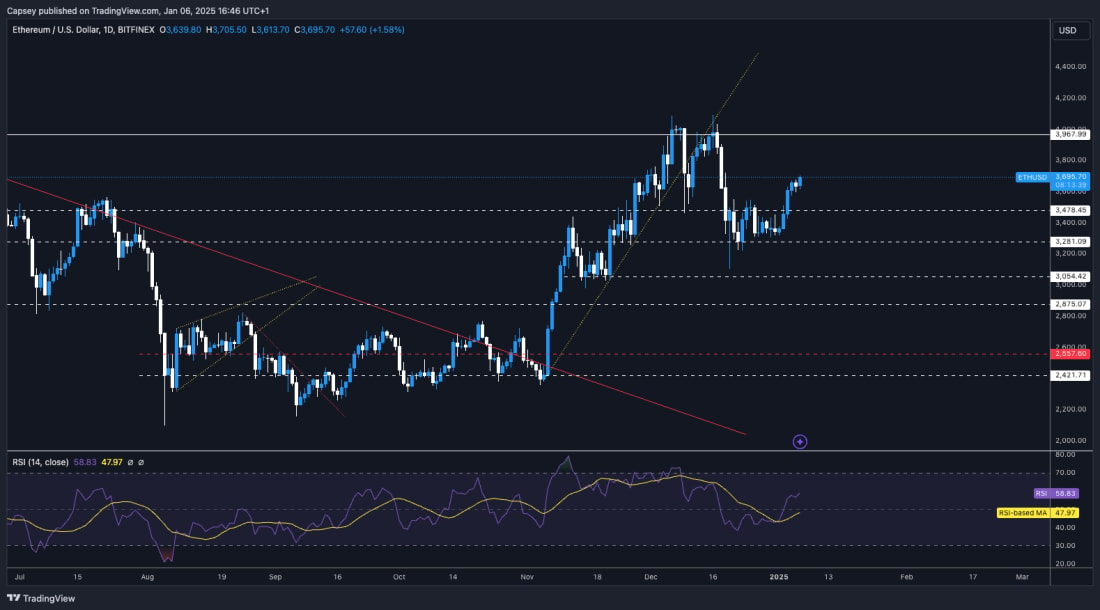
- Next Support: $3,480
- Next Resistance: $3,970
- Direction: Bullish
- Upside Target: $3,970
- Downside Target: $3,480
Cryptonary's take
Again, it was a really nice and clean move higher than we perfectly called in our last Market Direction. ETH is now in this higher range between $3,480 and $3,700. There's likely more upside to be had even if the price sits still for a few days first, but we are expecting a retest of $3,970 in the coming 7-10 days. All conditions look good here for it; let's see if we get it.SOL:
- SOL's Funding Rate is at 0.0050%, which means there's more of a Short build-up in the leverage in comparison to BTC and ETH. The funding rate is still positive, though.
- SOL's Open Interest has also now soared to new highs. Interesting. Again, there's a lot of leverage, but positioning is relatively evenly balanced. This opens the door to one side being blown out. If the price goes higher, Shorts will be blown out, and we may see a price squeeze higher.
Technical analysis
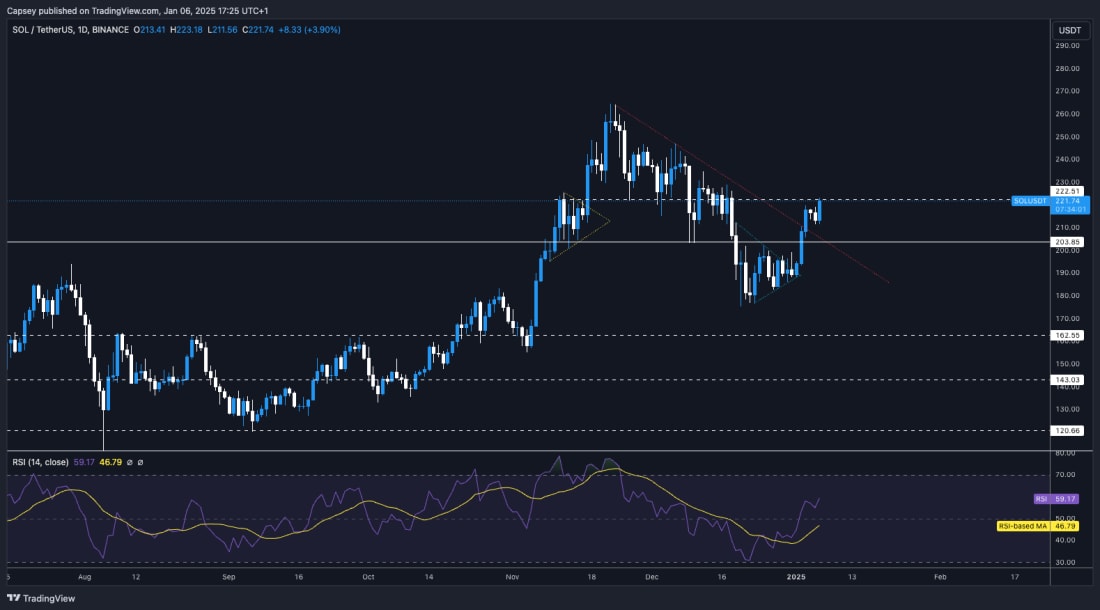
- SOL has broken out of the main downtrend line really cleanly.
- The price is now butting into the main horizontal resistance line at $222, and we'll be looking for a clean break at this level.
- The price is now in this higher range, between $203 and $222, so a breakout would be fantastic. If the price were to be rejected at $222, this wouldn't be too bad as long as the price holds the local low at $211.
- The major horizontal support now is at $2023.
- Beyond $222, the next horizontal resistance is at $236.
- The RSI has broken up from the lows and is now well above its moving average. It's also printing at 59, which is quite a bit shy of overbought territory. This, therefore, has likely more room to run higher in the short term.
Stay updated on Solana price prediction—explore our full analysis for the latest market insights.
- Next Support: $203
- Next Resistance: $222
- Direction: Neutral (Bullish)
- Upside Target: $236
- Downside Target:$203
Cryptonary's take
Again, this is another move we called for in the last Market Direction for SOL. We probably didn't expect as much as this so soon, so really, that emphasises how good and strong this move higher is so far. If BTC keeps running, then SOL likely follows and breaks through $222 and sends to $236. However, if there is a consolidation for a few more days below $222, we wouldn't worry about this, and we'd still expect a breakout to come, just to come slightly later on.WIF:
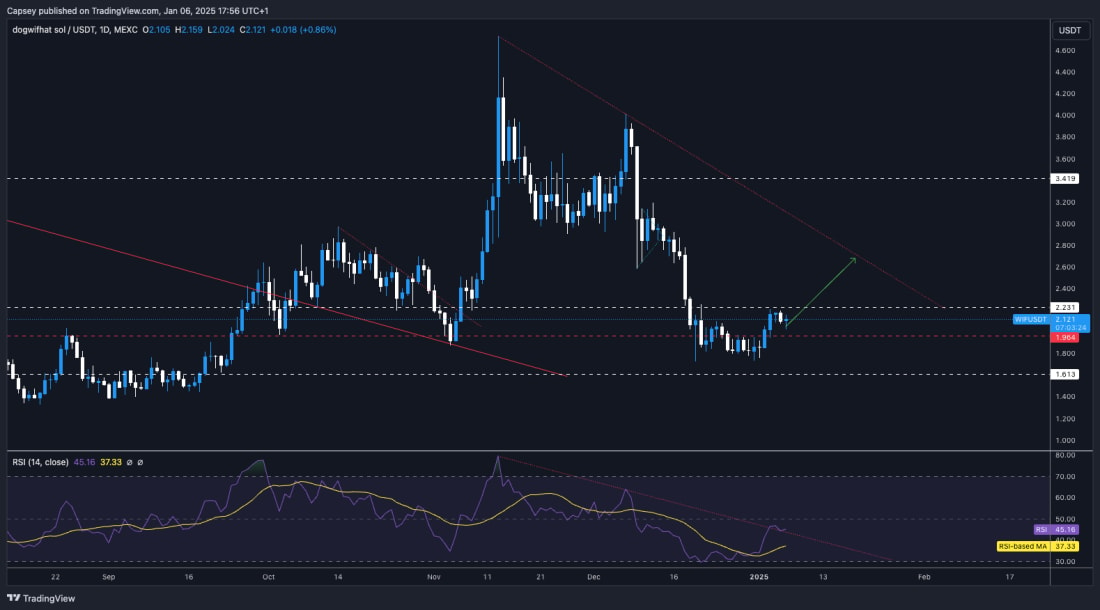
- As we expected a move up to the next horizontal resistance at $2.20, where we have an initial rejection.
- Price did find a lot of support at $2.00, and we've seen a bounce from there so far, so that's positive.
- A break above $2.20 and price likely swiftly sends to $2.70.
- If the price does break down, we'd expect $1.96 to hold as support.
- The RSI is only at 44, so there is a lot of room for this to go higher.
- The RSI is also attempting to breach above its downtrend line. A breakout of this, and this would likely fuel the price breaking out of $2.20 and getting to $2.60.
Don’t miss the latest dogwifhat (WIF) price prediction—explore our insights to stay ahead in the crypto market.
- Next Support: $1.96
- Next Resistance: $2.20
- Direction: Bullish
- Upside Target: $2.60
- Downside Target: $2.00
Cryptonary's take
As we mentioned last week, WIF and other major SOL memes (aside from the AI stuff, which is moving) are likely waiting on SOL to reclaim a higher range, which it is now beginning to do. We'd expect a break out of the $2.20 area in the coming days/week, with $2.60 likely to be the first area that price retests. Let's see what we get.POPCAT:
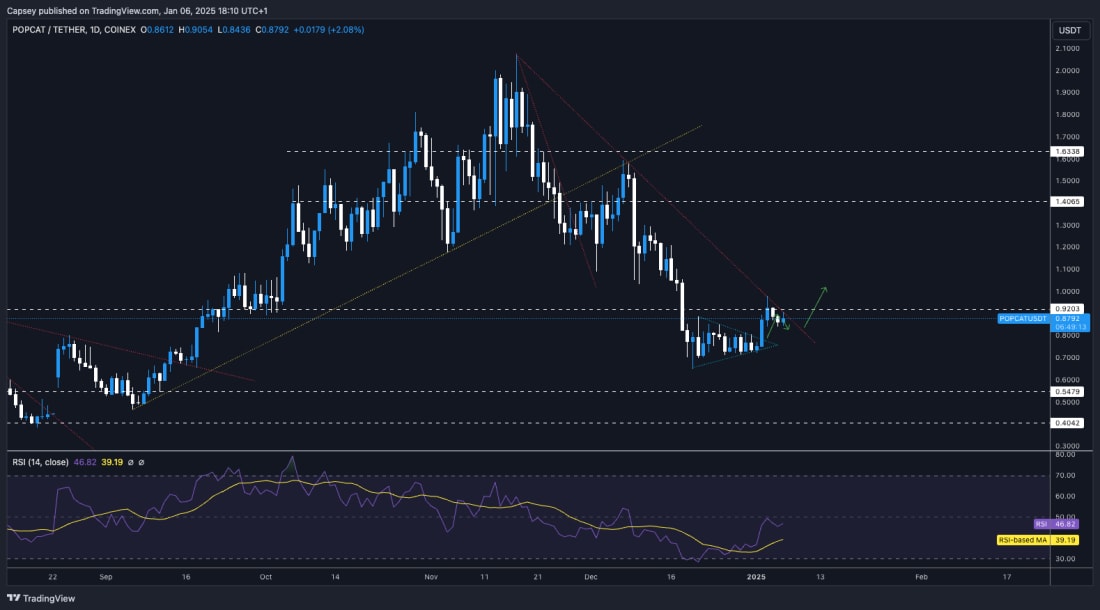
- In the last update, we drew some arrows on the chart, which was a path we expected the price to follow. Price has so far followed it to a tee.
- POP has broken out to the upside of the pennant pattern and moved directly into the main downtrend line and the horizontal resistance at $0.92.
- Price has so far rejected the main horizontal resistance, but the price is squeezing into the downtrend line for a second time.
- A breakout of the downtrend line and a clean reclaim above $0.92, and the price will likely swiftly move to $1.10 - $1.20.
- The RSI is in middle territory, so there is plenty of upside to be had, whilst it's also above its moving average.
Looking for an accurate POPCAT price prediction? Read our analysis to know what’s next for POPCAT!
- Next Support: $0.80
- Next Resistance: $0.92
- Direction: Bullish
- Upside Target: $1.10 - $1.20
- Downside Target: $0.70
Cryptonary's take
POPCAT looks on the verge of breaking out here. It's squeezing into its main downtrend line (a two-month trend line) whilst it's also butting up into the main horizontal resistance of $0.92. We expect $1.10 to $1.20 to be achieved in the coming 7-10 days.SPX:
- Firstly, congratulations all.
- Overall, it's just what a chart, and one we've essentially called perfectly.
- This is a move we expected, and upon the breakout of $0.75, we suggested that all the higher targets were then much more achievable. We've now got all of that and burst even higher.
- Price is overbought here in the short term, so at some point, there's likely to be a pullback. Predicting where that is is tricky. However, with the price having doubled in 10 days, it may be close to the $1.60 - $1.70 area. Again, short-term.
- What's also been really impressive is the volume increase; this is crucial for a convincing breakout, and it's exactly what we got.
- In terms of looking for support, it's currently very difficult. However, the $1.30 area stands out to us. But we'll reassess as and when we get a pullback.
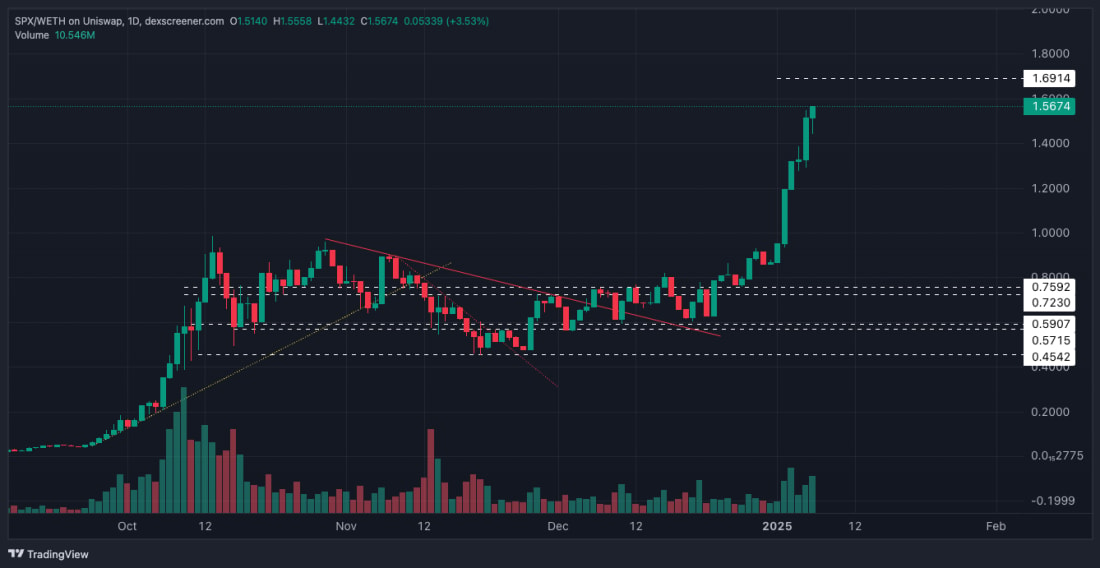
- Next Support: $1.30
- Next Resistance: $1.69
- Direction: Neutral
- Upside Target: $1.69
- Downside Target: $1.30
Cryptonary's take
SPX has had a phenomenal run over the past few weeks particularly in the last week. We do expect a pullback at some point soon, considering how strong the run has been. But that doesn't mean selling your bags; it's just natural to get higher after pulling such a massive move. We're not confident as to when this pullback will come, and it's important to state that. Congratulations to all those who have held SPX.Recommended from Cryptonary


PRO
Market Direction
13 min read
Mar 17, 2026
PRO
Market Direction
12 min read
Mar 13, 2026

PRO
Market Direction
13 min read
Mar 10, 2026
