Save 23% ($351) & Get a Free 1-1 Call with our Team ⏰ : 0d 2h 59m 43s

Pre-market direction update
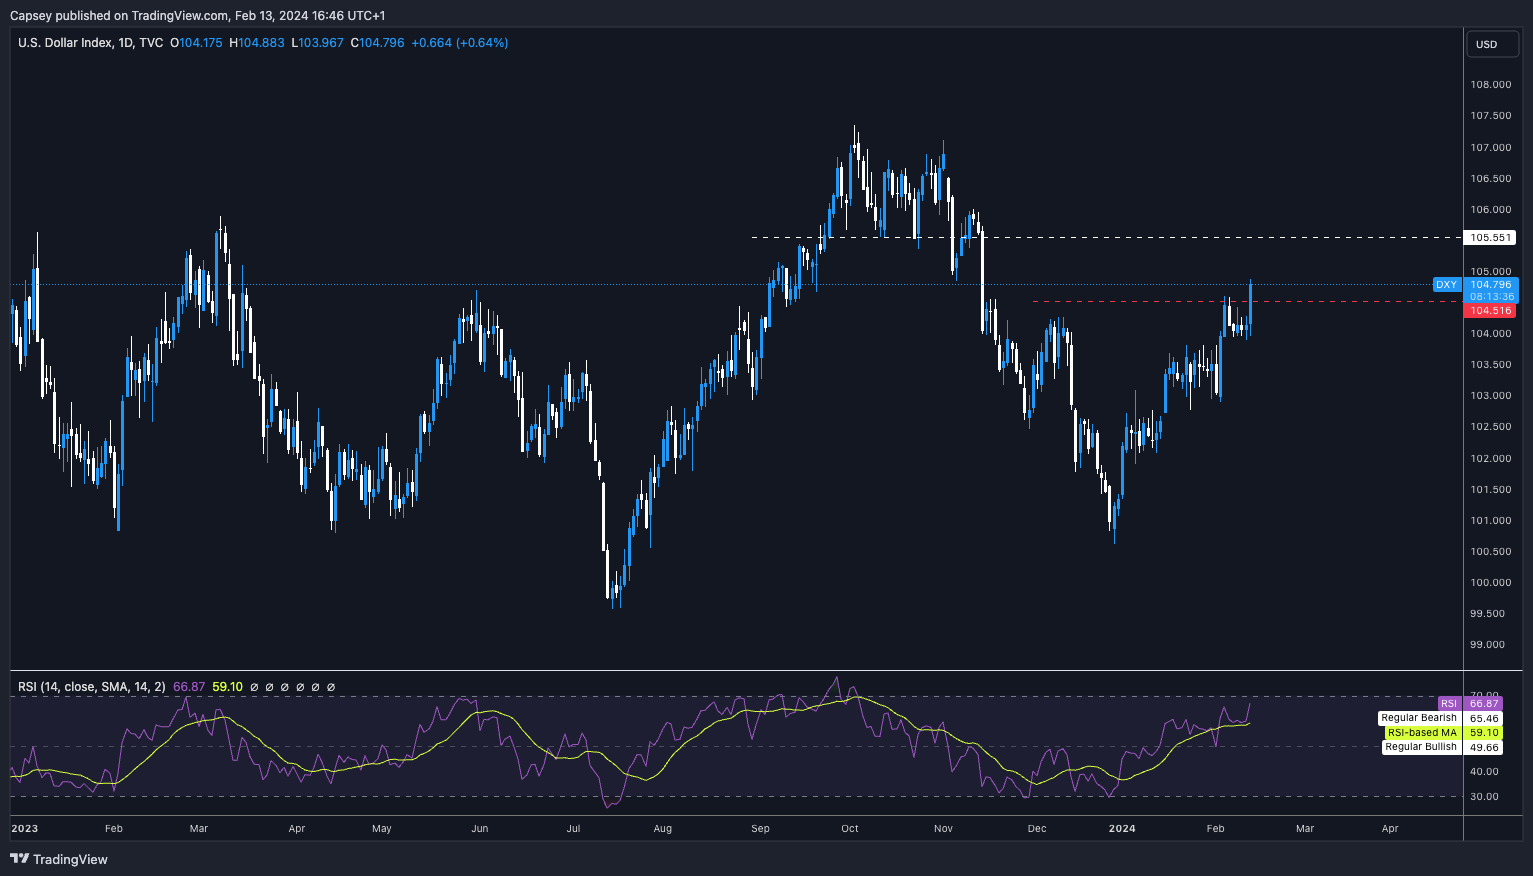
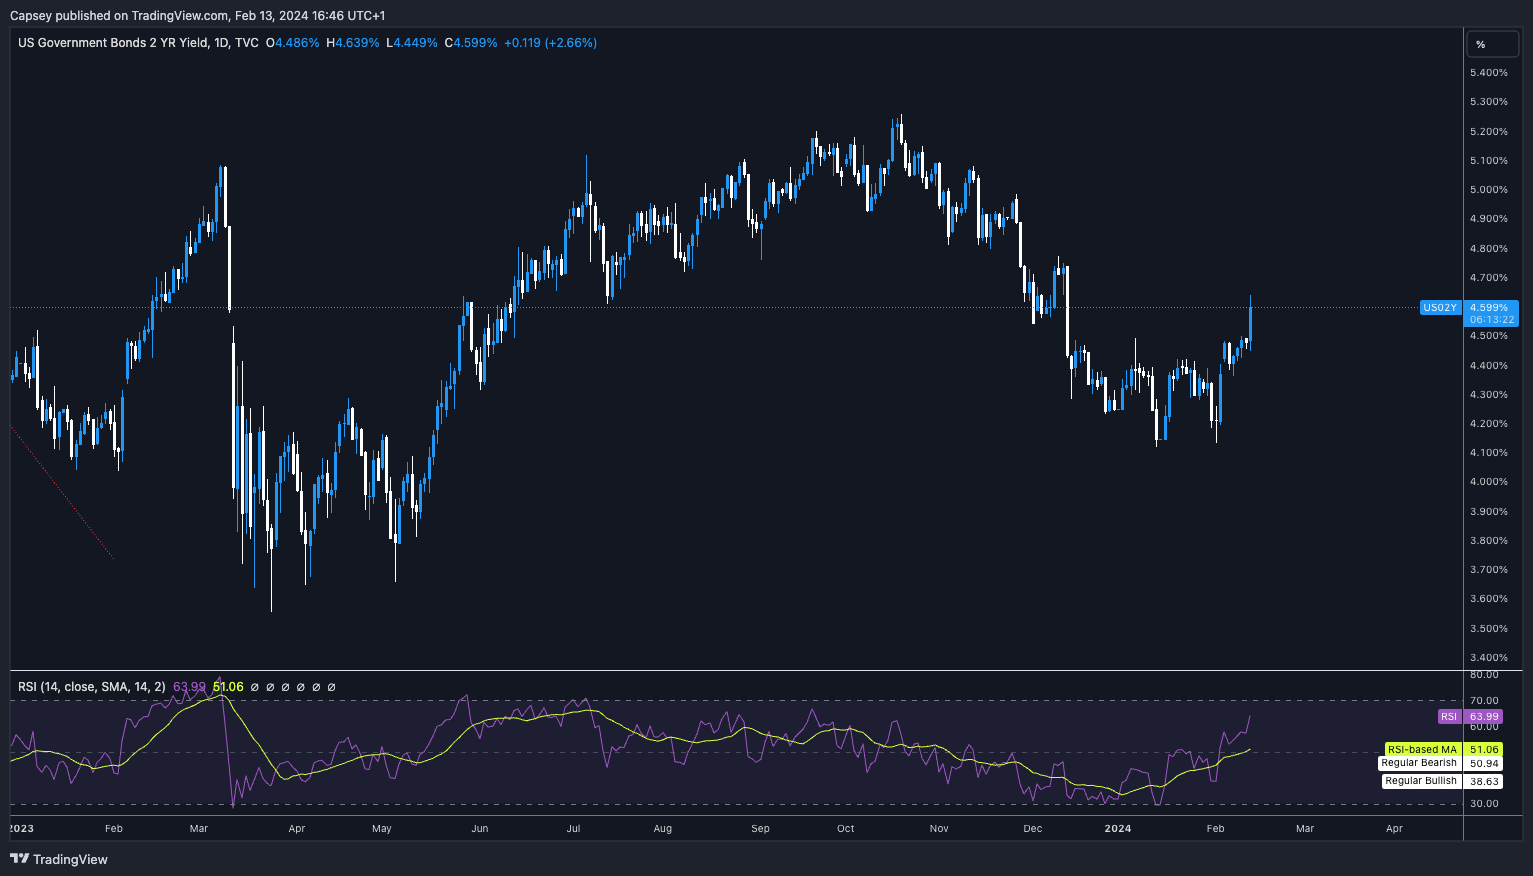
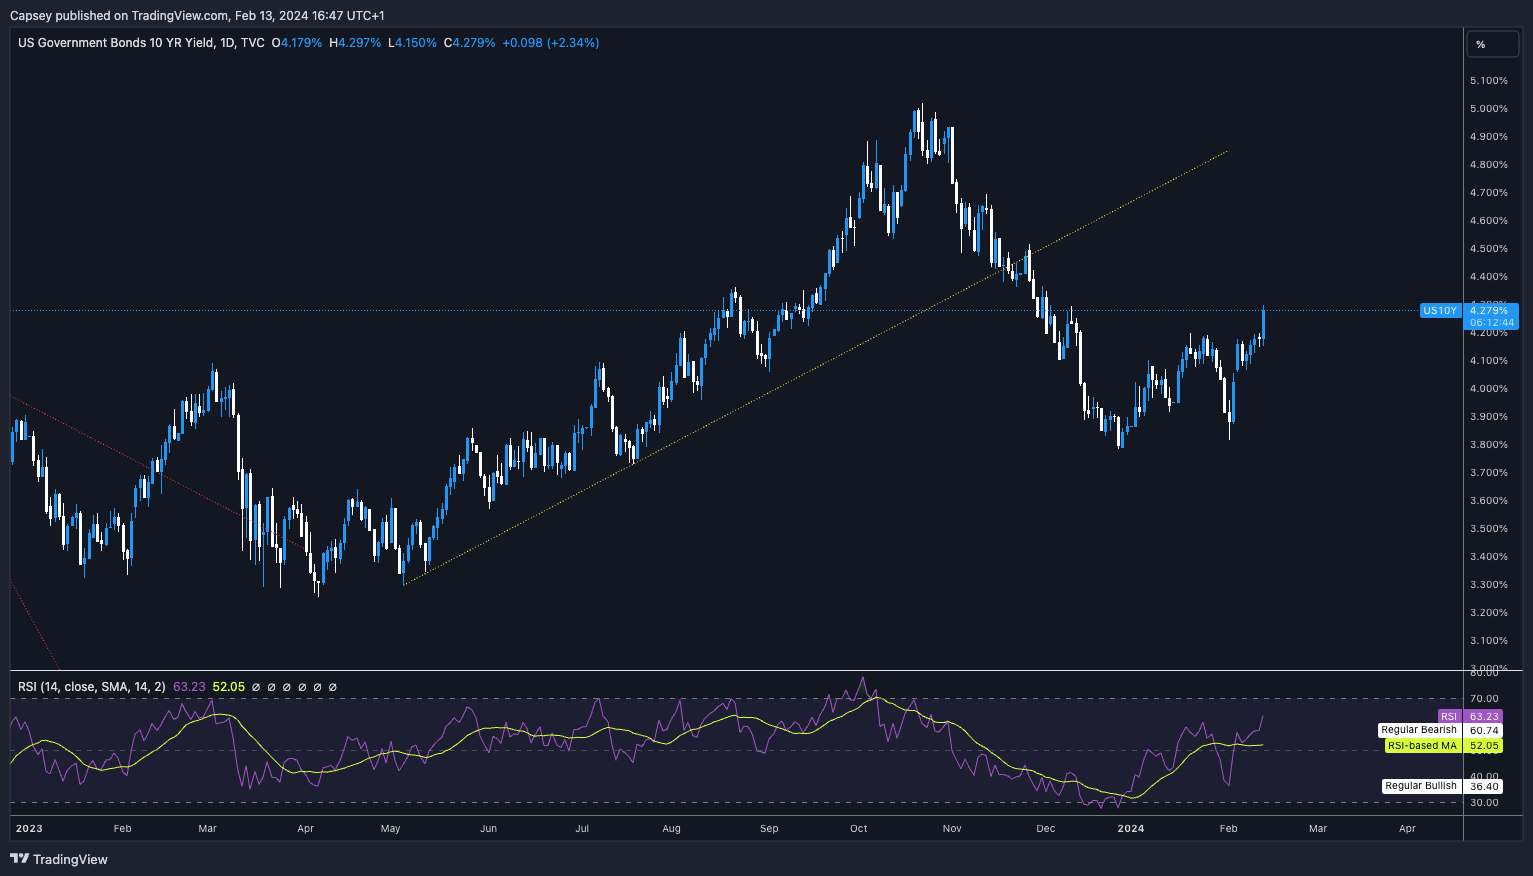
Following the hotter than expected Inflation data that came out today, we have seen the Dollar and Bond Yields all break higher.If inflation does move higher in the coming months, the Fed will likely continue to push rate cuts out and may not begin cutting until Q4 2024. The reason is that the Fed won't want to cut rates into rising inflation.
Even though the Dollar and Yields can move higher over the coming months, risk assets may still be able to be strongly supported by the fiscal spending. Therefore, meaningful dips should be bought.
DXY
US 2Y
US 5Y
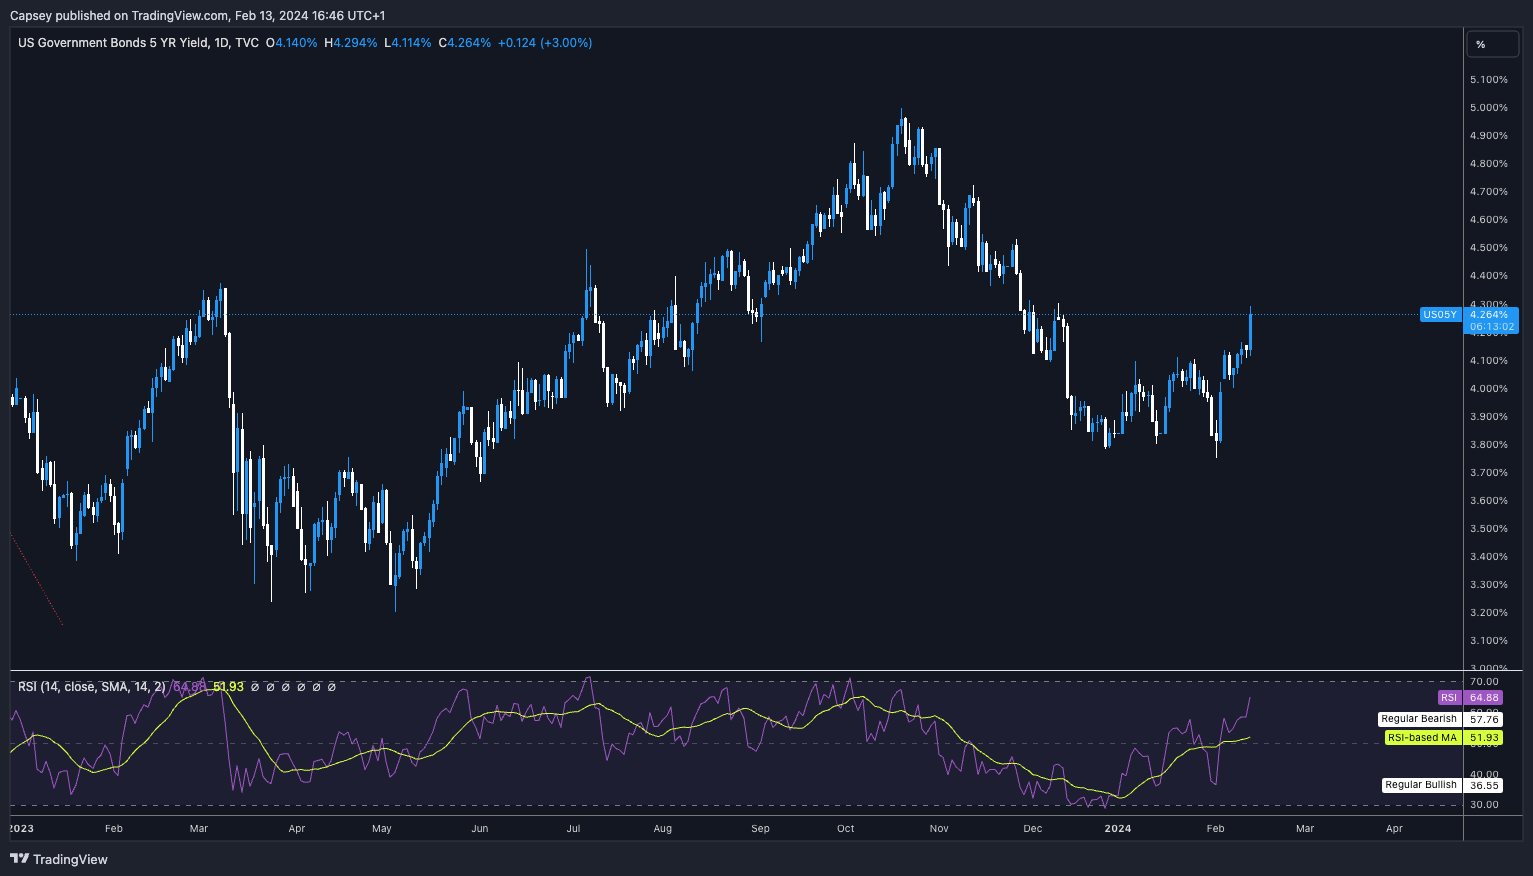
US 5Y
TLDR
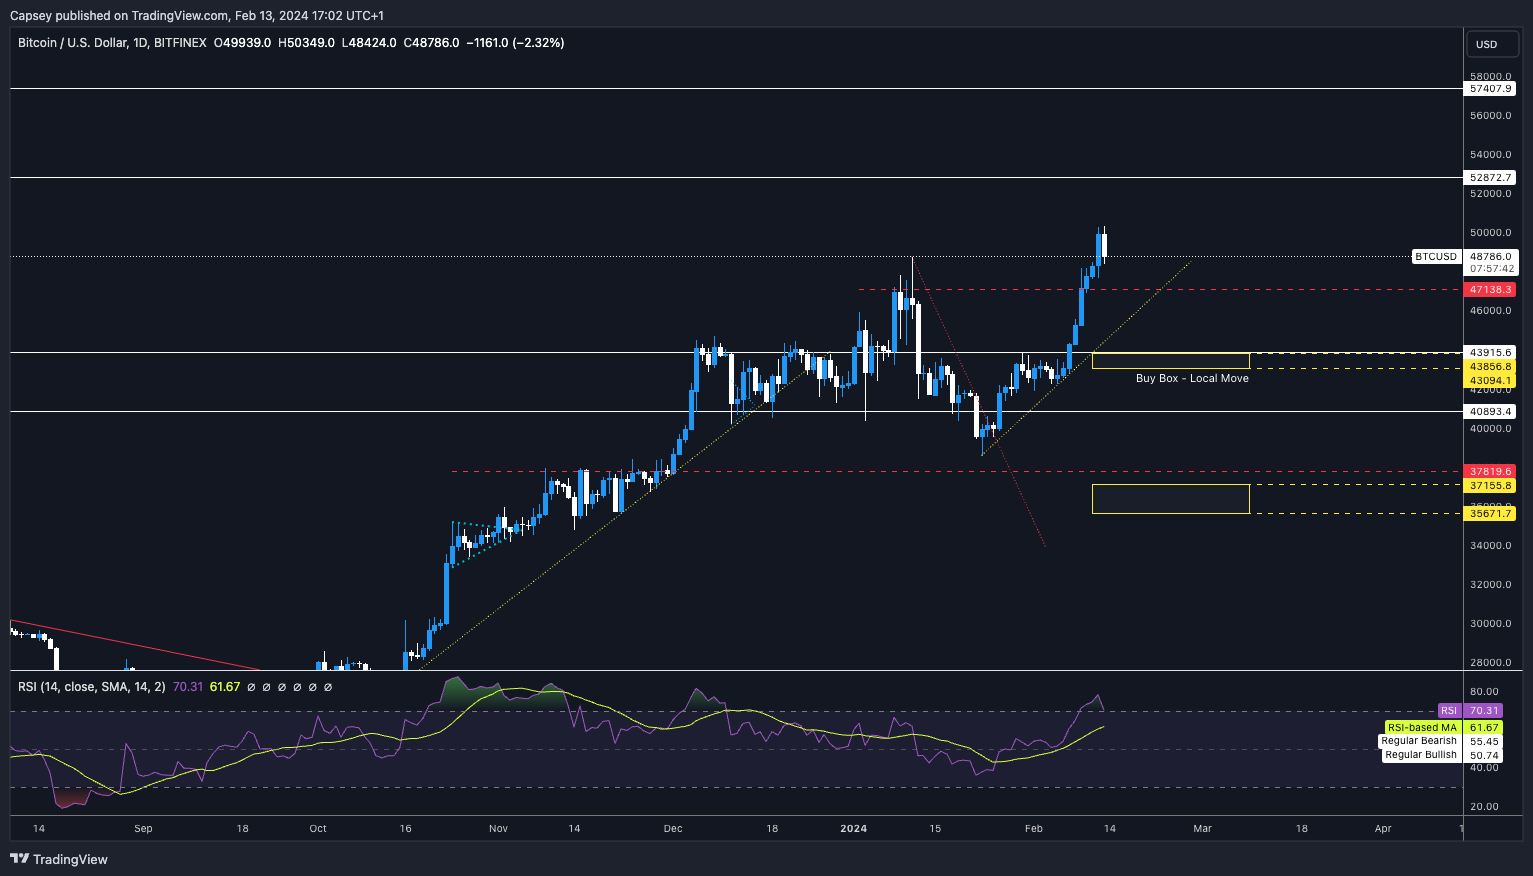
- Bitcoin continues to display resilience and hold critical support around $44-45K.
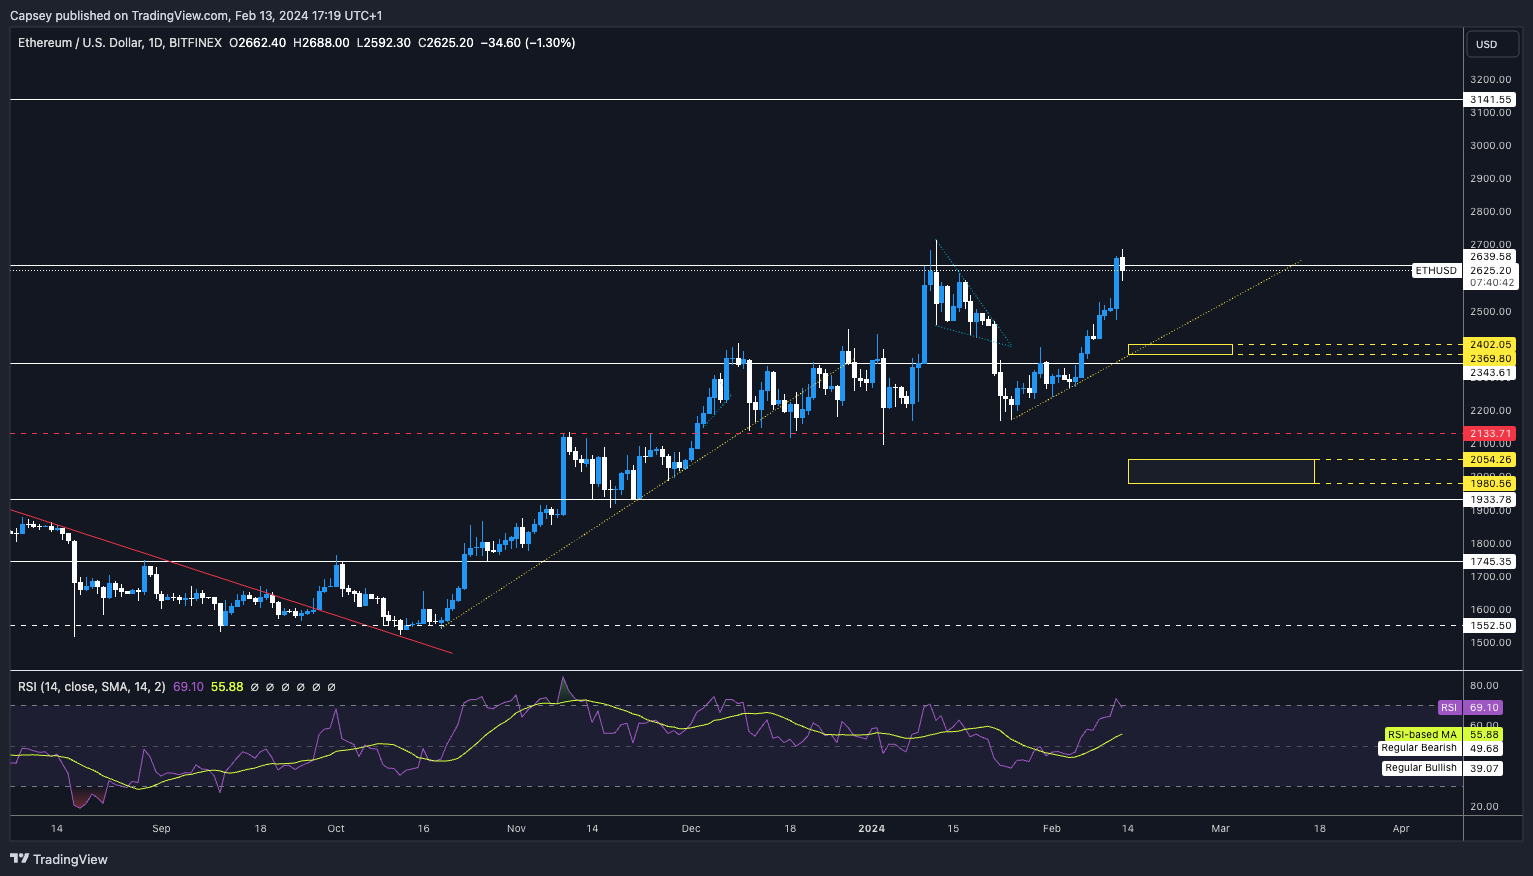
- Meanwhile, Ethereum nears a potential breakout targeting $3,140 as it recaptures key technical levels.
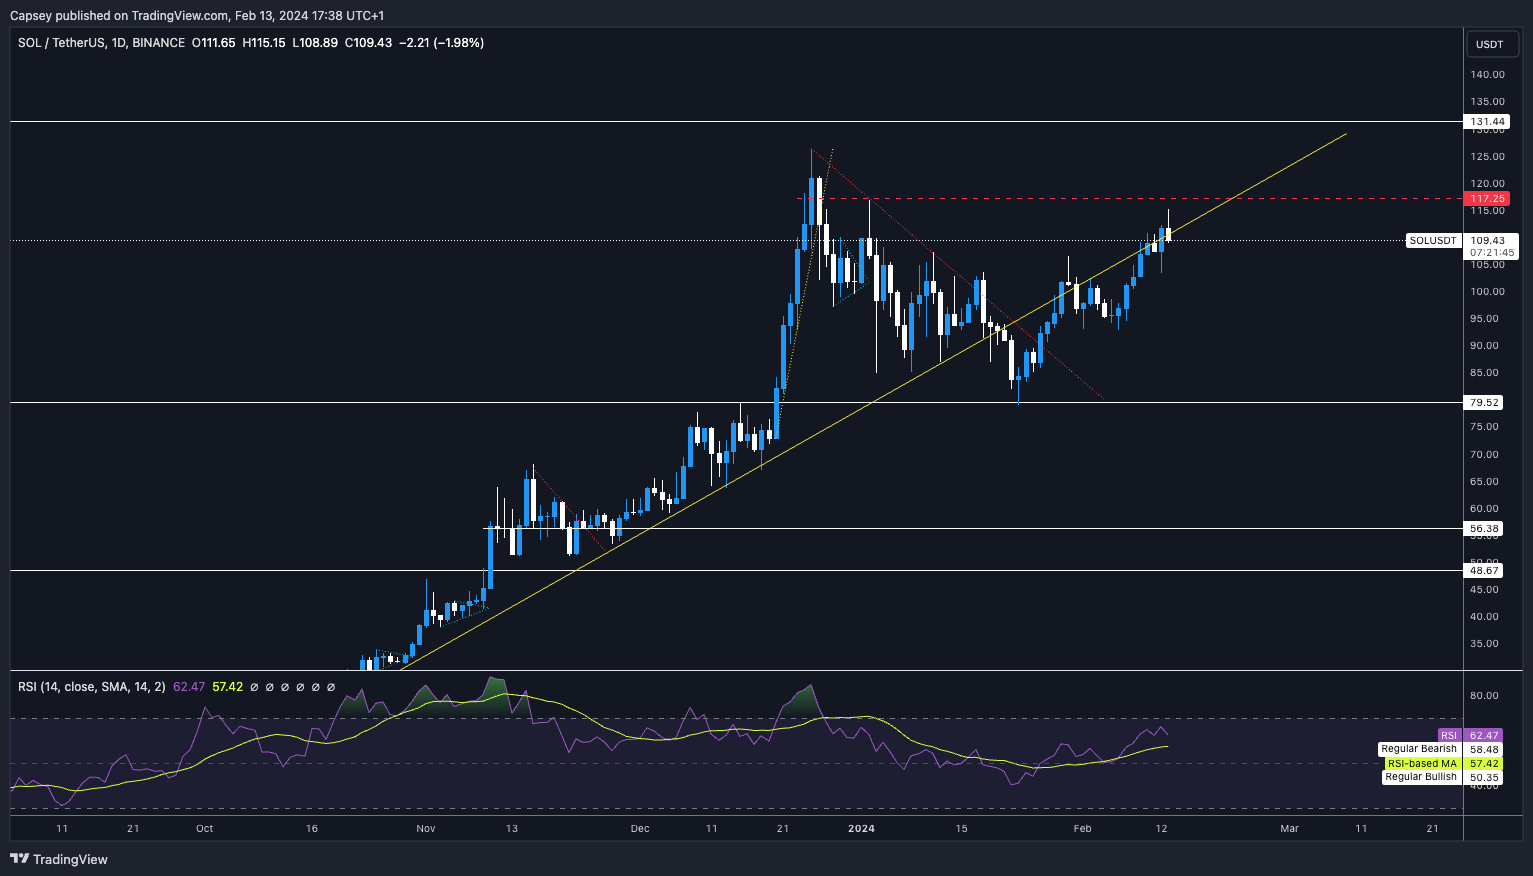
- Solana also remains a top performer primed to continue outpacing the broader market, now eyeing a test of local resistance around $117.
- RUNE may see further decline, but it will likely be nothing hugely substantial.
Disclaimer: Not financial or investment advice. You are responsible for any capital-related decisions you make, and only you are accountable for the results. “One Glance” by Cryptonary sometimes uses the RR trading tool to help you quickly understand our analysis. They are not signals, and they are not financial advice.
BTC update
The Open Interest on Bitcoin remains very high, meaning there is a lot of leverage in play at the moment. However, since the Inflation data today, the Funding rate has flattened again, meaning there is still a relatively clean balance between Longs and Shorts, and therefore, this isn't really out of hand here.
Technical analysis
- The move from $43k to $50k has surprised us, as we felt $44k/$45k would be a strong resistance.
- With price breaking to new highs, you'd now like to see the red horizontal line at $47,100; the old resistance now turned into new support.
- Above the current price, the main resistance is at $57k, with the local resistance at $52,800.
- Price is currently in a local uptrend with a strong support area between $44k and $45k.
- The RSI is overbought on all timeframes, including the Weekly, where it's forming a bearish divergence. This is something to be keeping an eye on here.
Cryptonary's take
Following today's inflation data, we are seeing some risk off in markets. This may lead to a pullback, considering a number of the on-chain data models, along with the technical indicators, are in overbought territory.It will now also be important to see if ETF inflows continue to be meaningfully positive following today's more 'risk-off' data. But, due to the strong fiscal spending, Bitcoin should be bought up on any meaningful dips. The $44k to $45k level would likely be a good long-term entry if price were to pull back.
The main macro buy box is at $35,600 to $37,100. Right now, we struggle to see this being filled. This box will creep up if BTC puts in a new high above $50k.
For now, in the short term, the $44k level is attractive for dip-buying opportunities. Anything below this, we'd suggest being more aggressive with DCA buys.
ETH update
ETH's Open Interest has also dramatically increased over the past few days, going from $7.93b to $8.85b now. The Funding rate had increased to 0.025% but has now reset slightly to 0.015%.This tells us there is a bias to go Long ETH that has built up over the past few days. If this continues, it may become a bearish signal if the trade becomes over-crowded.

Technical analysis
- ETH has had a fantastic bounce, breaking back above the $2,340 horizontal resistance and heading back into the $2,640 area.
- The $2,640 level is a horizontal resistance for ETH; however, a break above would likely see ETH move to $3,140 in the medium term.
- ETH is in a local uptrend with a local Yellow buy box at $2,370 to $2,400, which is just above a key support at $2,340.
- ETH's RSI is more subdued than Bitcoin's, with major timeframes approaching overbought levels but not yet overbought. The RSI shouldn't act as too much of a resistance for now.
Cryptonary's take
Considering we're in a longer-term bull market, dip opportunities should be bought up if we're given them. Therefore, if price rejects at the horizontal level of $2,640, the local Yellow box between $2,370 and $2,400 may act as a good long-term buying opportunity.SOL update
SOL's Open Interest is also up significantly. In bull markets, this is okay and expected as long as the funding rate doesn't get out of hand. For now, Funding is still around 0.01%, so there are signs of positioning becoming overcrowded here.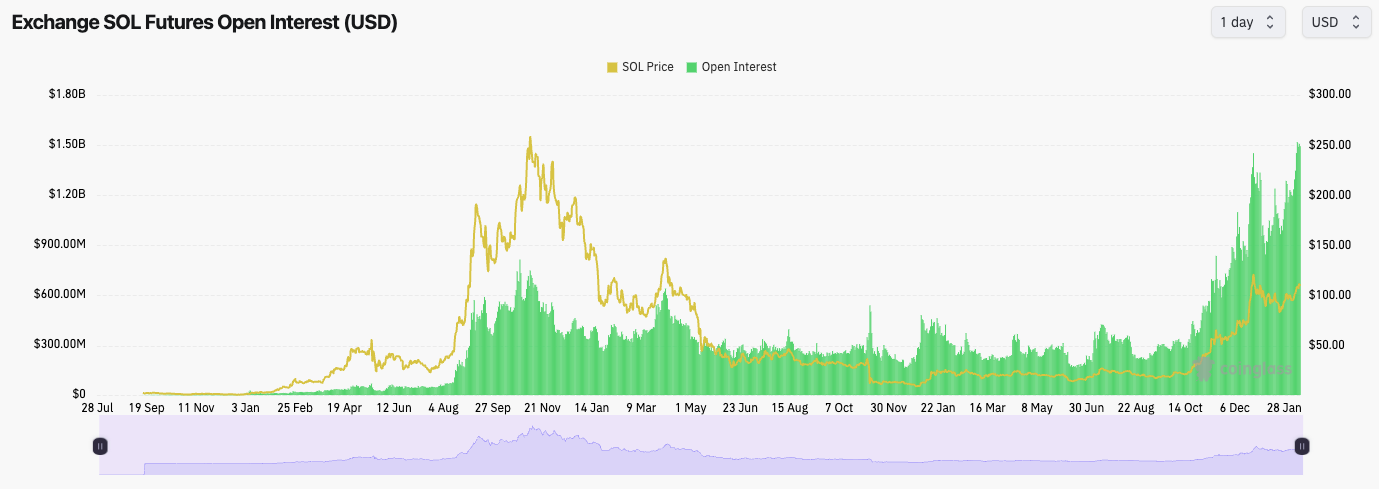
Technical analysis
- Having bounced from the main horizontal support at $79, SOL has struggled to reclaim its uptrend but has continued to grind higher.
- Price is now at a resistance area of $110, with another local resistance at $117.
- $102 should act as support if price declines, with more major support between $86 and $93.
- The RSI is still subdued here, so this shouldn't provide resistance for price currently, as SOL isn't overbought here.
Cryptonary's take
We see SOL as likely being one of the strongest performers of the upcoming bull run, which we think will really get going on the other side of the BTC halving. Therefore, we look to become dip buyers of SOL, particularly if price can pull back to the $86 to $93 level.RUNE update
Technical analysis
- RUNE did very well to break out of its main downtrend line and also its horizontal resistance at $4.78.
- Price has followed our arrows relatively accurately since we called for the move down to the Yellow box. Price is now battling at the horizontal resistance of $5.31.
- If price can break above $5.31, then $5.80 and even $6.53 are possible.
- If price rejects at the current level of $5.31, then $4.78 would need to hold, or we'll see $4.00 again.
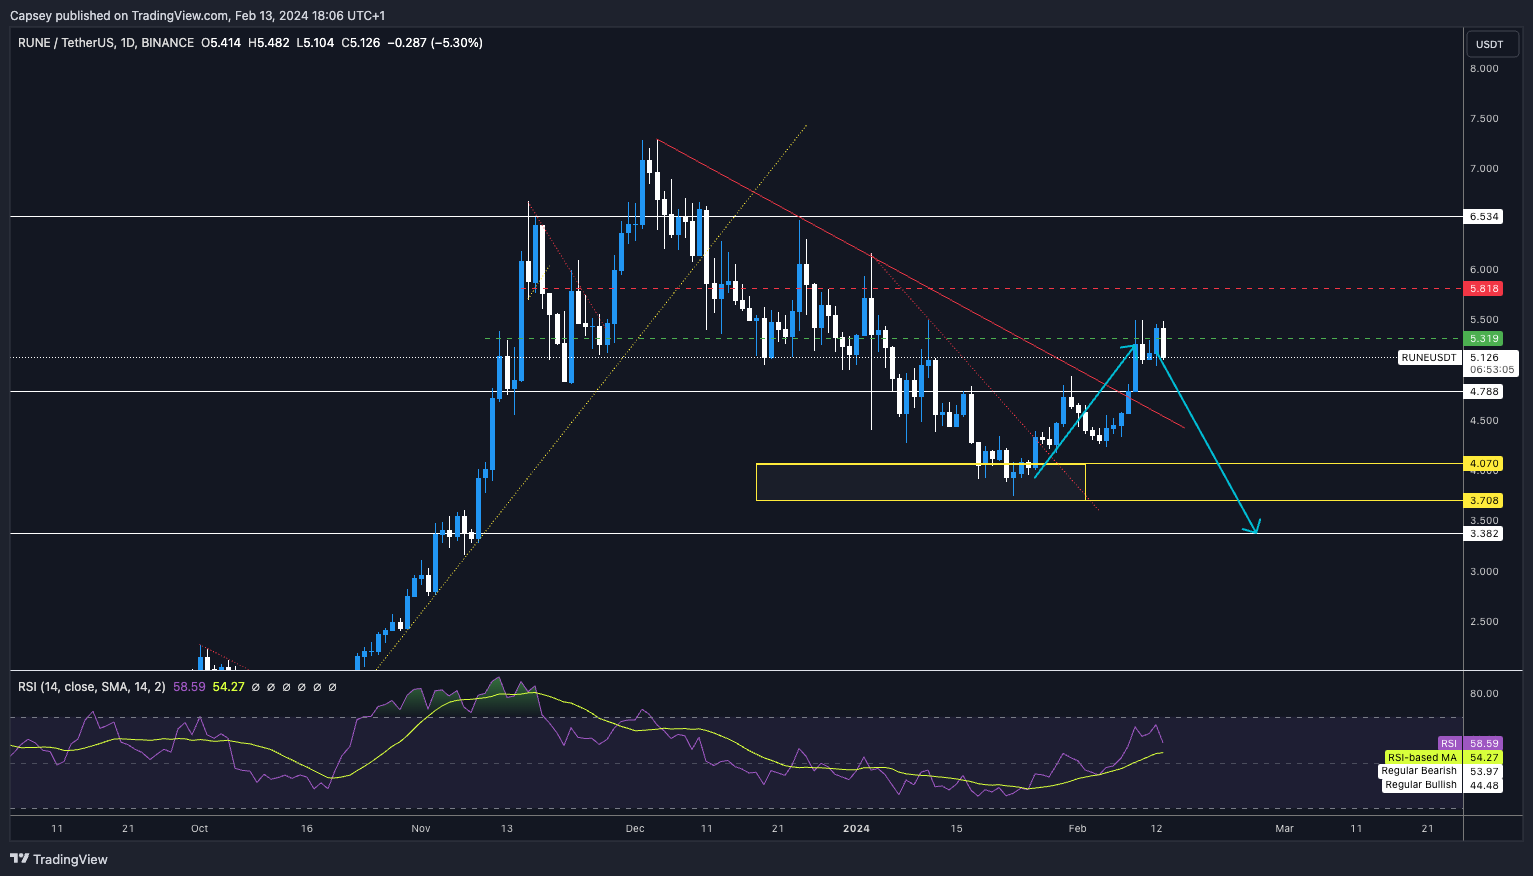
Cryptonary's take
RUNE is a project we're long-term bullish on, and therefore, we maintain our Spot bags.In the short term, we may see a further decline, but it will likely be nothing hugely substantial. The mid to low $4's should be bought for the long-term if price were to make this kind of decline. If RUNE can break out of the current $5.31 horizontal resistance, then there may be a more substantial upside in the short term.
