Save 23% ($351) & Get a Free 1-1 Call with our Team ⏰ : 0d 2h 59m 44s
Disclaimer: This is not financial or investment advice. You are responsible for any capital-related decisions you make, and only you are accountable for the results.
BTC:
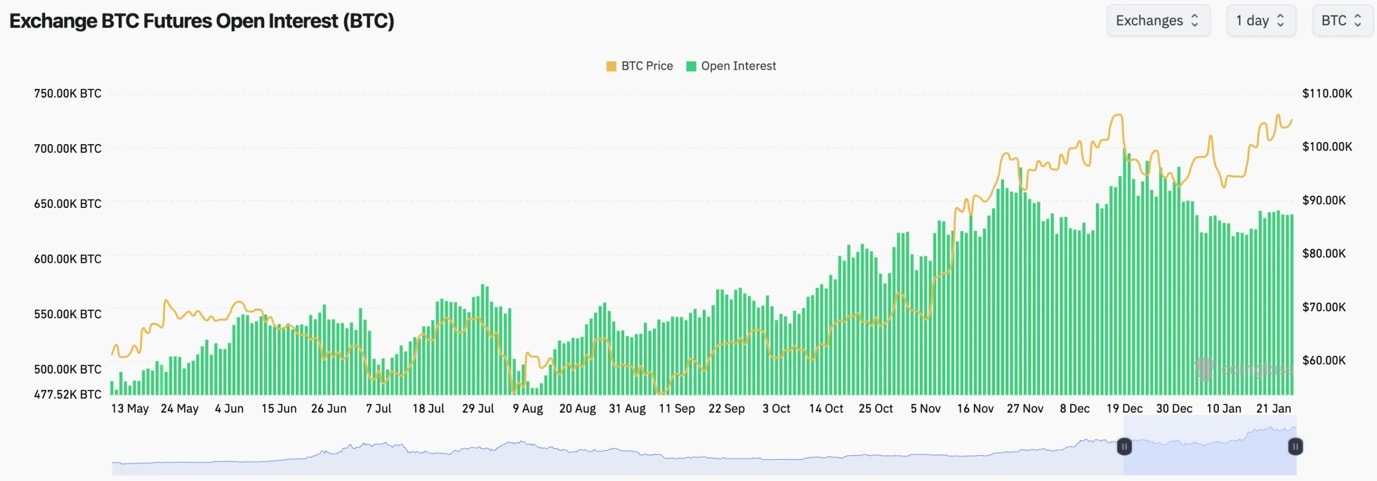
- BTC's Open Interest by number of coins has generally turned a tad lower over the last few days. We had a move-up in OI going into the inauguration, but that's tapered off slightly since.
- The Funding Rate is at 0.004%, indicating there is an even balance between Longs and Shorts currently.
Technical analysis
- Price has broken out of the downtrend line and is now range-bound between the horizontal support of $98,900 (and the psychological level of $100,000) and the horizontal resistance of approximately $107,000.
- We've also had a breakout of the downtrend line on the RSI, but that has also become range-bound whilst also putting in a bearish divergence (higher high in price, lower high on the oscillator). Although, it isn't in or close to overbought territory.
- The key support zone is between $98,900 and $100,000.
- $107k to $108k is the breakout zone to watch out for.

Get the latest Bitcoin price prediction—dive into our detailed analysis to stay one step ahead!
- Next Support: $100,000
- Next Resistance: $107,000
- Direction: Neutral
- Upside Target: $107,000
- Downside Target: $98,900
Cryptonary's take
It's been very tricky trading BTC this week with the market feeling weak at times, but also knowing that any positive pro-Crypto Executive Order could be dropped by Trump at any moment.We've seen a price rally on positive news, but it has had a decreasing effect as the week has gone on. The market had also pulled back when the news was released, and it essentially wasn't the Strategic Bitcoin Reserve. However, each time, the price has seemingly comfortably held the lows of $100k - $101k and bounced relatively swiftly.
Ultimately, this range will probably resolve itself soon. The market at times has felt weak, and the rallies into positive news have faded, which feels like a sign of exhaustion. But, on the other hand, the price comfortably held the lows when it pulled back.
BTC is very evenly balanced here, and direction is really difficult to call. We'd expect that when there is a breakout or a breakdown, it'll likely be a relatively big move in that direction. But calling the directions is super hard here.
ETH:
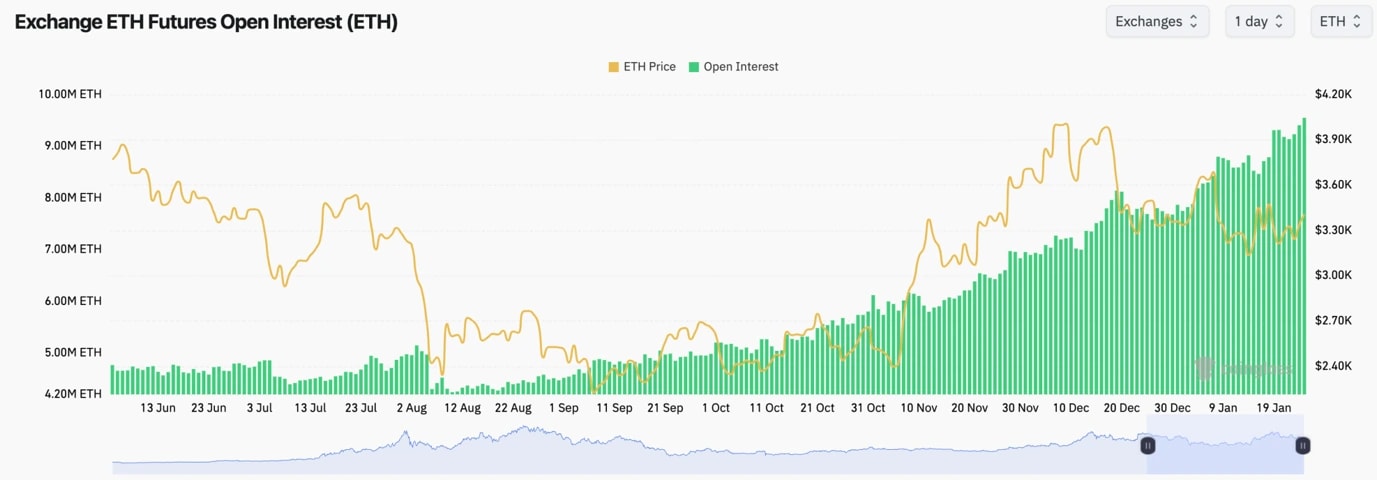
- ETH's funding rate is 0.01%, which indicates an even mix between longs and shorts.
- The Open Interest for ETH remains really high, and alongside that, we've seen Spot purchases not be as strong.
Technical analysis
- ETH is beginning to look more interesting here from a TA perspective.
- We have ETH, having been able to hold the lows/the supports at $3,150, and the price has now reclaimed $3,280 and is pushing onto the main horizontal resistance of $3,480.
- The $3,480 horizontal resistance also converges with the main downtrend line. If the price can break out of these converging resistance areas, then the price will likely swiftly move up to $3,700.
- ETH's RSI is now also battling at its uptrend line and looking for a breakout.

- Next Support: $3,280
- Next Resistance: $3,480
- Direction: Neutral
- Upside Target: 3,700
- Downside Target: $3,050
Cryptonary's take
Key decision time here for ETH. It's managed to hold the lows and move higher, with it now really testing the main resistance levels (the horizontal resistance at $3,480 and the main downtrend line). We need to see ETH get some follow-through here. Otherwise, confidence may be lost again, and we might see a price rollover and retest of $3,050.The key decision for ETH is here. If it can be helped/pushed by the rest of the market, then that's great, as that's what it may need.
SOL:
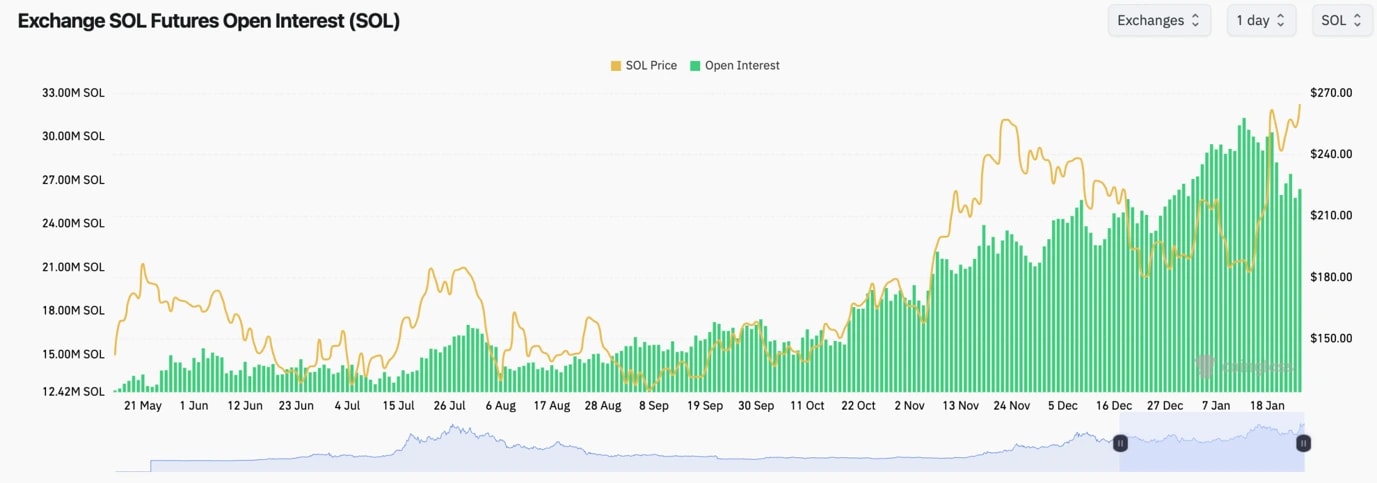
- SOL's Open Interest (by the number of coins) has declined over the last week.
- However, the increase in price has been driven by significant Spot buys, which is very positive and may suggest that a Spot ETF might be approved.
- SOL's Funding Rate is at 0.01%, indicating that there's a relatively healthy balance between Longs and Shorts.
Technical analysis
- SOL is in a really interesting spot here, having exploded higher and then pulled back from the all-time highs of around $300.
- We're now seeing a bullish pennant form into a horizontal resistance, with the price now attempting to break out above it.
- The horizontal resistance for the price to clear above is $263 - $270.
- In terms of downside, $220 to $230 has acted as support, and we'd expect it to continue to do so going forward.
- The RSI is very close to overbought territory, and a new price high would put in the bearish divergence into that overbought territory. However, if this is down to a Spot ETF being approved, then a breakout would have more legs.

Stay updated on Solana price prediction—explore our full analysis for the latest market insights.
- Next Support: $220
- Next Resistance: $260 (then $300)Direction: Neutral/Bullish
- Upside Target: $300
- Downside Target: $220
Cryptonary's take
Other than BTC, SOL is the coin that has shown real strength compared to all the rest. Now, this may be due to a potential ETF approval today, although this was widely unexpected just a handful of weeks ago.We expect SOL to hold its lows, and if the price dips to $200 to $220, that would be attractive enough to us that we'd add to our SOL bags. If an ETF is approved today, then expect a more significant breakout. $300 likely being the target.
DOGE:
- DOGE broke out of its downtrend line, but the rice was rejected into the horizontal resistance that was the old order block at $0.41.
- Price has pulled back, and it is now testing the downtrend line as support, whilst it's also sat on top of the horizontal support of $0.35 (which was prior horizontal resistance).
- It's pivotal that the price holds $0.35; otherwise, $0.30 will likely be tested, and beneath that, there's not a lot of support until around $0.20, so it's a really key level to hold.
- The key level for price to break out from is the $0.40 to $0.415 range. This would likely send the price back to the highs.
- The RSI has been range-bound and in a middle territory. However, currently, it is struggling to get above its moving average, meaning some downside might be possible.

Curious about DOGE's next move? Our DOGE price prediction offers a deep dive into market trends!
- Next Support: $0.35 (then $0.30)
- Next Resistance: $0.40 to $0.415Direction: Neutral
- Upside Target: $0.415
- Downside Target: $0.30
Cryptonary's take
Like BTC and the rest of the market, price action has been whip-sawing, and from a zoomed-out perspective, it's pretty boring. We'll ultimately wait to see how DOGE and its range resolves itself.But a BTC moves down beneath $100k, and that could spell pain for some of these ALTS/Memes. For now, though DOGE is in an ok spot, it just needs to hold these key horizontal supports.
If BTC can hold up, then it's possible we will see DOGE move up from its current support back to $0.40. That'll then be the testing point as to whether it can break out or not. But again, this is another that's hard to call and likely just dependent on which way BTC breaks.
HYPE:
- HYPE has had its more major pullback following its large move-up on inception.
- We've now seen HYPE hammer out what looks like new support between $19 and $20, and the rice has potentially begun a new uptrend from there.
- HYPE is now battling its local resistance between $23 and $24. A breakout of this level can see HYPE revisit the low $ 30s.
- The RSI is also now interesting as it's in the middle territory, and it's bouncing off its moving average.

- Next Support: $19 - $20
- Next Resistance: $24
- Direction: Bullish
- Upside Target: $32
- Downside Target: $18
Cryptonary's take
From a technical point of view, HYPE looks good here to go higher in the short term, particularly if it convincingly breaks out beyond $24.What might prevent this from happening is if there is a nasty BTC rejection, for instance, and that ends up bringing the whole market down with it. We're open to the idea that BTC can have a pullback, but we don't think there will be a 'nasty pullback/rejection.'
SPX:
- It's possible that in the very short term, SPX has double-topped. This is until it can find a new local support and put in a higher low.
- The price was rejected at $1.60 for the second time, and it was holding the $1.40 level briefly. We were hoping local support would be formed there that could then aid the price in breaking out to new all-time highs, but not this time.
- The next local support is at $1.20, so we'll be looking there for bids to come back in again.
- To the upside, $1.60 is the key level to break above.
- We still don't think we will see sub $1.00, at least anytime soon. And beyond that, we feel quite safe that we won't see a price break below $1.00 and move into $0.75.
- We also note that in the last few days, volumes have been positive, which is good to see.
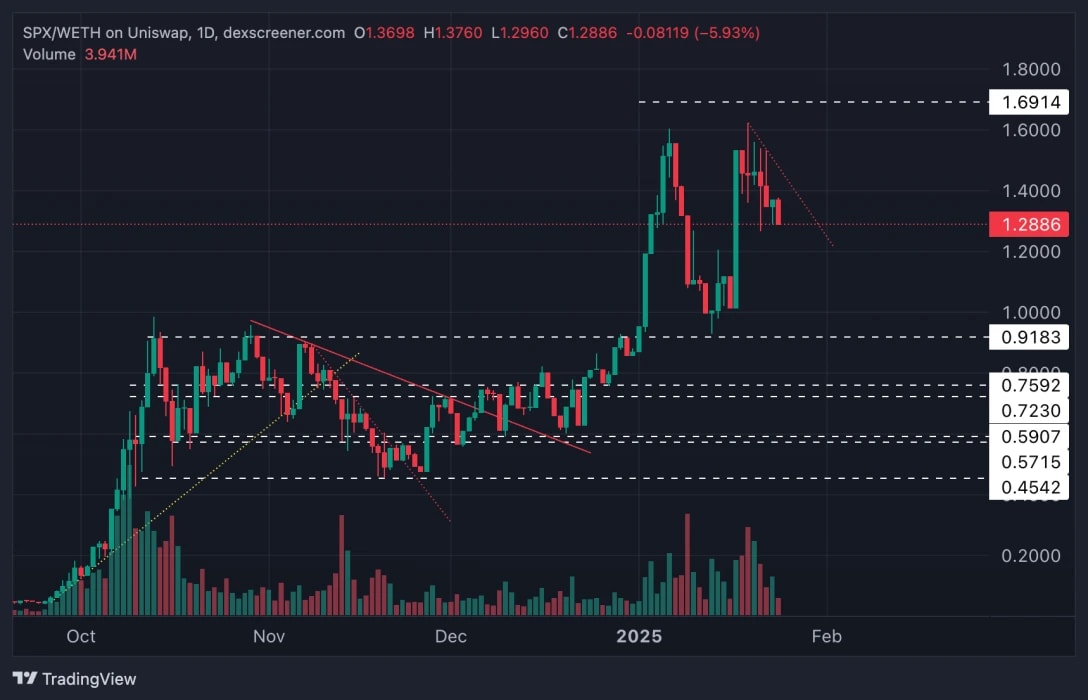
- Next Support: $1.20Next Resistance: $1.60
- Direction: NeutralUpside Target: $1.60
- Downside Target: $1.00
Cryptonary's take
Despite the rejection from $1.60, SPX is still holding up well. In the short term, we'd like to see $1.20 held as new support and, therefore, put in that higher low for SPX. It's possible the market continues to be whip-sawed by BTC, but even in this previously, SPX has seemingly held up well, so that's another positive to take.In the short term, we're essentially looking for SPX to hold the $1.20 area and bounce convincingly from there.
Recommended from Cryptonary


