Save 23% ($351) & Get a Free 1-1 Call with our Team ⏰ : 0d 2h 59m 44s
BTC, SOL, and alt/memes: Charts, trends, and dollar impact
Today's Market Update is going to be slightly different in that, in the last week or two, we haven't had bundles of data to digest, and markets have been interrupted by a lot of Holiday days. This also means traders are away, markets are thinner (volume-wise), and therefore, you can get some overly extreme moves that perhaps don't fairly reflect how the market should be priced.
Let's dive into it all from a chart perspective, where we start seeing more meaningful macro data being released again.
In this report:
- Macro charts.
- BTC charts.
- ALT/Meme charts.
- Cryptonary's Take.
Disclaimer: This is not financial or investment advice. You are responsible for any capital-related decisions you make, and only you are accountable for the results.
Macro Charts
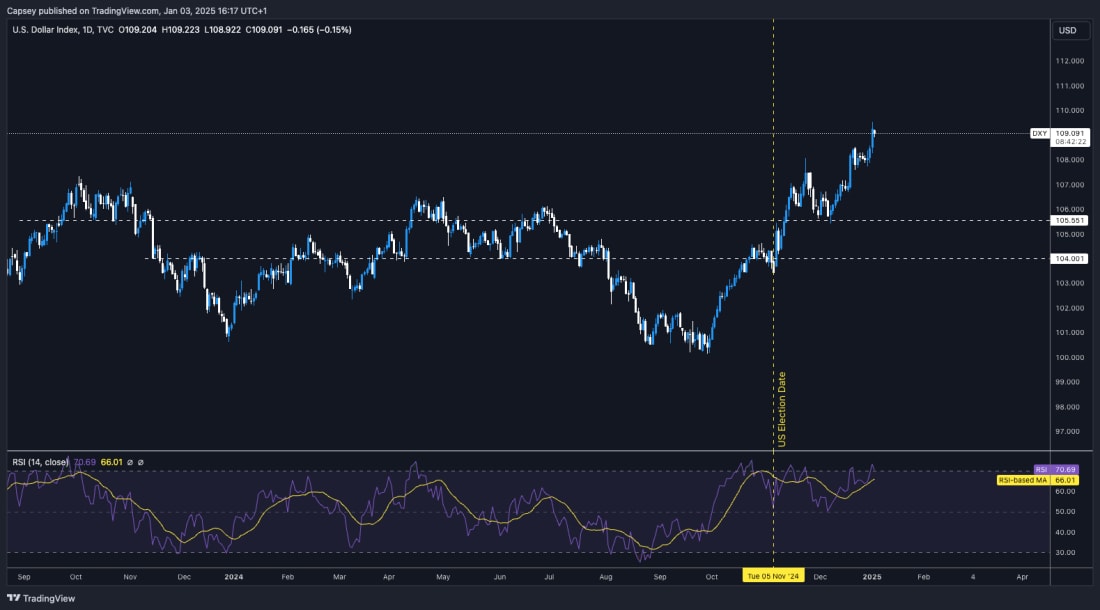
We'll start with some of the macro charts. We've covered the DXY (the Dollar Index) and the S&P in recent updates. The DXY is showing strength as the market prices in Trump and his policies.However (and we've covered this in prior updates), we may be approaching the point in the next few weeks where the Dollar (DXY) is too strong, and we see it reverse - it's currently quite overbought. This would be a relief to risk assets (the S&P). Refer to the Market Update we published on 28/12/24 for a more detailed breakdown of this.
$DXY 1D timeframe:
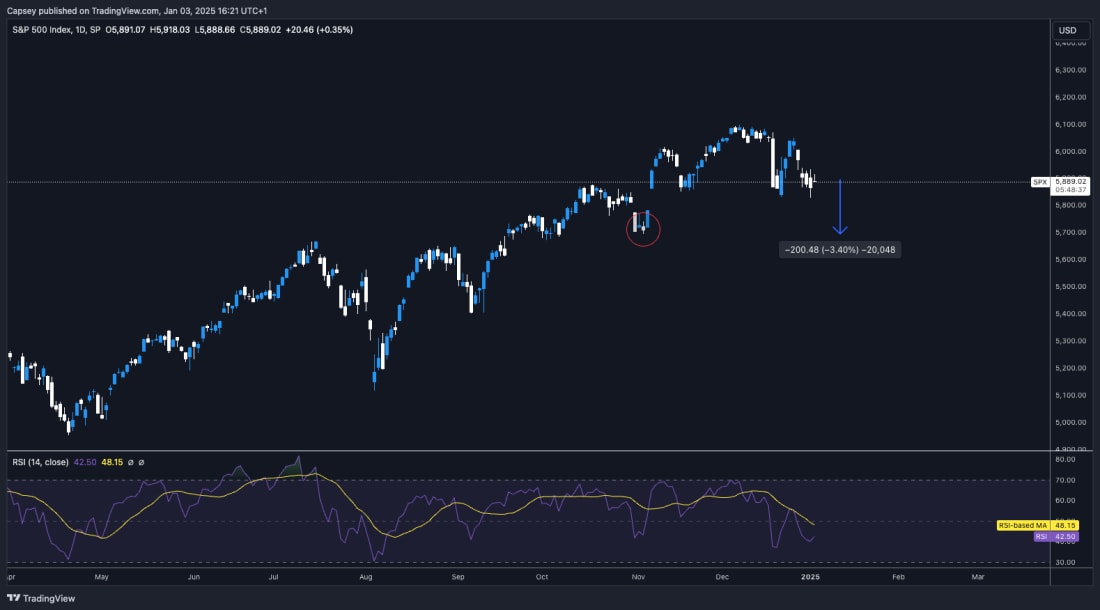
$SPX 1D timeframe: The S&P has struggled over the last month as the Dollar has strengthened. It's possible the S&P will move lower in the coming weeks, but we do expect a low to be put in in January, and we're confident that a low isn't below the November 4th low (red circle). So maybe there's potential for another 1-3% move lower.
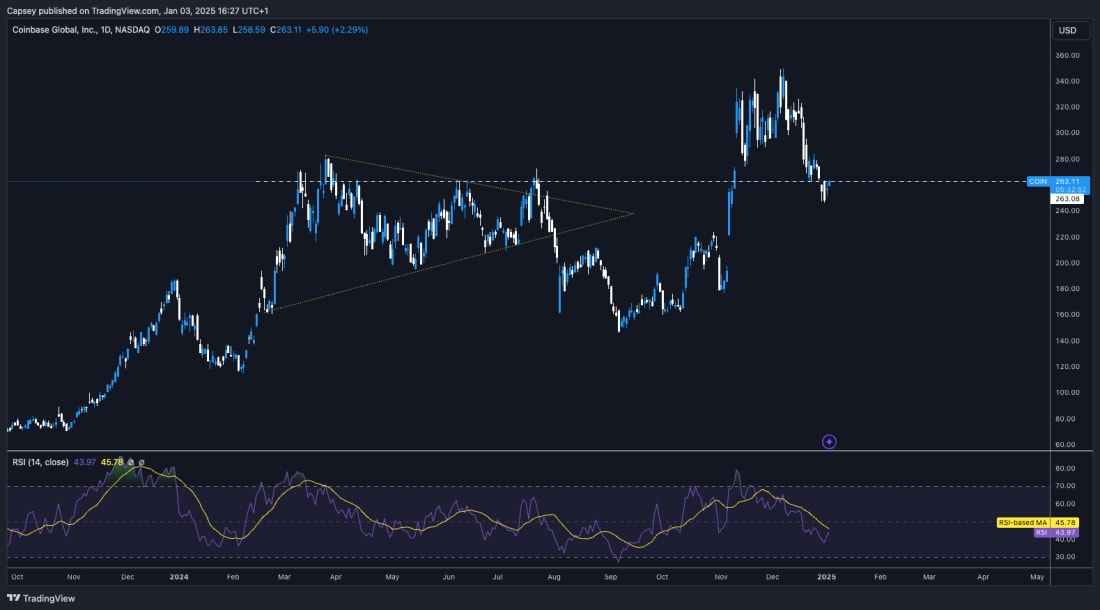
The strengthening Dollar has also impacted some of the more macro Crypto charts (Crypto stocks). Coinbase was down 29.6% since early December, whilst Mara Holdings (Crypto Miner) was down 45.0% since Nov 29th.
Coinbase 1D timeframe:
Mara holdings 1D timeframe:
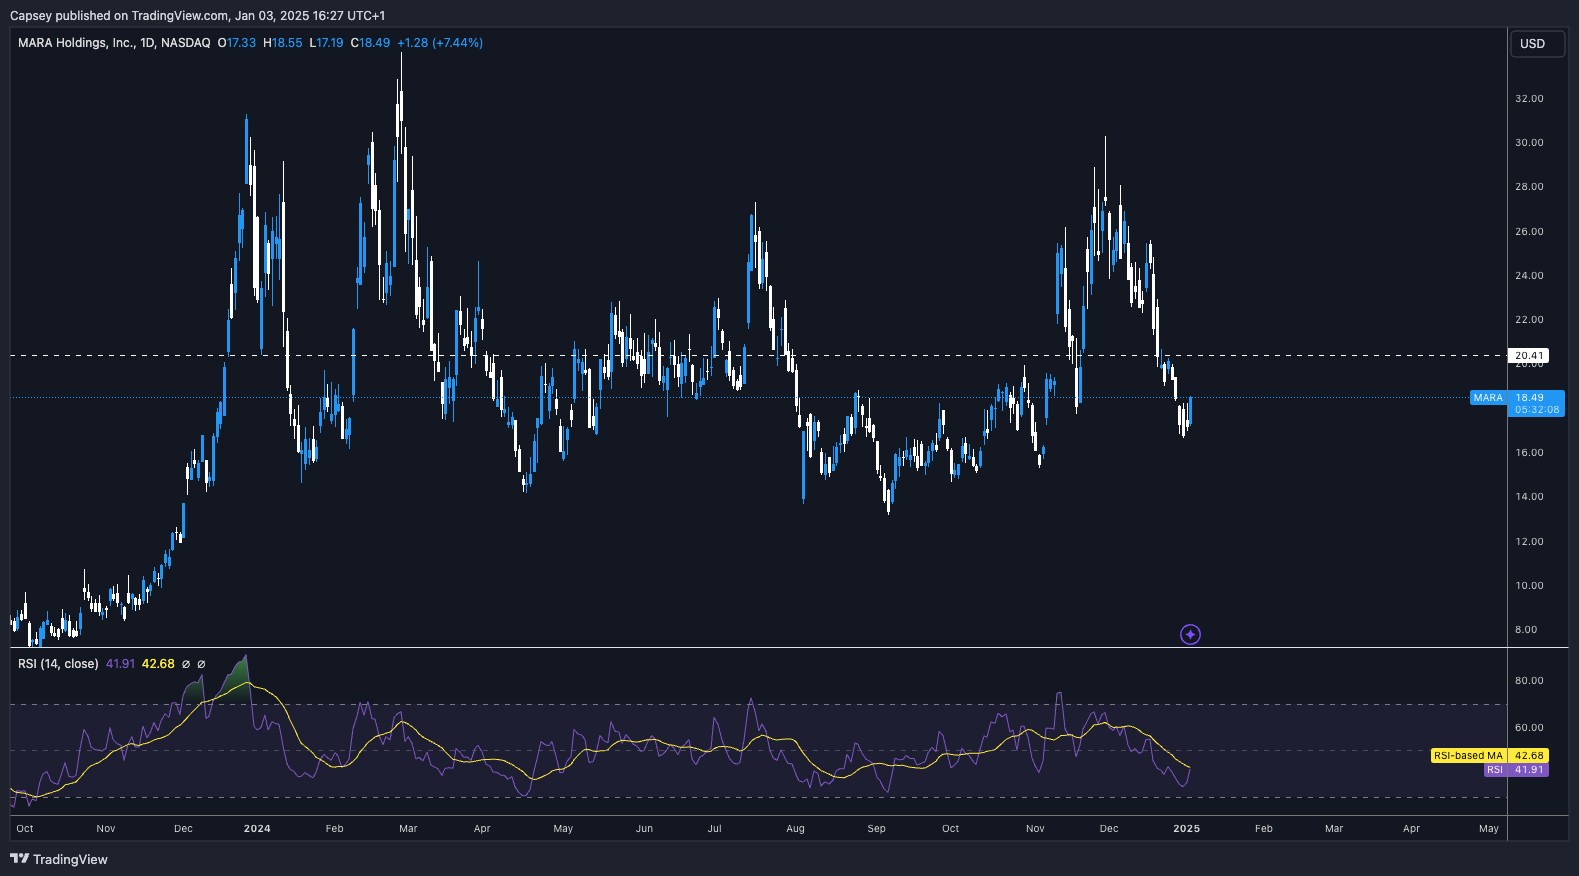
Our point is this: maybe a strong/strengthening Dollar is close to being fully priced now - assuming Trump doesn't come in and go above and beyond with these tariffs that he's threatening. We expect tariffs to go on, but it's the degree to which they are strong.
Too strong, and the market will likely price for the Dollar to continue going higher. However, we're not expecting this, and our thinking is that Trump's policies and, therefore, the Dollar are close to being fully priced (strength-wise). The result of this would be; Dollar retracing and risk assets getting some relief (upside).
We now have the view from a macro/top-down lens. Let's now dive into BTC and some more of the Bitcoin charts.
BTC Charts:
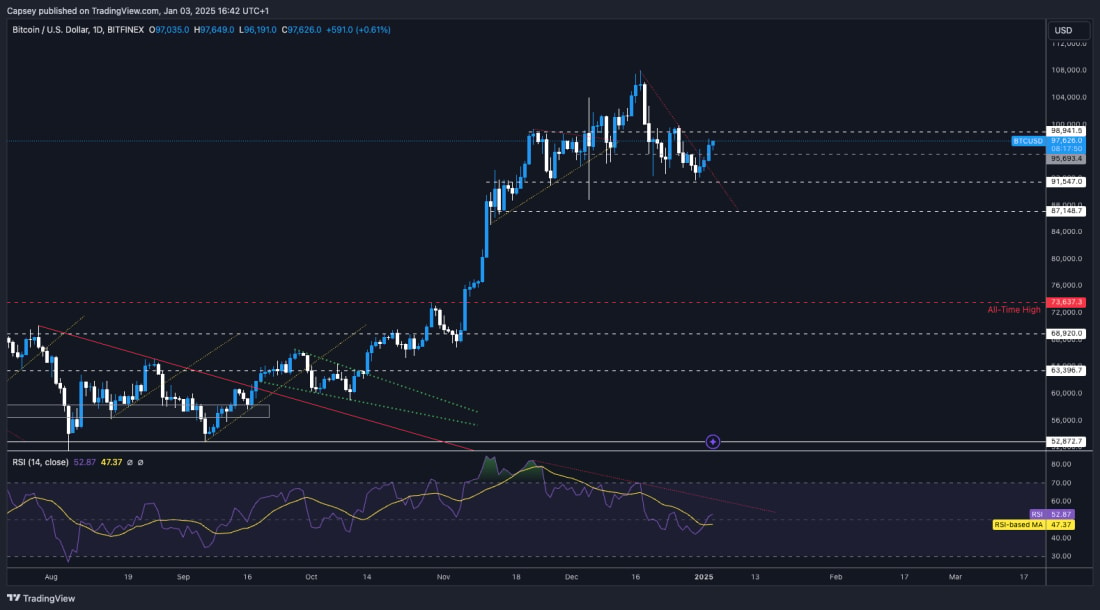
We'll kick off with the BTC price chart.Considering the above, BTC has looked great under these conditions throughout December. We hit a new all-time high at $108k, and we've then seen a 14.9% pullback, to which we're now bouncing. This isn't too bad at all, really, especially when you look at Coinbase and Mara Holdings charts as comparisons.
BTC has now broken out of the local downtrend line (positive), but the price still remains in the range between $91,500 and $98,900. A clean break out above $98,900 and then $101,700 is what will get us really excited again.
BTC 1D timeframe:
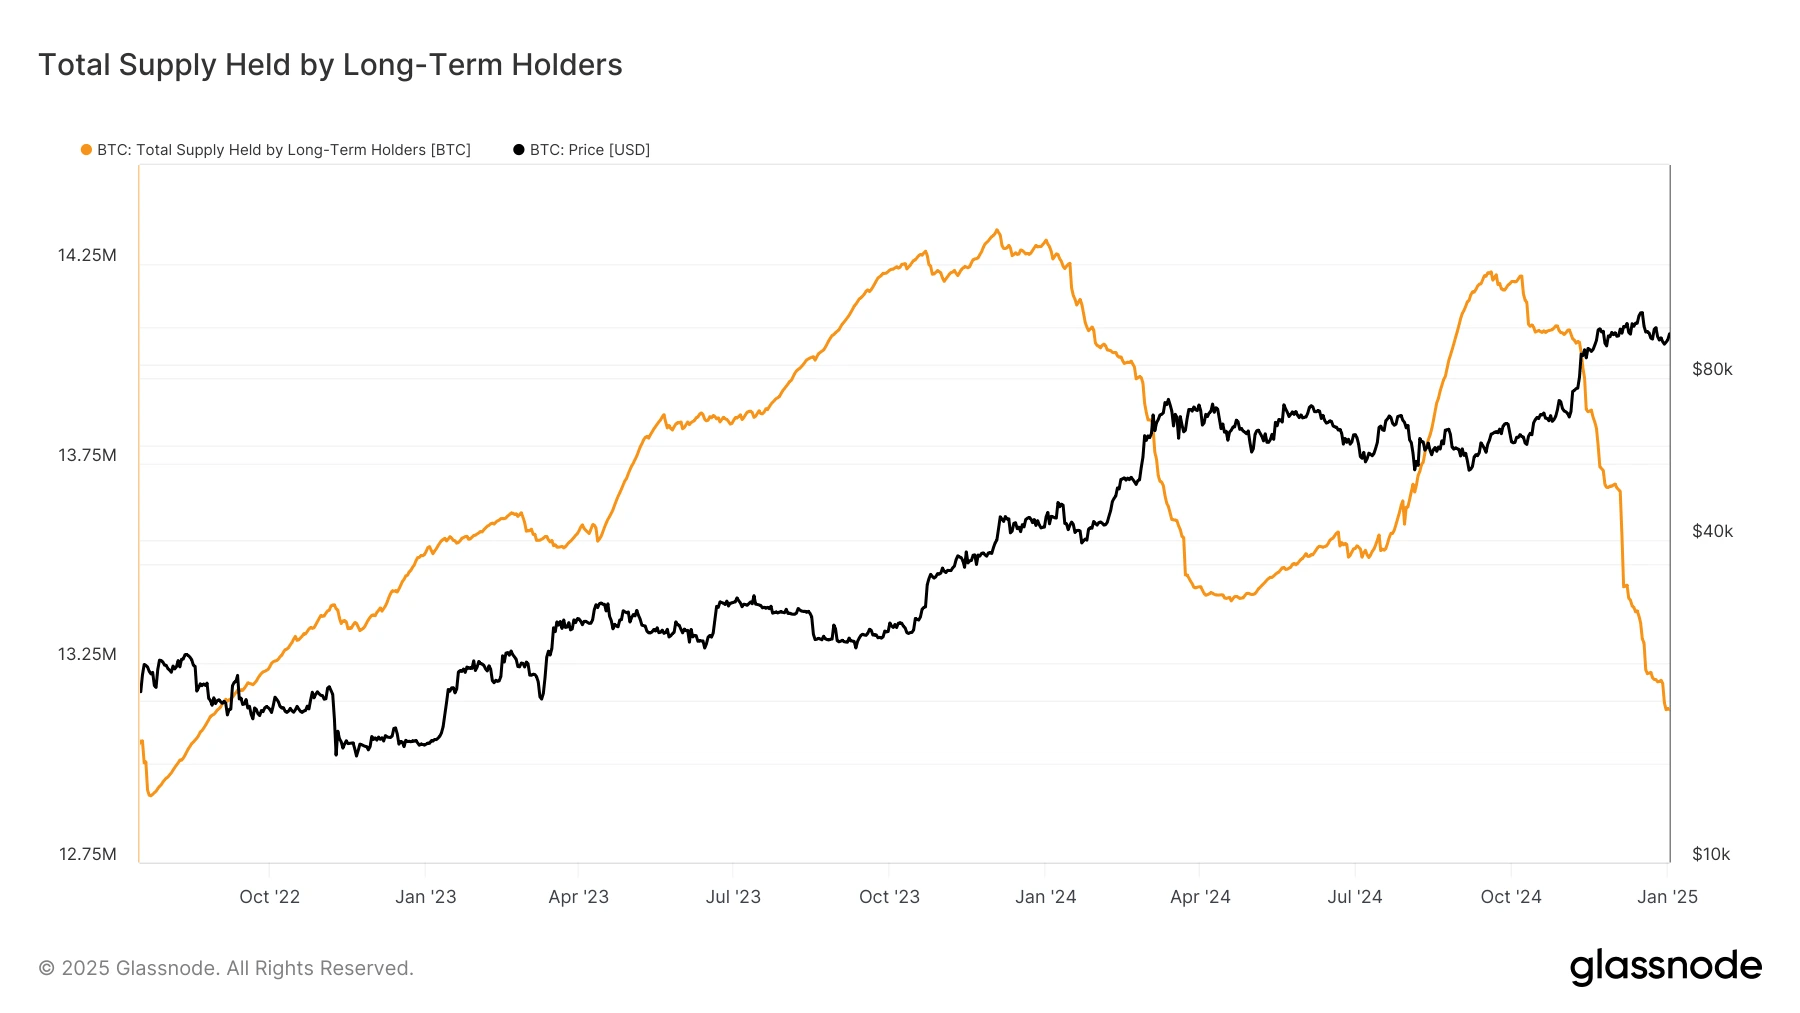
In the last few weeks, we have seen Long-Term Holder selling. However, Short-Term Holders have increased buying and counteracted this rather significant selling from Long-Term Holders.
Long-term holder supply coming down:
Short-term holder supply is increasing, and therefore absorbing the Long-Term Holder coins that are being distributed:

Ultimately, the fact we've seen this amount of Long-Term Holder selling being absorbed, we think you have to take as positive. What we now want to see over the coming weeks is a follow-through. That'll be some risk, and for this, we'll look at the ETF, and we'll want to see net inflows.
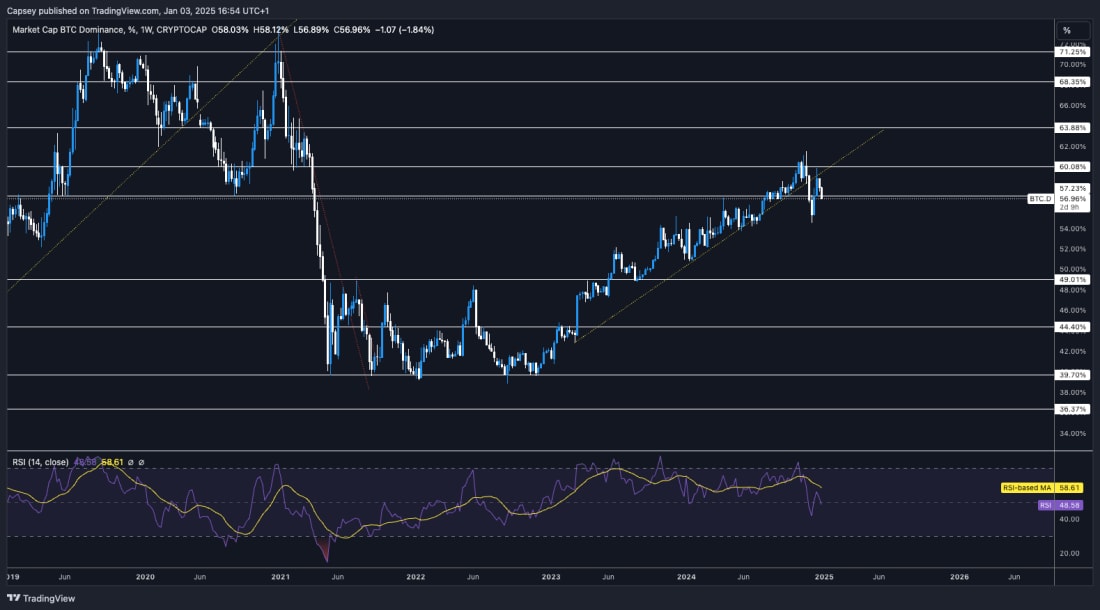
The last chart under the BTC section we'll look at is Dominance. BTC Dominance has seemingly peaked at 61%. Dominance has then broken below its main uptrend line and the horizontal level of 57%.
We've had a retest of the underside of the uptrend line and the 60% horizontal level, which the chart has rejected. If you're bullish on Alts/Meme, this is exactly what you want to see: a breakdown in BTC dominance, which it looks like we're at the beginning stages of.
BTC dominance weekly timeframe:
We'll now move on to the Alt/Meme charts.
ALT/Meme charts
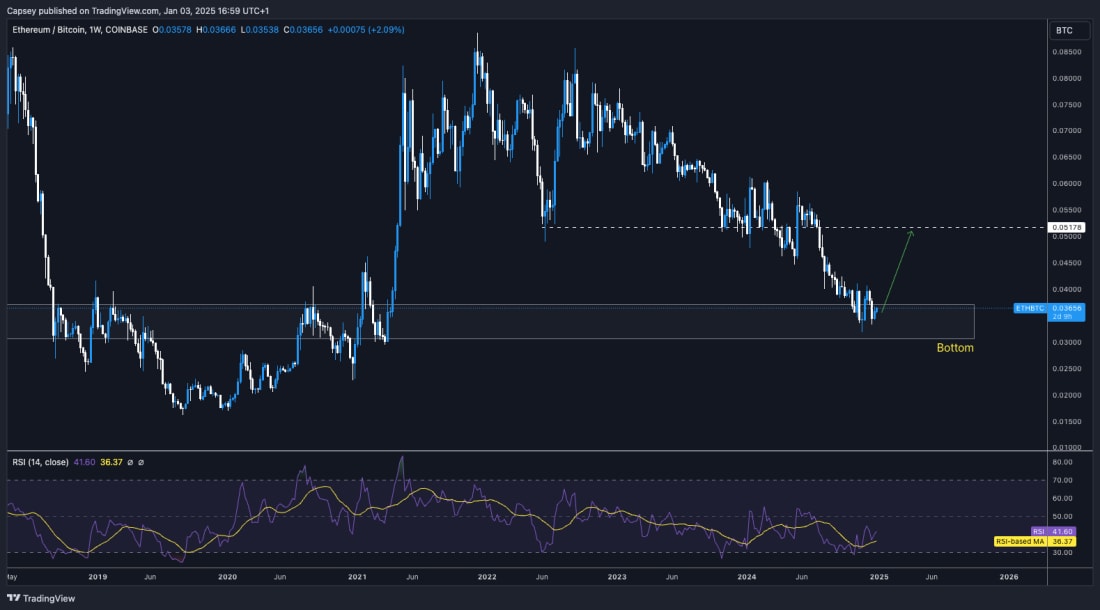
When assessing the Alt/Meme market, ETH/BTC is still one of the first charts we'll look to, so that's where we'll start.To us, this chart looks bottomed. You have the RSI moving out of oversold territory and reclaiming back above its moving average, but still with plenty of room to move higher. We wouldn't be surprised to see this chart rebound to 0.045 (minimum) , but maybe as much as 0.05 by the end of Q1.
ETH/BTC weekly timeframe:
If we now look at Total3 (the total Crypto MCap excluding BTC and ETH), we can see that it's breaking out from a downtrend line, whilst the RSI has been majorly reset, and it's now breaking out. Overall, this looks great, and we expect more in the coming weeks/months. We'll attach a zoomed-in and a zoomed-out version.
Total3 1D timeframe zoomed in:
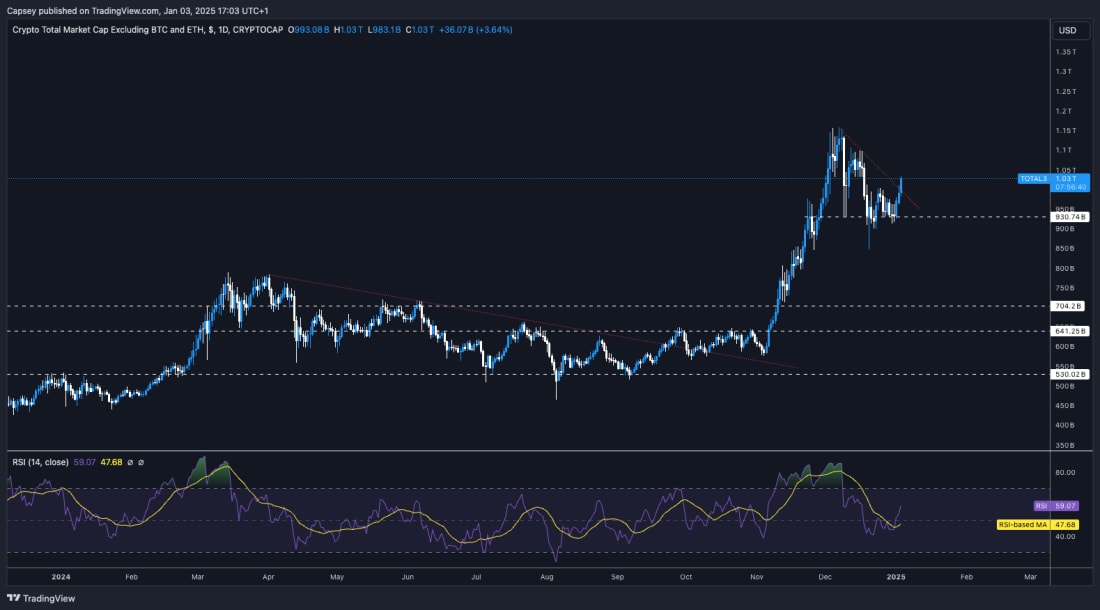
Total 3 3D timeframes zoomed out: Looks good for higher over the coming months.

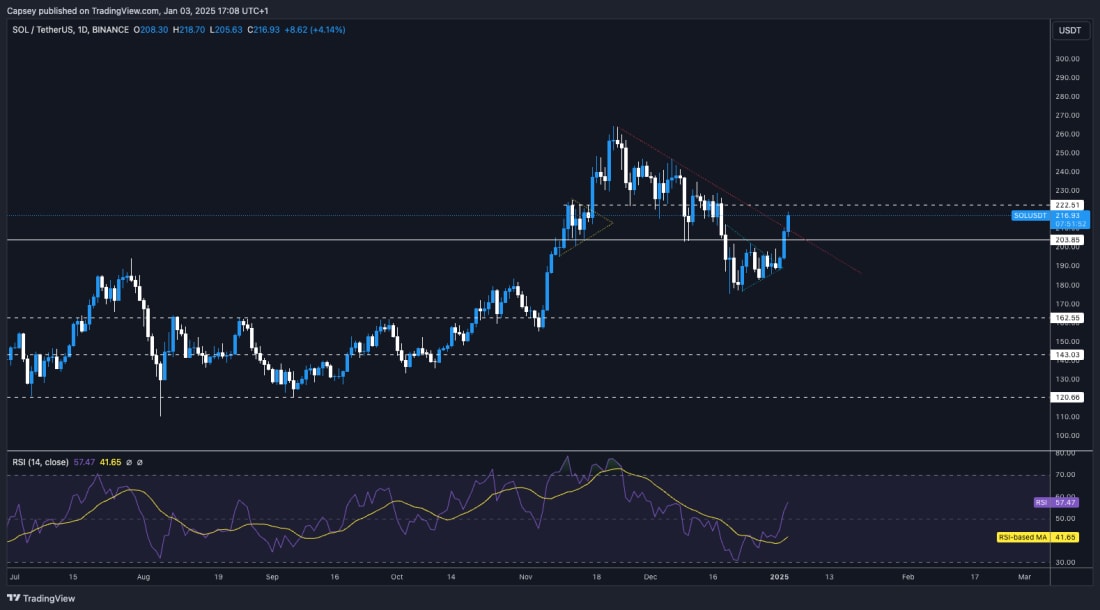
If we now turn to SOL, we can see that it's broken upwards from its pennant (as we expected and called for in the recent Market Direction). Price has also seemingly broken above its downtrend line and reclaimed the old range between $203 and $220.
Now, we're sceptical of a breakout above $220 in the short term, but we've had a nice rebound, which is positive, so we're now looking for a price to consolidate back in this old range (between $203 and $220).
SOL 1D timeframe:
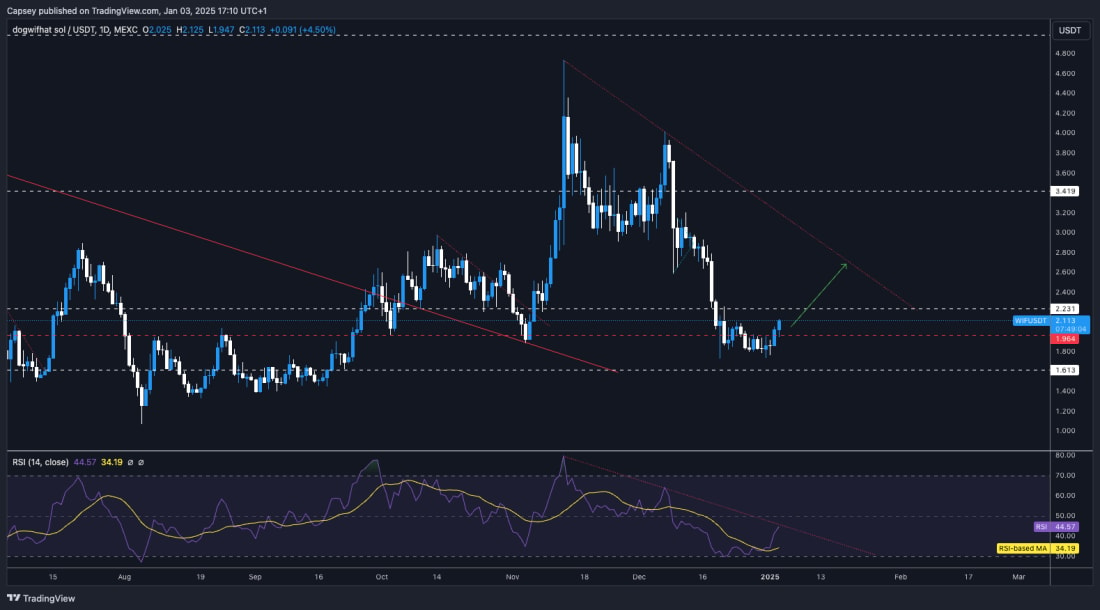
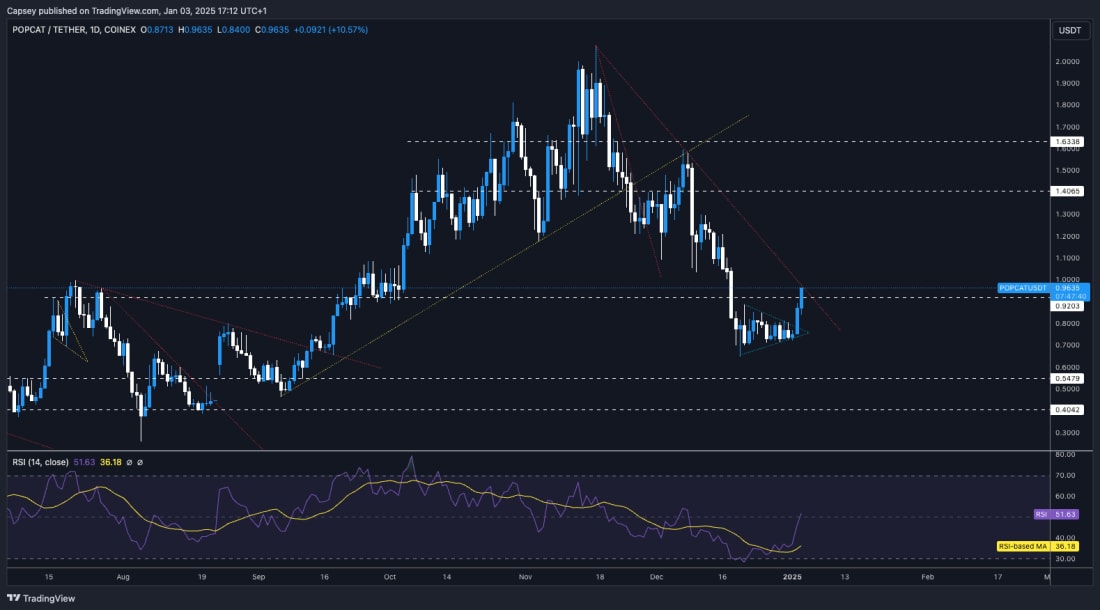
If SOL can consolidate in the old range (between $203 and $220), we think this can then see life move back into the major SOL memes, WIF and POP, and they can get a more substantial rebound. We see the current rebound as nothing spectacular, so we are expecting a further/stronger rebound in the coming weeks.
WIF 1D timeframe:
POPCAT 1D timeframe:
Cryptonary's take
Digesting all the above, it's possible a lot of the strong dollar/risk-off price action we've seen due to the market pricing in Trump policies has potentially already been priced in. As a result, we're now potentially beginning to see the rebound in Crypto before we get it in TradFi, which isn't uncommon anymore. With Crypto being at the furthest end of the risk curve, it seems to move first and price in information faster than the TradFi Index (S&P, Nasdaq).Whilst there is uncertainty going into 2025 with Trump and his policies, with Powell and the number of interest rate cuts, and with the debt refinancing that Bessent will need to do (potentially significantly affecting market liquidity), there are things to be wary of.
However, we still expect a positive year for Crypto, with the majors doing good multiples and there being great opportunities in playing the Meme and Altcoin markets. The market seems to move faster than ever from one meta to another with there being core long-term winners in each sector/meta. So, it'll be up to us to keep finding those opportunities so that we and you can take advantage of them.
LET'S GO!!!
Recommended from Cryptonary


