Save 23% ($351) & Get a Free 1-1 Call with our Team ⏰ : 0d 2h 59m 43s
Disclaimer: This is not financial or investment advice. You are responsible for any capital-related decisions you make, and only you are accountable for the results.
BTC:
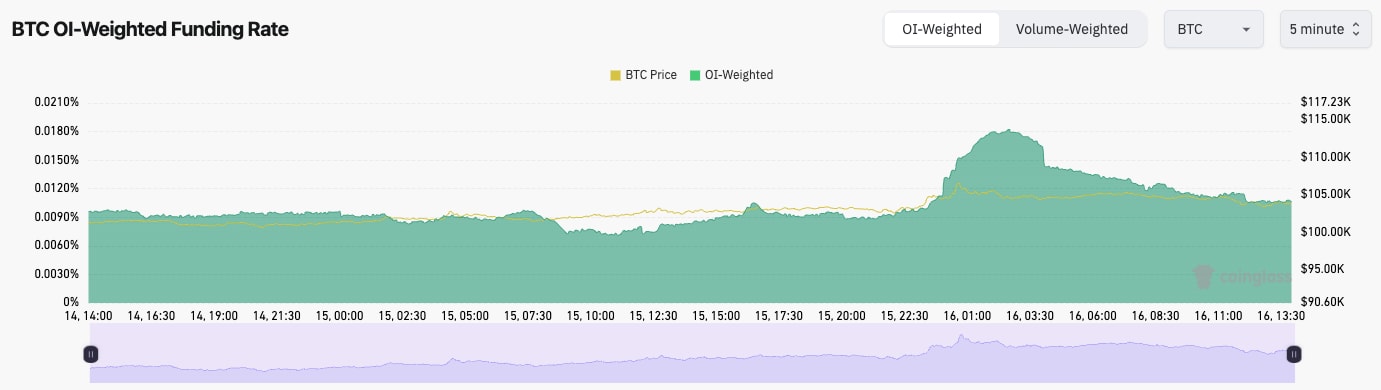
- BTC's Open Interest (by the number of coins) has increased again as the price has hit a new all-time high. However, OI still remains slightly below the highs prior to the leverage flush out.
- The Funding Rate has also remained positive but flat at just 0.01%.
- Overall, this is a positive setup from the mechanic's viewpoint, with BTC moving into all-time highs.
Technical analysis
- TA-wise, the BTC chart is quite awkward-looking here, with not many clear levels.
- BTC popped higher last night into a new price all-time high, but it has pulled back slightly today.
- Over the last two weeks, BTC has hammered out the $99,000 level as a new horizontal level, so we are now looking at that as a new horizontal support.
- The major zone of support is between $87,100 and $91,500; however, we're not confident that BTC will revisit those levels again. If it did revisit, we'd be buyers in that area.
- To the upside, yesterday's all-time high of $106,500 is the new horizontal resistance, and then you're looking at psychological levels, e.g., $100k, $120k, etc.
- The RSI is no longer overbought, but we have formed a bearish divergence again (a higher high in price and a lower high on the oscillator).
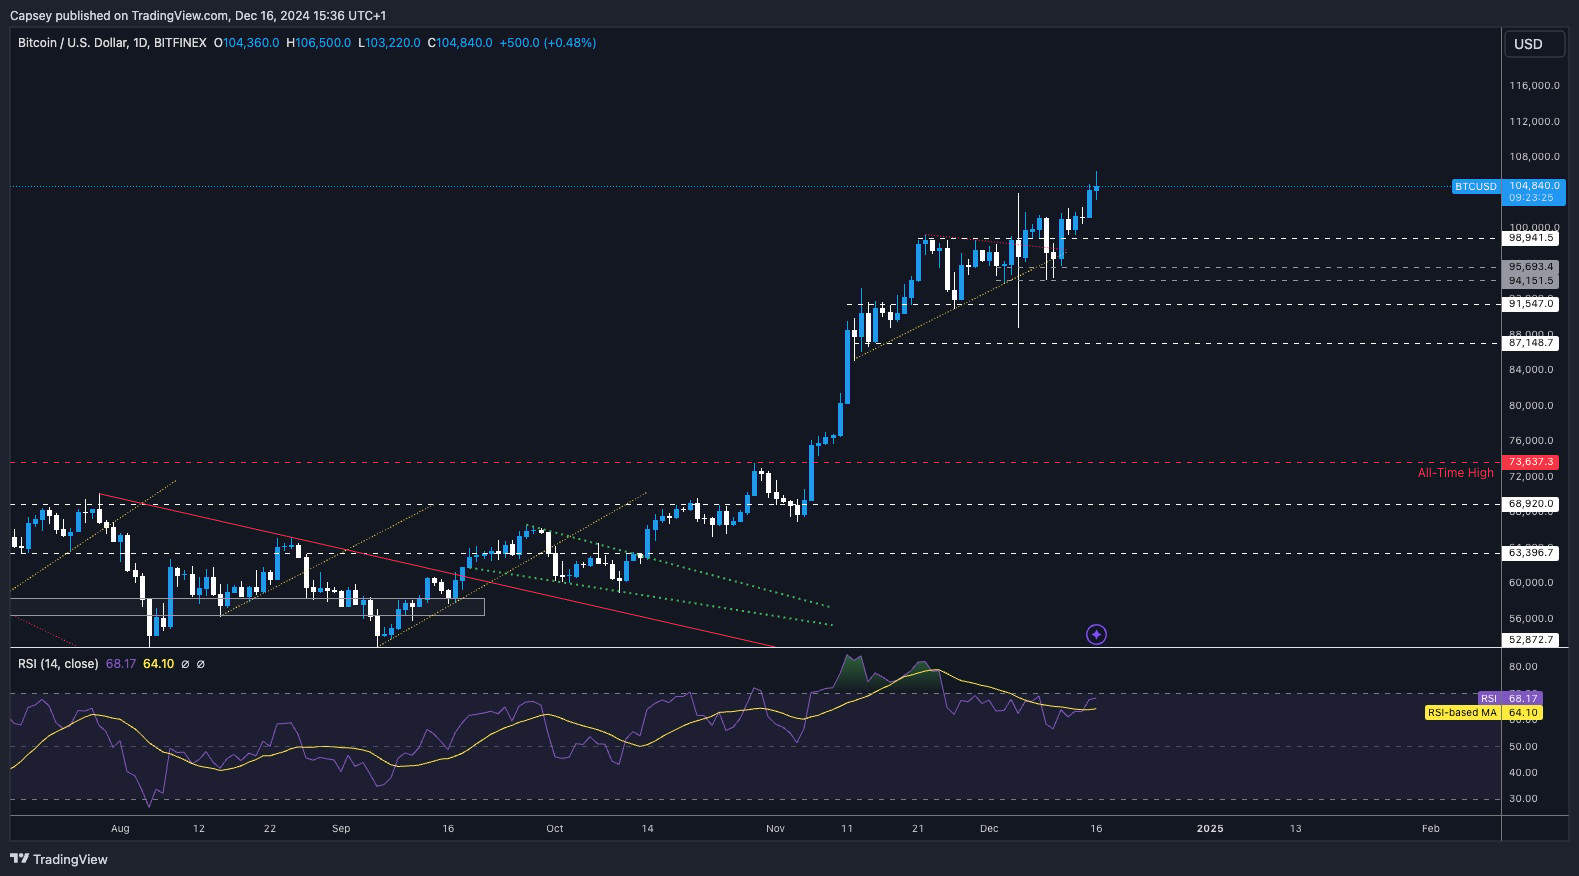
- Next Support: $98,950
- Next Resistance: $106,500
- Direction: Bullish/Neutral
- Upside Target: $115k (by Christmas)
- Downside Target: $95,700
Cryptonary's take
Overall, BTC does feel really strong with any meaningful dip being swiftly and aggressively bought up, and that's price action you have to pay attention to. Since breaking above $100k, BTC has had a number of pullbacks, and this has now formed a number of strong support areas, which we see as important for BTC to end up pushing up even further.In the immediate term, we're unsure of BTC's direction. We appreciate that BTC has been very strong, and we expect it to continue in this way. However, this week's price action might be determined by the FED Press Conference on Wednesday, although we are expecting a dovish Powell, who we think could reassure the markets on a further rate-cutting path in 2025.
ETH:
- ETH's Open Interest (by number of coins) continues to grind to a new all-time high. However, this may be due to large funds/institutions taking advantage of the 'cash-and-carry' trade (buy the ETF, short the futures, profit off the Funding Rate).
- ETH's Funding Rate remains at the healthy level of 0.01%. This is positive to see.

Technical analysis
- ETH did break below its uptrend line, but the price bounced perfectly from the $3,480 horizontal support.
- Price is now battling to recover the uptrend line, and it is putting up a good fight so far.
- Price is now butting into the main horizontal resistance between $3,950 and $4,000.
- If ETH were to break above $4,000 convincingly, we'd expect $4,500 to be swiftly achieved.
- There is now local support for ETH between $3,700 and $3,800.
- The RSI has meaningfully reset and not near overbought territory. This may allow the price of the room to run higher.
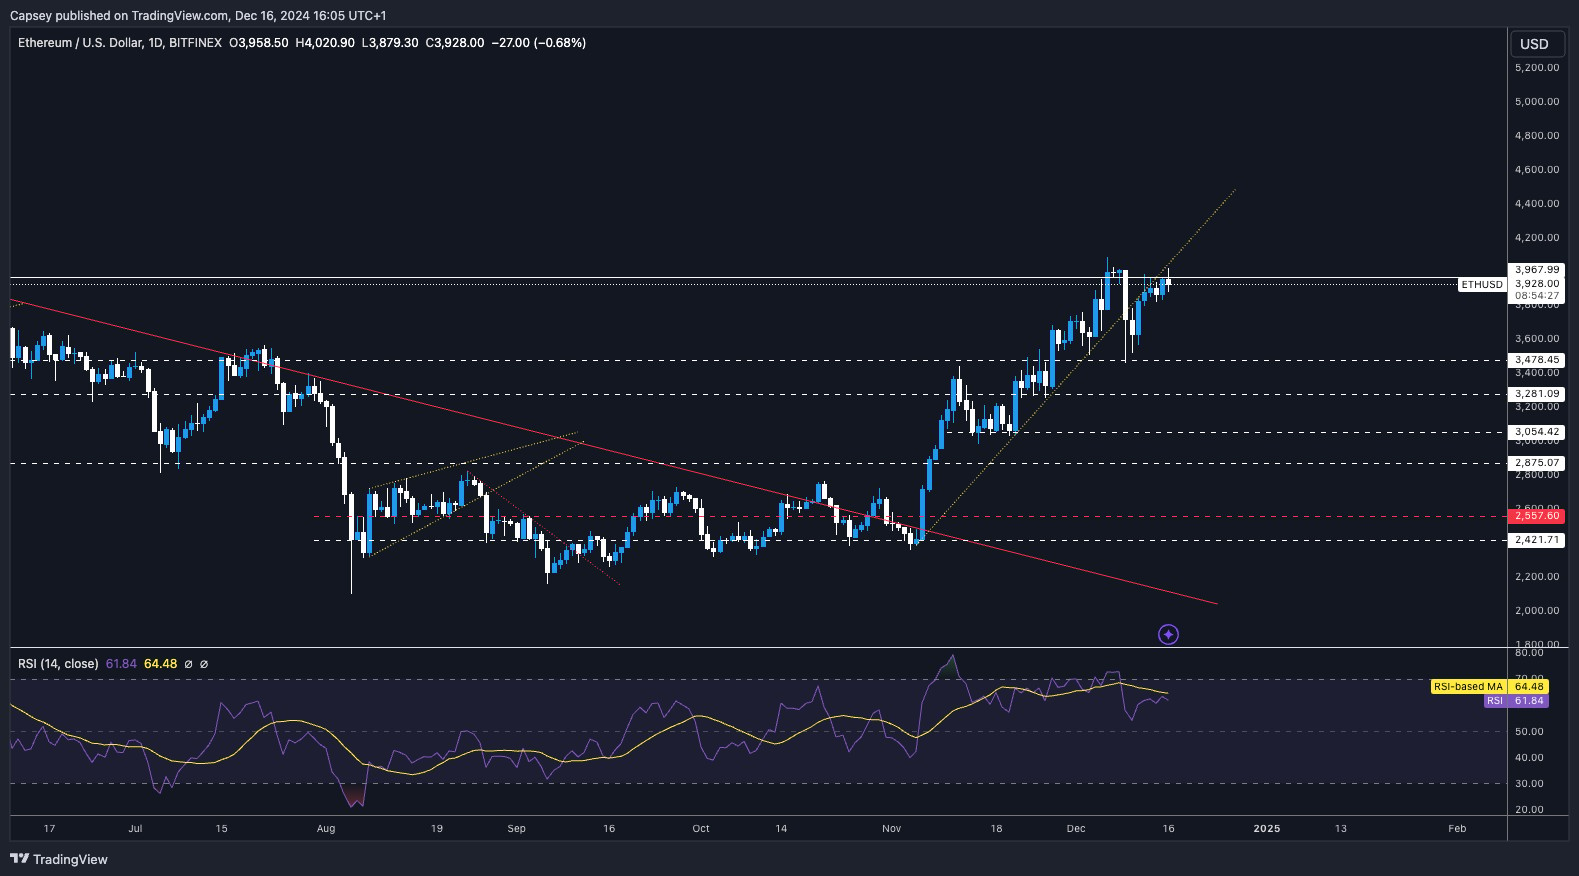
- Next Support: $3,700
- Next Resistance: $4,500
- Direction: Bullish
- Upside Target: $4,500
- Downside Target: $3,700
Cryptonary's take
ETH is in a really interesting spot here. It's possible that the converging resistances (beneath the uptrend and the horizontal resistance) can keep the price below $4,000 for more days. However, we expect ETH to break out more imminently. And when it does, we expect $4,500 to be achieved quickly. Any pullbacks to $3,700 - $3,800 should be bought for a move up to $4,500.SOL:
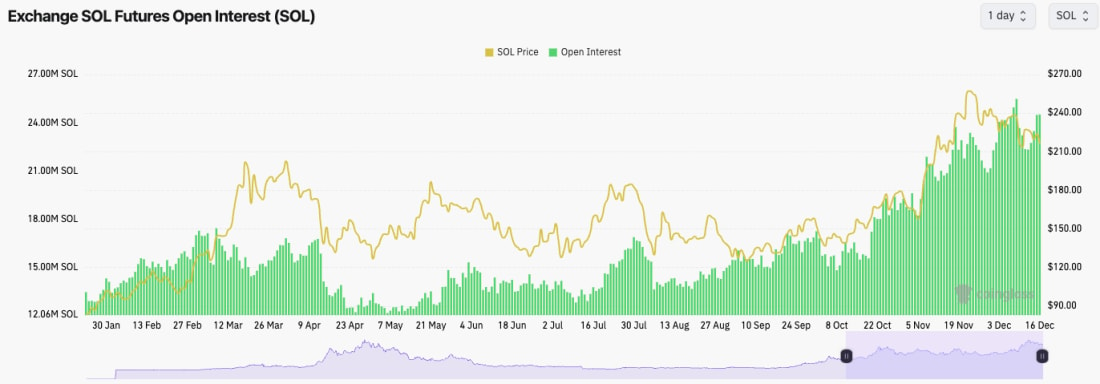
- SOL's Open Interest has also ramped back up to its prior highs despite the leverage flush out a week ago.
- The Funding Rate is back to the healthy level of 0.01%. This is positive.
Technical analysis
- SOL is currently in a downtrending channel, which usually does have a large breakout to the upside, assuming there is a breakout.
- Price has seemingly lost the horizontal support at $222, and price now finds itself in the lower range between $203 and $222. However, we don't necessarily see this as a bad thing.
- In terms of resistance, $222 is the first, and then it's $245. We'd also be looking for a breakout of the downtrend line (top border of the channel.
- On the downside, $203 is the main horizontal line for the price to hold.
- The RSI has also meaningfully reset to middle territory, although there aren't any divergences forming.

- Next Support: $203
- Next Resistance: $222 (then $245)
- Direction: Neutral
- Upside Target: $245
- Downside Target: $203
Cryptonary's take
SOL has taken a breather here for the last month, but that's all we see it as, just taking a breather. We're looking at $203 to $222 as the zone where the price likely locally bottoms.We remain really positive on SOL and expect it to get back to all-time highs in the coming month or two. In the immediate term, we expect the price to just remain range-bound, likely between $203 and $222, before breaking out at a later date.
WIF:
- Certainly not the move we were looking for.
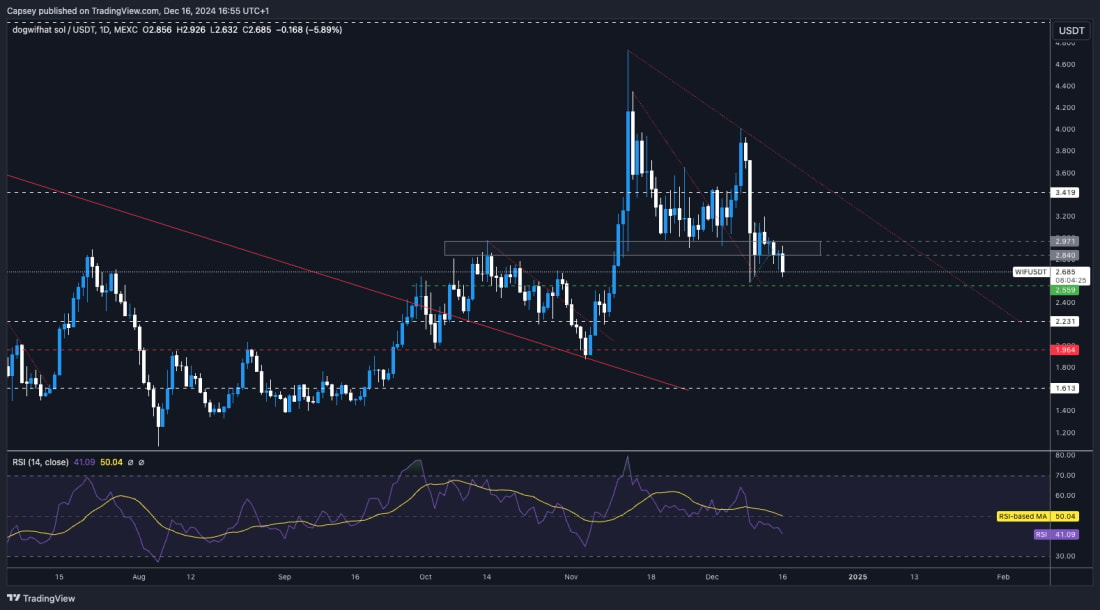
- WIF has broken below the support box we had laid out between $2.84 and $2.97, and the price is moving down to the major support of $2.55.
- There are a lot of supports between $2.50 and $2.70, so we do expect this lower bound zone to be the major support and for this area to be the local bottom.
- In terms of resistances, WIF needs to reclaim back above $3.00, and then beyond that, $3.40.
- We also note that there is a larger downtrend line at play. It's possible that WIF will remain below this main downtrend line until the end of the year. A breakout above this main downtrend line could be the catalyst that brings volumes back in and pushes WIF back to the highs.
- The RSI has now also reset back to middle to low levels at 41. We perhaps would have preferred to see the RSI closer to oversold territory, considering the price is in the $ 2.60 range.
- Next Support: $2.55
- Next Resistance: $3.00 (then $3.40)
- Direction: Neutral
- Upside Target: $3.00
- Downside Target: $2.55
Cryptonary's take
WIF has lost some key levels, but like a lot of memes, have also, as we have seen a bit of a rotation recently into some Alts and AI plays. However, throughout the cycle, Memes have been the best performers, and we don't see that going away despite the blip in performance over the last 4-6 weeks.We expect WIF to bottom locally between $2.50 and $2.70, and it's possible we will see range-bound price action for a few weeks. This may then set up a break out of the downtrend line and a move back to $3.40. We continue to hold Spot positions.
POPCAT:
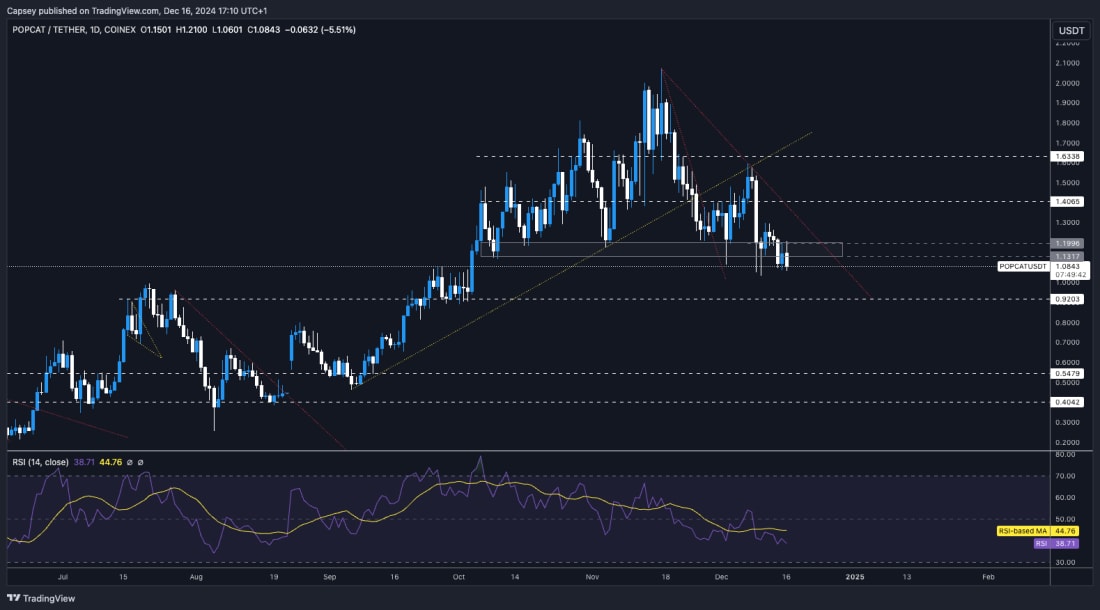
- POPCAT rejected off the underside of the main uptrend line, and the price fell to the support box between $1.13 and $1.19, and unfortunately, it wasn't able to hold.
- Price is now seemingly testing into what we'd call the last support zone between $0.92 and $1.10. Price needs to hold this area, or we might risk seeing panic sellers (assuming we haven't had them come out of the woodwork already).
- POPCAT is also in a main downtrend, although we could begin to see a squeeze into this main downtrend line in the coming 7-10 days, which then could result in a breakout to the upside.
- The resistances for the price would be at $1.40 and then $1.63.
- The RSI has meaningfully reset, and it's now not far from being oversold territory. Soon, this might look attractive to big players who might be enticed by the oversold conditions and potentially set up a good risk/reward for POPCAT.
- Next Support: $0.92 to $1.10
- Next Resistance: $1.20 (then $1.40)
- Direction: Neutral
- Upside Target: $1.40
- Downside Target: $0.92
Cryptonary's take
POPCAT has absolutely been a tricky watch over the last few weeks, although with the current drawdown being at 47%, you'd have to say that this is a normal/typical pullback for this kind of asset and one we've seen many times already with POPCAT. We are watching the $0.92 to $1.10 zone as a key support zone, and that price needs to find support and begin to hammer out a base.Then, a push towards the downtrend would set up a bullish structure. For now, though, we're expecting the price to be range bound between $0.92 and $1.10 and hammer out a base. We remain to hold all Spot bags.
SPX:
- This chart looks mega, which is probably one of the best ones out there. And, before you ask, no, I am not personally (Tom) positioned. And I'm not sure why.
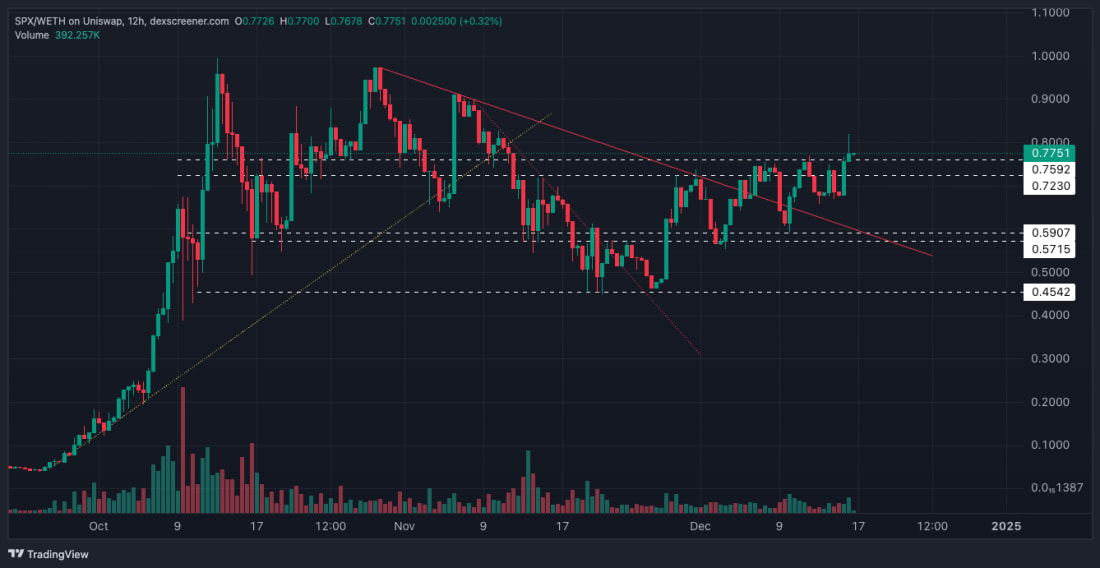
- SPX has cleanly broken above its main red downtrend line, and whilst it has found resistance into the horizontal levels of $0.72 to $0.75, the price is now seemingly above those levels and looking to push more considerably higher.
- We're expecting the price to push on to $0.90 and $1.00 in the coming 1-2 weeks.
- In terms of support, we wouldn't want the price to lose the $0.68 to $0.72 zone.
- Next Support: $0.68 to $0.72
- Next Resistance: $0.90 (then $1.00)
- Direction: Bullish
- Upside Target: $1.00
- Downside Target: $0.68
Cryptonary's take
There's no need to continue rambling on much more here. Simply put, this chart looks great and looks programmed for further upside in the short-term. We expect $0.90 to $1.00 quite soon.Recommended from Cryptonary