Save 23% ($351) & Get a Free 1-1 Call with our Team ⏰ : 0d 2h 59m 44s
Let's get started
Examining miner behaviour, basis trade dynamics, and several key pricing models, we uncover evidence that this may be the mid-cycle lull before things go fully parabolic.For crypto to go truly parabolic, the macro backdrop needs to align – and getting that alignment right with a high degree of conviction is where most of the existing commentary about the current state of the market falls short. They either tilt towards extreme bullishness, asking you to ignore the evidence of the drawdowns in your portfolio, or tilt towards extreme bearishness, saying that the bull market is over.
In this monthly market update, we examine macro data, on-chain data, and cycle analytics to determine whether we've already reached this cycle's peak or whether crypto still has massive upside potential.
We explore the specific economic conditions and Fed policy shifts necessary to provide the "green light" catalyst. The economic conditions that play out could have huge implications for when the real fireworks begin in crypto.
By studying prior halving cycles, we pinpoint when the supply squeeze effects have historically played out and how the current cycle has rhymed so far.
Of course, no report is complete without strategic portfolio guidance. We outline optimal positioning for weathering the chop while ensuring you're primed to capture maximum gains once the risk-on signal finally arrives.
Let's dive in!
TLDR
- Crypto is mostly down because the market is now pricing in one rate cut in November 2024. What are the possibilities for rate cuts this year?
- Was the top in March? We deep-dived into on-chain metrics to determine whether the bull market is over.
- Next, we took a look at Bitcoin's price action in previous halving cycles to determine if the current cycle rhymes with or deviates from the past.
- What macro backdrop is needed for the next leg up? We dive into specifics of rate cuts and the macro stars that need to align for a macro greenlight.
- We conclude with guidance on how to manage your portfolio to avoid being chopped out of the market and the risk-on signal to watch to get the maximum possible upside in this market.
Disclaimer: This is not financial or investment advice. You are responsible for any capital-related decisions you make, and only you are accountable for the results. "One Glance" by Cryptonary sometimes uses the RR trading tool to help you quickly understand our analysis. These are not signals, and they are not financial advice.
Economic data and Fed rate cuts
For crypto heads who are less interested in the macro's nitty-gritty details, skip to Macro Summary.Over the last few months, the market has been buoyed by the hope that the Fed will cut interest rates in the US. Over this time, Powell (Federal Reserve Chair) has seemingly supported this rhetoric until last week's FOMC.
Going into the FOMC, data had been supportive of 1 to 2 Interest Rate cuts in the US in 2024, and this then shifted to 2 Interest Rate cuts in 2024 when the Inflation data came in somewhat as a downside surprise last Wednesday. Core Inflation YoY came in at 3.4% and showed a continuation in the downtrend of the YoY rate.
Core Inflation YoY
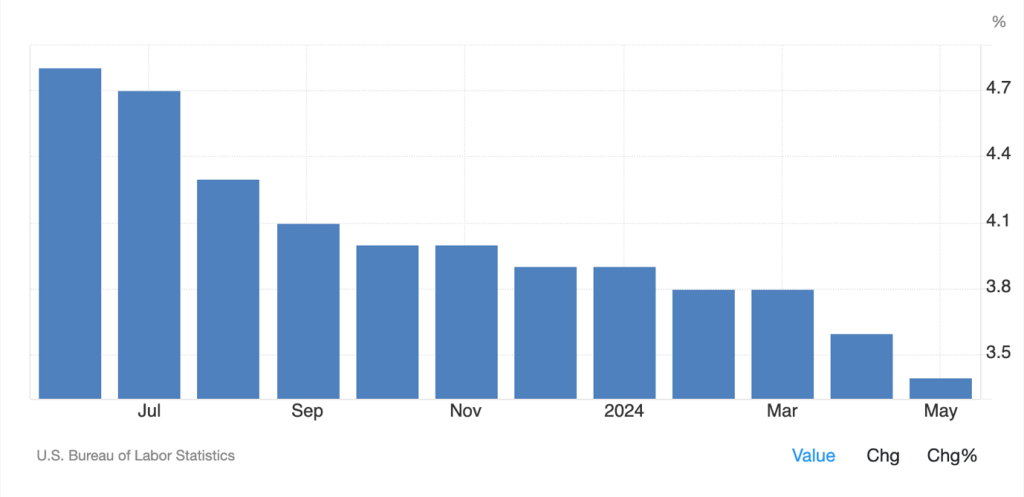
Alongside this, the MoM Rate for Core came in at 0.2%, whilst the MoM Rate for Headline Inflation came in at 0.0%, another downside surprise. This data followed several months of higher-than-expected inflation prints, so last week's data would have been welcomed by the Fed.
However, the Fed and Powell delivered a hawkish Press Conference, which pushed back on the market pricing in two Interest Rate cuts for 2024, just before the meeting. The Fed also released an updated Dot Plot, which showed that they only expect 1 interest rate cut for 2024, even though they revised their longer-term Unemployment Rate to 4.2% from 4.0%, they still expect 4.0% by year-end 2024.
This is questionable, considering the economy is slowing, and we're beginning to see the early signs that the labour market is arguably weakening rather than just healthily moderating. A weakening labour market is now the most likely determinant of when the Fed begins cutting Interest Rates and how many rate cuts they do.
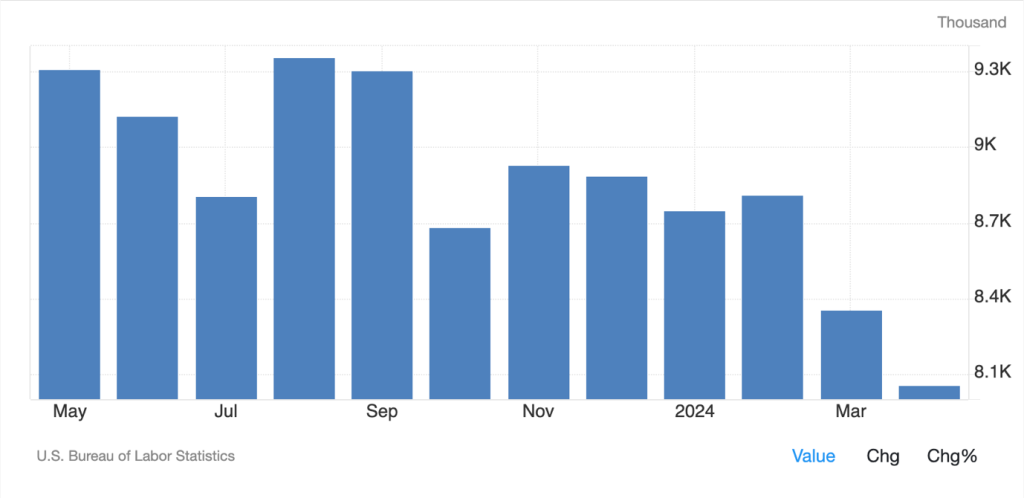
In the last month, we've seen the JOLT's Job Openings (the number of jobs employers are hiring for) begin meaningfully downtrending, which is usually a precursor to the Unemployment Rate rising, which we have now begun to see with the Unemployment Rate inching up to 4.0%.
JOLT's Job Openings
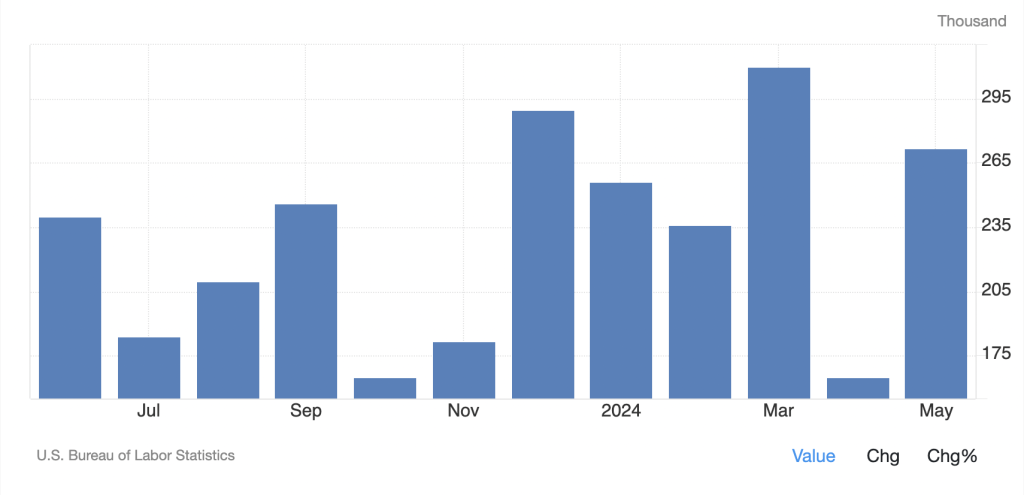
Even though the Unemployment Rate is beginning to creep higher, the number of jobs added each month in the US continues to come in strong – this is at least according to the Bureau of Labour Statistics, although ADP has reported much lower jobs added figures compared to the BLS. We even saw Chair Powell lightly suggest that the BLS numbers may be overstated – this is understandable from the Biden administration, who is looking to be re-elected in November.
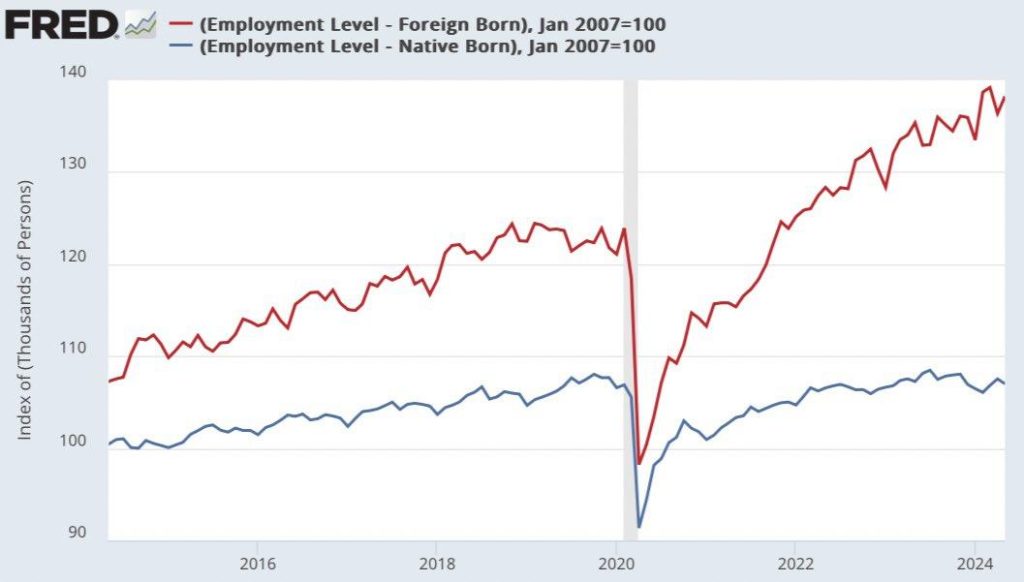
We're seeing the Unemployment Rate creep higher despite seeing strong job numbers added each month due to immigration. The Biden administration has allowed large immigration into the US, which increases the supply and, therefore, should help wages be less inflationary. But this is essentially why we can see the Unemployment Rate rise, yet the number of jobs added still comes in somewhat high.
US Non Farm Payrolls
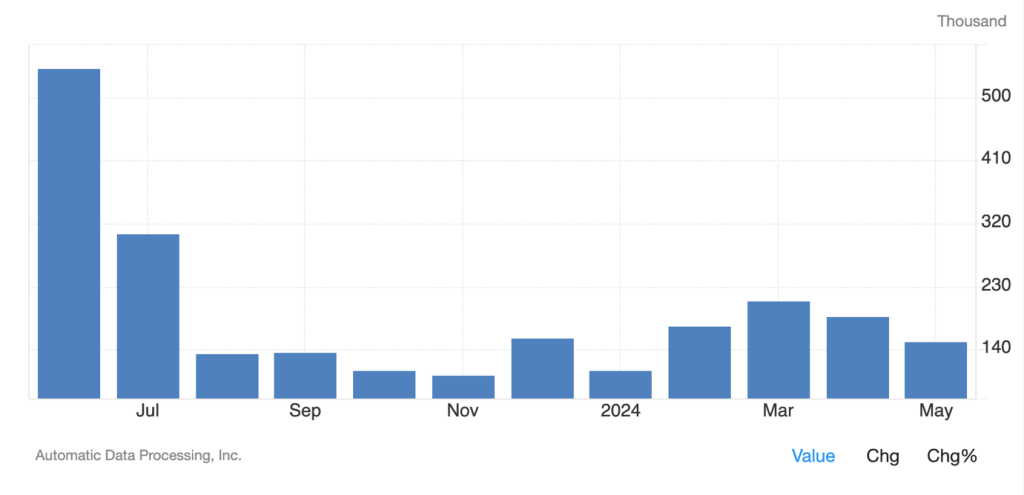
ADP Employment Change
Employment Level – Foreign Born vs Native Born
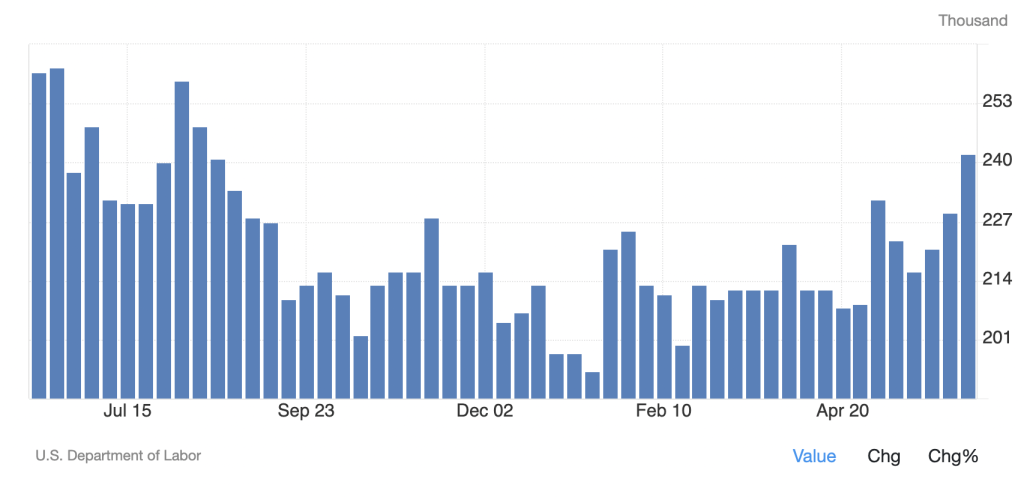
Alongside the above, we're also seeing Initial Jobless Claims begin to trend higher. Initial Jobless Claims is the number of people claiming benefits in the US. This metric also suggests a weakening in the labour market.
Initial Jobless Claims
The crux point will come if/when the Unemployment Rate rises above 4.2%, particularly if this happens in the coming months. This would bring Interest Rate cuts earlier to the table than what the market is currently pricing. The market is currently pricing one rate cut in November for 2024.
In last Wednesday's Fed meeting, the Fed and Chair Powell were more hawkish, a change from their usual dovish bias. This is understandable given the markets (the S&P and the Nasdaq are at record highs), while we also saw slightly hotter inflation prints through Q1 24.
However, if Inflation data comes in lighter over the summer months (and with Oil prices coming down, this is now more likely) and we see the labour market data continue its downtrend (lower JOLTs and an increasing Unemployment Rate), this may bring the Fed back to the interest rate cutting table, with them possibly forward guiding an interest rate cut for the September meeting during the July meeting.
This would be even more greatly emphasised if the S&P and Nasdaq were to have a 5-8% pullback over the next 3-6 weeks. As it is, breadth in the Stock Market is pretty poor, with smaller-cap companies being hit hardest by the higher interest rates.
This has led to greater concentration in the S&P, with the larger market cap, cash-rich companies (earning income on their cash balances) heavily outperforming and soaking up all of the new stock market inflows.
But essentially, we're now beginning to see the squeeze on small market-cap companies and the consumer, highlighted in the Spending figures. The effect of having higher interest rates is now starting to happen and become more visible.The pushback, however, may come from a less politically driven Fed (the Fed is supposed to be independent anyway) than the Fed of 2021, which was too late to the rate-hiking party and let inflation get out of hand. This year, Powell is not up for re-election as Fed Chair, and we know he looks up to the legacy of Paul Volker (the Fed Chair who crushed inflation in the 70s by dramatically raising interest rates and causing a recession). This may mean that Powell and the Fed may be more open to allowing economic weakness to continue their fight against inflation. This would aid the argument that we don't see an interest rate cut until November 2024.
Macro summary
Following last Wednesday's Fed Meeting, the markets have priced for only 1 Interest Rate cut for 2024. However, if the data over the next 6 weeks shows a weakening in the labour market and the Inflation data moderates alongside this, this may bring the Fed to forward-guide a potential Interest Rate cut in September when they have their July meeting.This would align the Fed with other Central Banks that have begun an Interest Rate cutting cycle already, which would help bring the Dollar ($DXY) back down and help to push risk assets higher, particularly if they were to undergo a pullback in the coming weeks.
However, with the current macro setup and without new liquidity in the coming month or so, it's possible that we will see risk asset markets pull back over the coming 3-6 weeks before the next Fed Meeting at the end of July. If the data comes in hotter, then the Fed will likely remain on pause and maintain a hawkish rhetoric, which may see risk assets struggle through to September. This market will continue to be dependent on the data as it has been for a long while now.
For crypto, the above means that we're unlikely to see crypto prices go meaningfully higher over the coming 6-8 weeks. The change will be if the data comes in to support earlier interest rate cuts, and then Powell forward-guides them in July to potentially begin in September.But in the meantime, we may see the large caps (BTC, ETH, and SOL) continue to be bid on dips and sold into the retests of local highs. Altcoins and memes may continue their period of struggle, although many of the bluechips have already undergone large drawbacks that we wouldn't be opposed to buying. However, we expect non-bluechips to struggle and likely continue to drain slowly lower.
This will turn around when liquidity improves, likely coming from a macro "green light" (maybe the July Fed Meeting)—when the Fed begins to ease policy when Yellen manipulates the Bond supply into issuing more Bills, or if she runs down the TGA.
On-chain data
We'll now briefly examine on-chain data to assess some of the dynamics that have been at play in the market recently. We'll also cover a few 'Market Indicator' metrics that can help us more easily identify where we might be in the current cycle from a zoomed-out view, which can be difficult to see through in times of price chop (sideways price action).Following the Bitcoin Halving, we've had miners enter a period of capitulation, which is typical for miners (mostly the inefficient miners) just after a Bitcoin Halving. This is where miners sell more of their earned supply to cover their costs as they now earn half as much Bitcoin (in rewards for mining), meaning their profit margins are squeezed until Bitcoin's price re-rates higher. This can take multiple months following a halving event. We will dive into this later in the report.
Bitcoin Miner Capitulation – Hash Ribbon
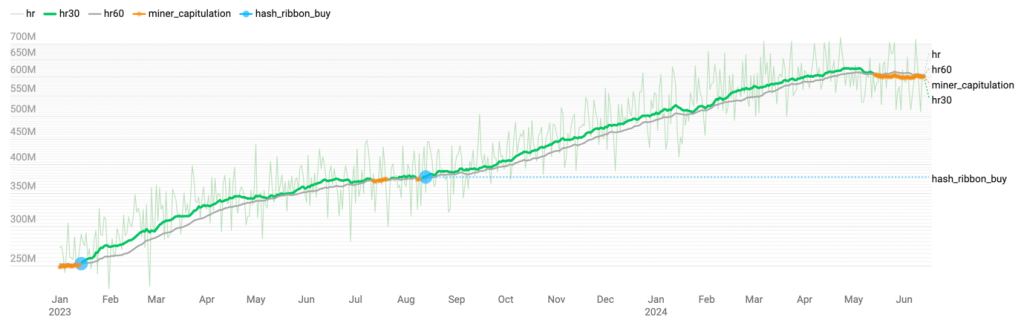
The above shows that Miners are currently in a period of 'capitulation' (the orange area). Previously, 'Miner Capitulation' periods have signalled good long-term buying opportunities. The 'Miners Net Position Change' metric also shows this, with Miners having been net sellers since December 2023 as Bitcoin recovered to north of $40,000.
Miner Net Position Change
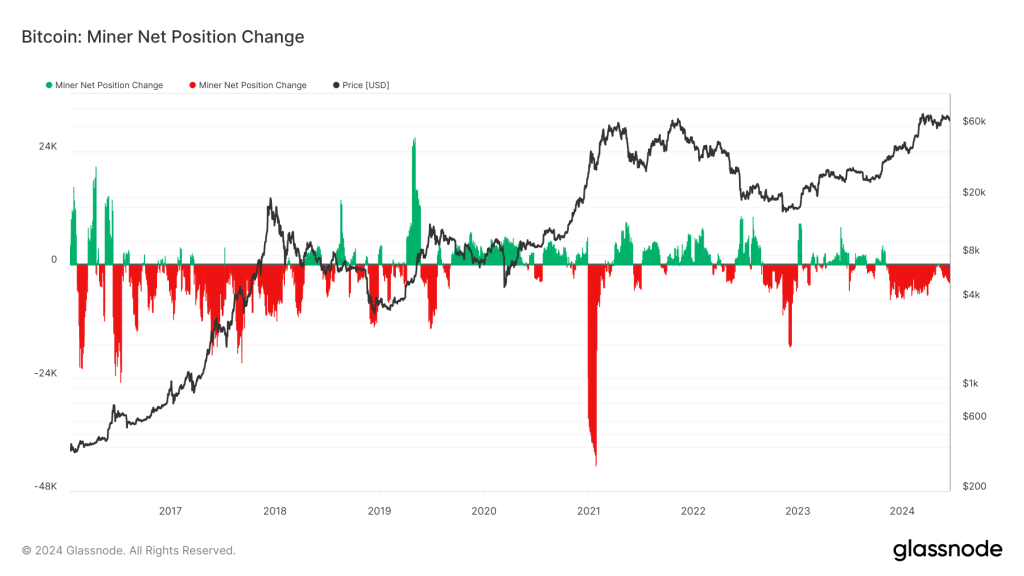
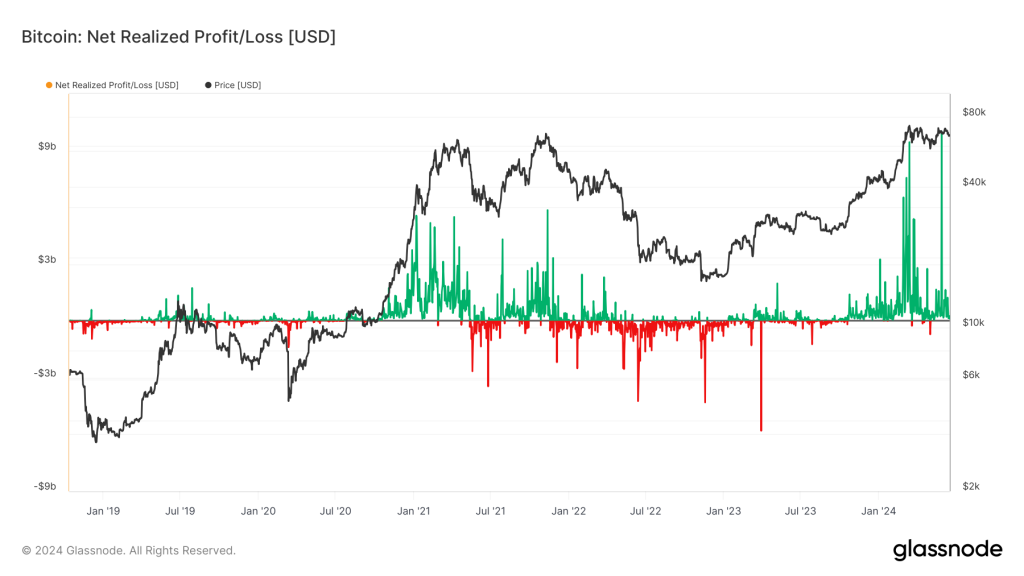
Bitcoin supply has entered the market (to be sold) around the $70k level. This is best displayed in the metric 'Net Realised Profit/Loss' below, where we can see large green spikes (a large USD value of realised profit taking).
Net Realised Profit/Loss
Something else that has potentially been suppressing price may be large funds taking the basis trade. In the basis trade, funds/institutions/high-net-worth individuals earn an arbitrage from the delta-neutral strategy by buying Bitcoin (via an ETF) and shorting the Futures contract.
If Bitcoin's price goes up, then that trader will profit in USD on their ETF holdings, but they'll lose the same amount (in USD) on their Futures contract trade or vice versa if the Bitcoin price goes down. But the trader/fund will profit from the Funding Rate that is paid on the Futures contract.
Funding currently pays between 10% to 13% per year. This is where other individuals who are Longing Bitcoin will pay a fee to Shorts for the privilege of being Long. This enables the professional trader to buy the Bitcoin ETF but Short the Futures contract.
The price of Bitcoin going up or down won't affect the professional trader's profit as the strategy is delta neutral, but they'll earn the Funding Rate that other Long positions are paying to their Short position.
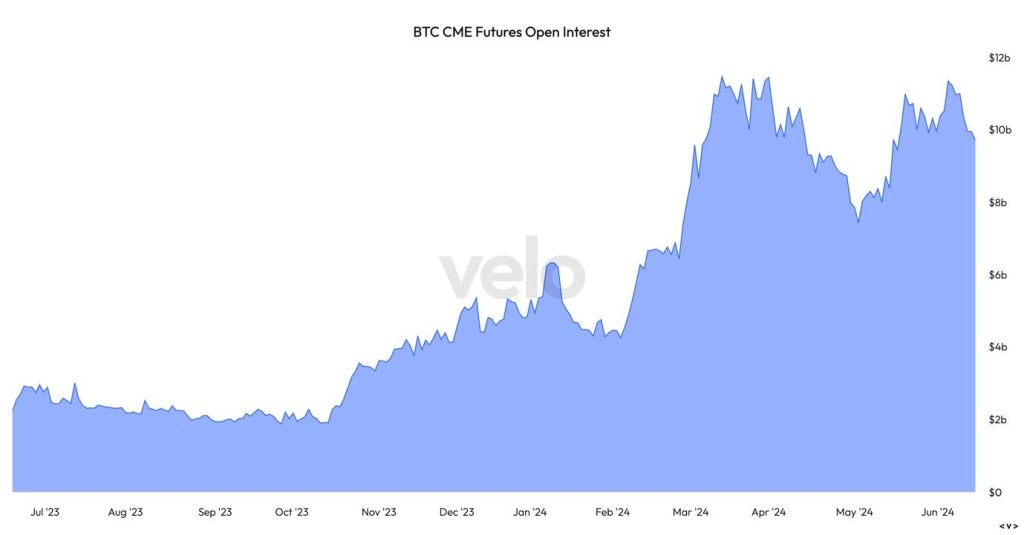
This also explains why the Bitcoin ETF inflows have been so strong, yet Bitcoin has been range-bound – as price is being compressed by a large amount of volume Shorting the Futures contract.
Increase in Open Interest before and after the launch of the Bitcoin ETF is shown below.
BTC CME Futures Open Interest
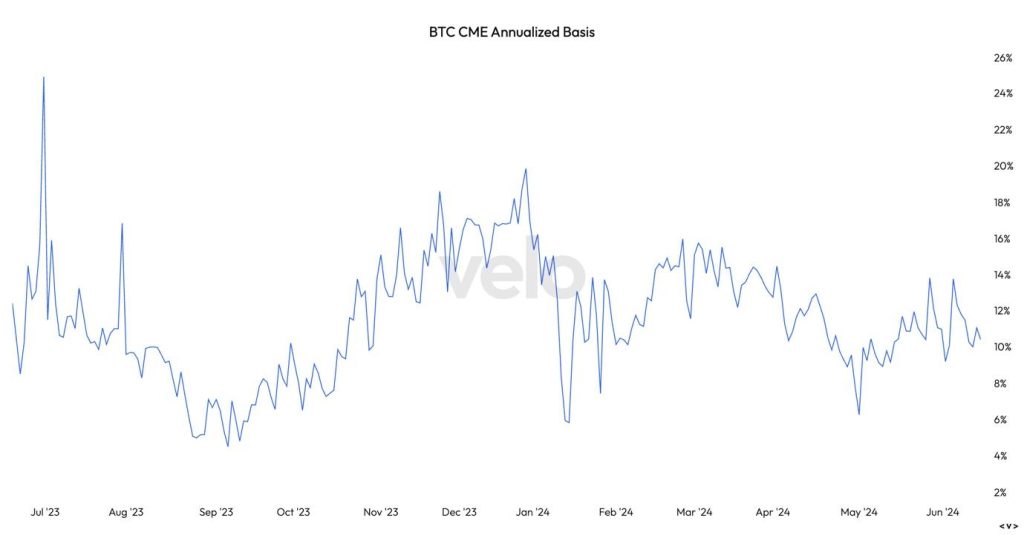
Traders taking advantage of this strategy will earn the Funding Rate, which, as we can see in the chart below, ranges between 10% and 13%.
BTC CME Annualised Basis:
Bitcoin Futures Record Number of Shorts:
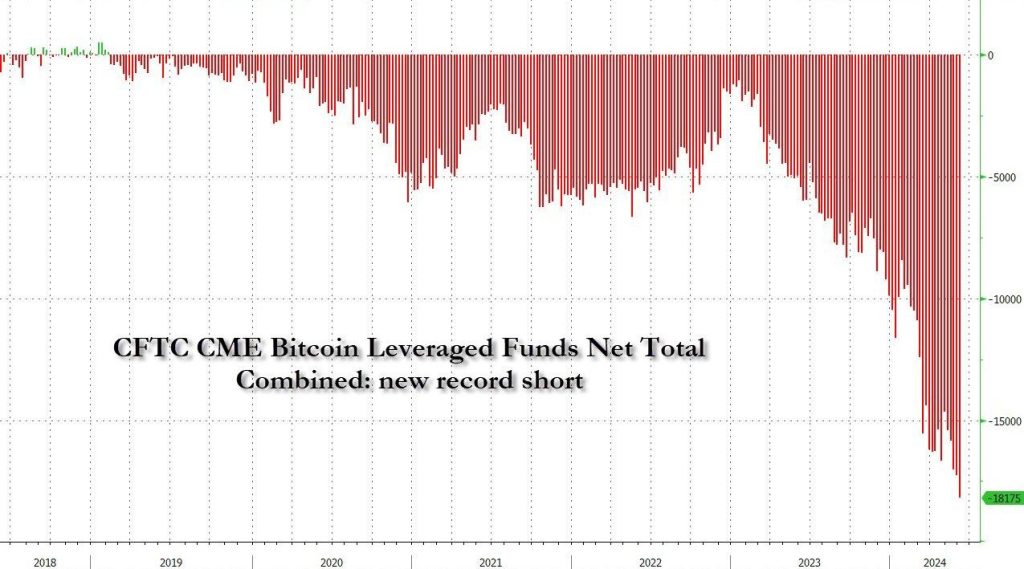
Source: ZeroHedge
This does not mean that all inflows into the Bitcoin ETFs are for this strategy; many will still be organic inflows where the participants are net Long Bitcoin and treating it as a long-term investment.If we now look at a couple of the 'Market Indicator' metrics, we can see that from a zoomed-out perspective, Bitcoin still looks to be in the mid-cycle (with a further bull market to come).
MVRV Z-Score
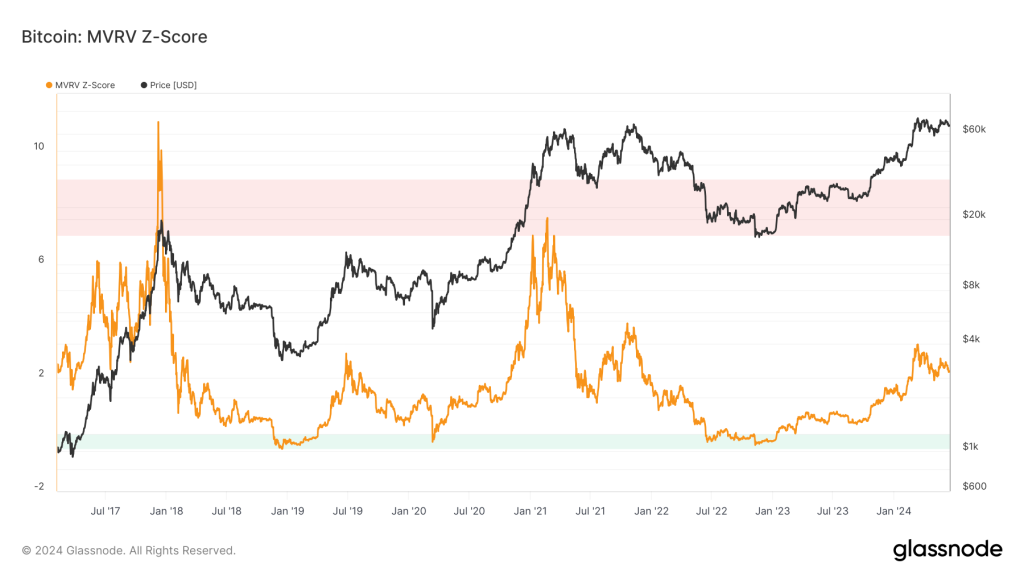
The MVRV Z-Score evaluates Bitcoin's relative over- or under-valued status relative to its 'fair value'. We can see above that this metric has increased for this cycle so far, but it remains relatively low, and it doesn't suggest we've had a euphoric top yet.
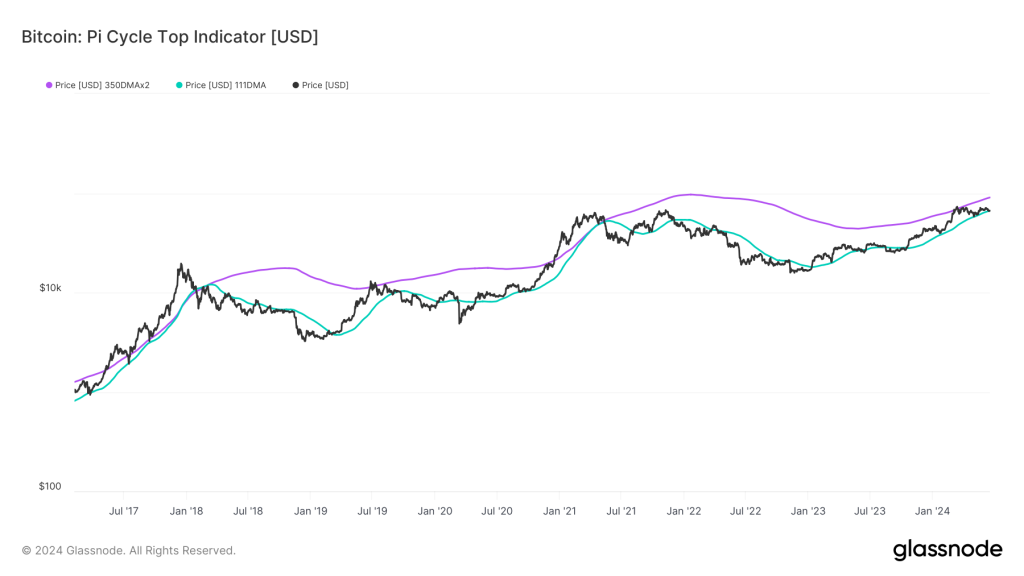
Another 'Market Indicator' metric we can look to is the Pi Cycle Top Indicator. This metric compares Bitcoin's price against 2 moving averages, and it has often been a good indicator showing when Bitcoin is overheated and maybe putting in a cycle top.
In this metric, Bitcoin is currently using the 111D MA as support, which has historically been a good buying opportunity in a bull market. This metric also shows that despite Bitcoin testing the 350D MA x2, it is now well back below that level, suggesting that a cycle top is still yet to come.
Pi Cycle Top Indicator
Bitcoin's price action after previous Halving events
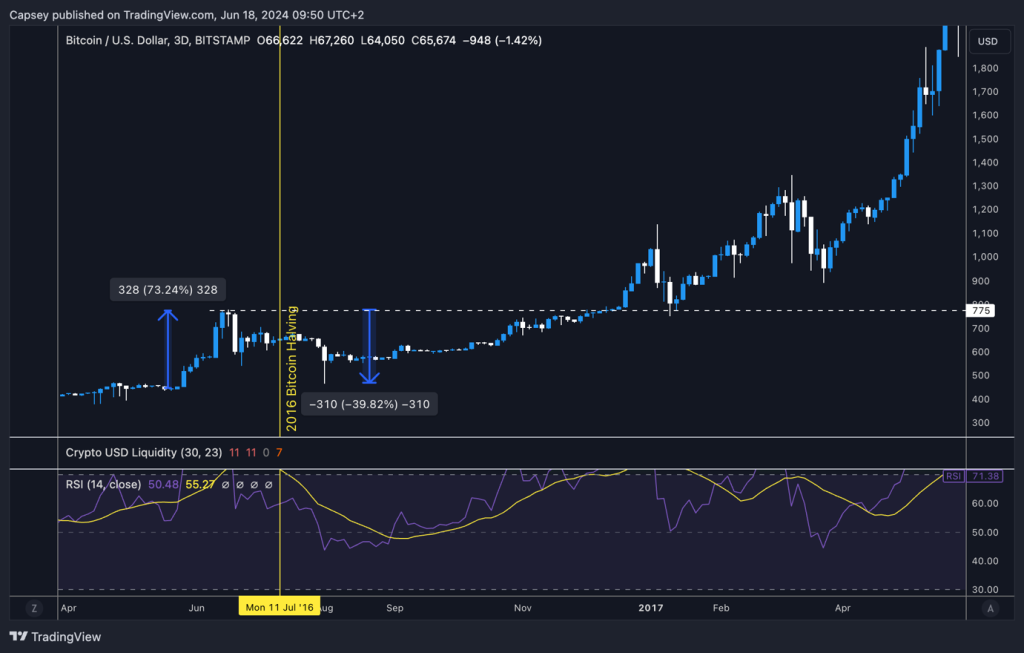
In this section, we'll look back at prior Bitcoin Halvings and how Bitcoin's price behaved/performed to help us identify whether the current price action is different from the norm.In the 2016 Bitcoin Halving, Bitcoin rallied 74% higher going into the event, to then sell off 40% within the next month. It then took Bitcoin 6 months (from mid-July 2016 to mid-December 2016) after the Halving to break above the all-time high it had put in a few weeks before that Halving. Once it broke above the all-time high, price moved up in a parabolic fashion.
2016 Bitcoin Halving event
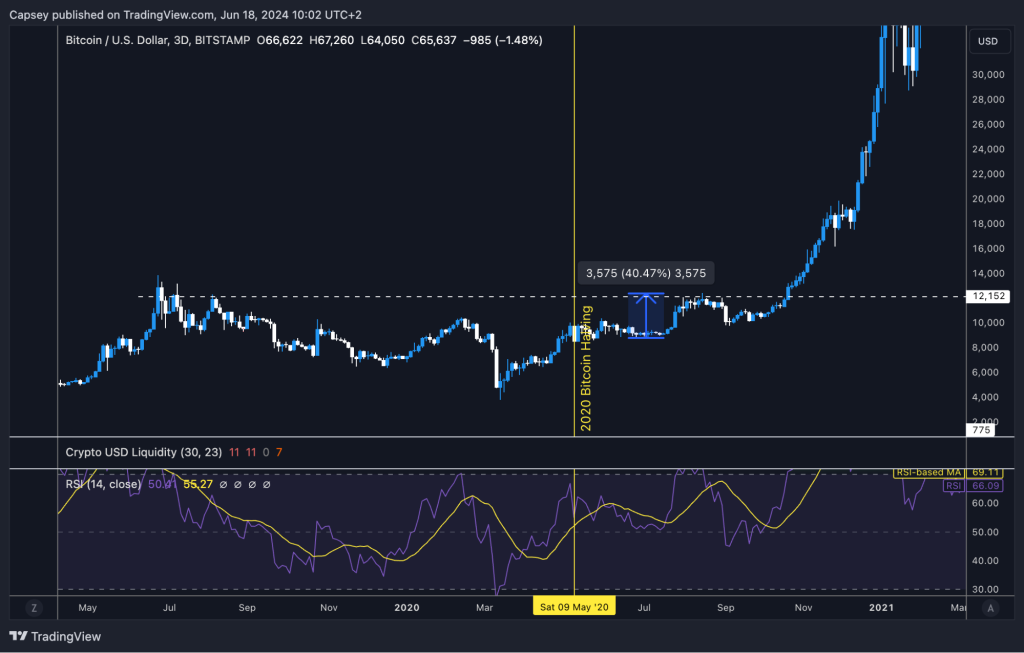
The 2020 Bitcoin Halving is potentially somewhat distorted in that the markets crashed due to COVID-19 just two months before, leading to large liquidity stimulus from central banks.
So, we ran up into the Halving but only gained back the Covid-19 losses. Price then remained relatively flat for 10 weeks (2.5 months), and then price moved up by approximately 40% to retest the price highs of the prior summer before stalling out again.
Bitcoin ultimately broke out from the $12k zone that had been overhead horizontal resistance in mid-October, a full six months after the Halving event in the prior May. It was only then that price went parabolic.
2020 Bitcoin Halving event
From the above, we can see that Bitcoin Halving events are long-term bullish, but it takes some time for the supply squeeze to be felt. This is particularly the case as miners are usually large net sellers after a new Bitcoin Halving because rewards are half of what they were before the Halving. Until Bitcoin's price re-rates higher, they're under pressure to meet their costs.
If we now look at the current setup in 2024, we can see that the price has been range-bound between $59k and $72k (approximately, disregarding some wicks on the chart) going into and following the Halving. From what we know above, it takes some time for Bitcoin's price to make more significant rallies post-halving, and we're essentially only two months post-halving.
2024 Bitcoin Halving event
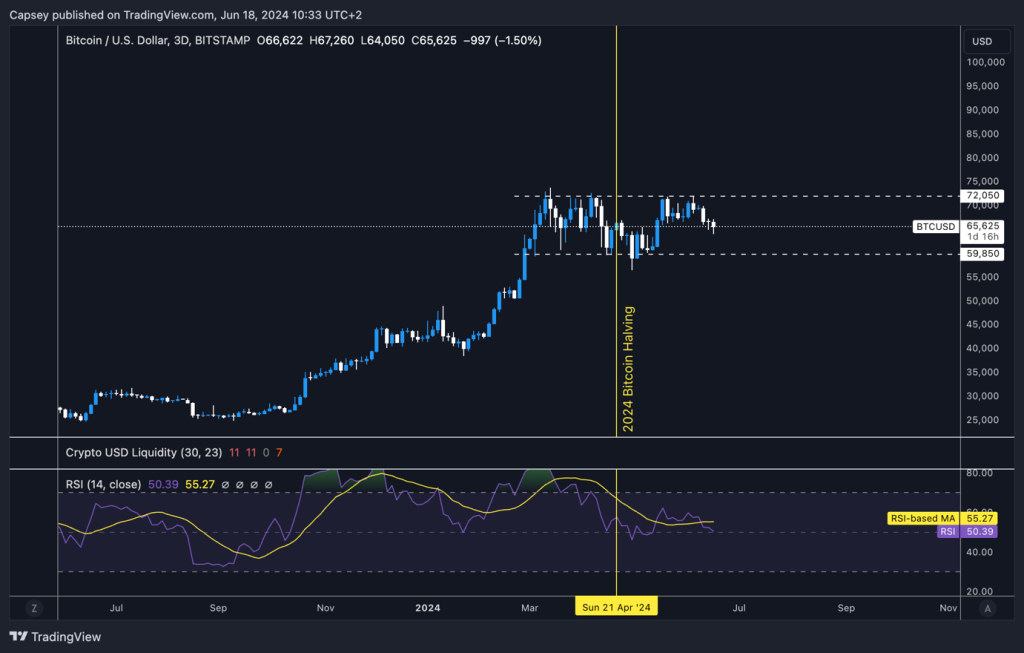
Based on prior price action around past Halving events, we expect Bitcoin's price to break out sometime around September – 5 to 6 months after the last Halving. This also aligns with a potential Fed rate cut if we get one from Powell and the Fed starting in September.
Cryptonary's take
The conclusion we can draw from the above analysis is that this cycle looks similar to all the others.The main difference this time is that Bitcoin hit an all-time high price pre-halving. However, we know from past cycles that Bitcoin takes time to break to significant new highs following a Halving event.
Alongside this, many of the on-chain models suggest that we're where we're supposed to be in the current cycle—close to all-time highs and chopping until we get the full effects of that supply squeeze.
It's likely that risk assets, in general, will need that macro 'green light' from the Fed. This is in the form of rate cuts. Rate cuts will take pressure off small businesses, and that'll see the stock market rally potentially broaden out, and you'll see a fuller risk-on environment, which would also be the catalyst to push crypto higher.
However, in order to achieve this, we will need to see lower inflation prints over the next 6-10 weeks, with the labour market also showing further signs of weakening. If we get that, Powell may forward-guide to the markets at either the July Fed meeting, but most likely at Jackson Hole in August, for a September rate cut.
If we don't get this, the next expectation will be for the Fed to remain on hold (no interest rate cuts) until the November Fed Meeting.
For now, we expect further chop in prices of the majors, while altcoins and memes will likely continue to struggle for liquidity. However, when/if that macro 'green light' does come, we believe this will ignite a large risk-on rally, and that would be the time to diversify back out of the majors and into more altcoins and memes.We continue to hold BTC, ETH, SOL, WIF, and POPCAT, and we'll diversify upon that macro 'green light'. However, for now, further patience is needed while we assess incoming data.
Recommended from Cryptonary


