Save 23% ($351) & Get a Free 1-1 Call with our Team ⏰ : 0d 2h 59m 44s
Disclaimer: This is not financial or investment advice. You are responsible for any capital-related decisions you make, and only you are accountable for the results.
LINK:
Overview
Chainlink ($LINK) has been a strong player in the cryptocurrency space since its launch in September 2017. Throughout its history, Chainlink has experienced multiple cycles of exponential growth and deep retracements.After a significant breakout in 2021, reaching an all-time high of $53 in May 2021, LINK has been consolidating, forming crucial support and resistance levels.
As of now, Chainlink is trading at a pivotal point, attempting to break through key moving averages and resistances on both the weekly and daily timeframes, which could signal the next big move.
Weekly timeframe (logarithmic chart)
Chainlink's price action has demonstrated base-over-base formations, which is a bullish sign for long-term price movements. After the 2017-2018 rally, where LINK moved from $0.18 to $1.4, it saw a deep retracement of 87% but later pushed back to $5.1 in 2019. Since then, the asset has shown its strength with several bullish legs up, culminating in its 2021 high of $53.Key weekly observations:
- 2017-2018 base: After the initial surge, LINK retraced down to $1.4 multiple times and established it as a crucial support level.
- Exponential rally: The breakout in 2021 took LINK to an all-time high of $53, marking a massive move from the $5.1 base.
- Current demand zone: Following its retracement from the ATH, LINK found strong support in a weekly demand zone ranging from $7.12 to $8.25, which has held price action in check over the past few months.
- Consolidation period: Between May 2022 and October 2023, LINK was locked in a tight consolidation range between $9.63 and $5.1, spending over 500 days within this range, signifying strong accumulation.
- Breakout: After breaking out of the range, LINK rallied 135% from $9.63 to $22.8 before retracing back to test the support zone at $9.63. Price wicked into the weekly demand zone but stayed above $9.63, forming a solid base.
- 200 EMA (weekly): LINK is currently hovering around the 200 EMA at $11.3, with price testing this level. If the price holds and breaks above, we could see a bullish continuation toward $18.3 and possibly beyond.
Next key levels:
- Upside: If the 200 EMA at $11.3 is flipped, LINK could rally to $18.3, followed by $22.8, the recent swing high.
- Downside: Strong support remains at $9.63, with further downside protection at the weekly demand zone between $8.25 and $7.12.

Daily timeframe (regular chart)
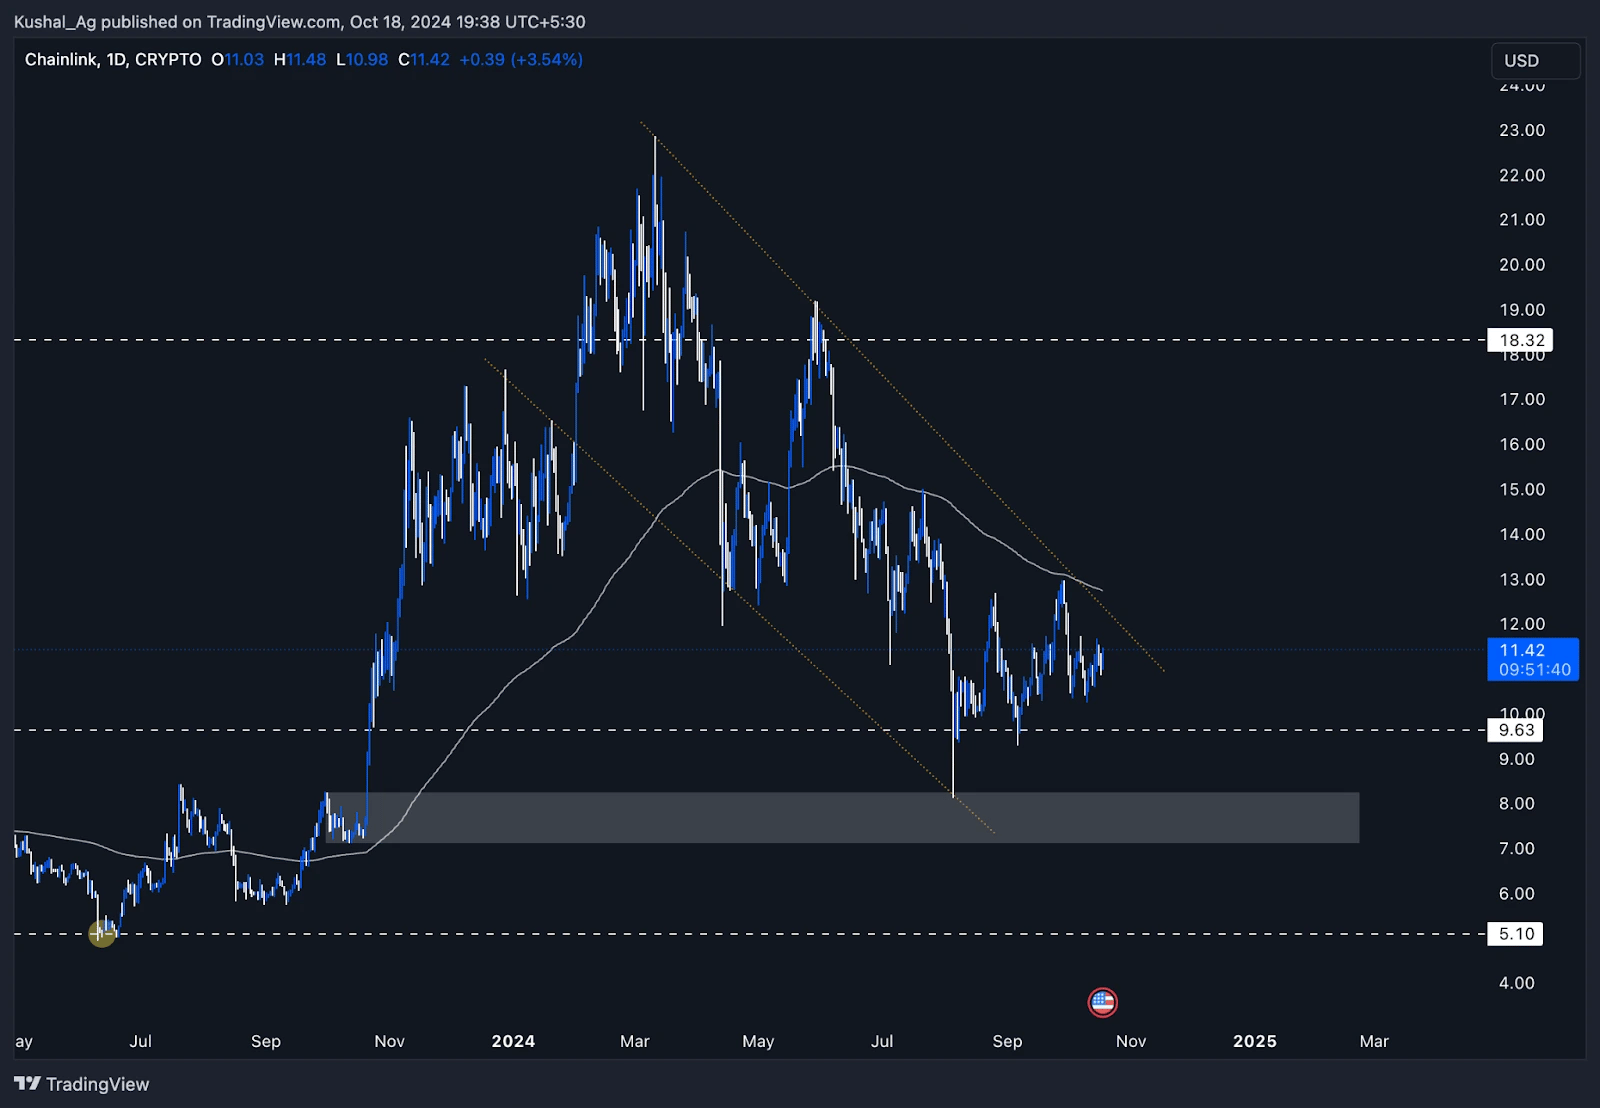
During the daily timeframe, LINK's recent price action has formed a bullish flag pattern, indicating potential continuation of the upside.Key daily observations:
- 200 EMA (daily): Price is currently testing the 200 EMA on the daily, which sits at $12.75. Breaking and sustaining above this level will be critical for a further upside move.
- Bull flag formation: After reaching $22.8, LINK retraced in a controlled manner, forming a flag pattern. This kind of price action often signals consolidation before a breakout.
- Demand zone: The weekly demand zone also holds significance on the daily timeframe, adding confluence for the $7.12 to $8.25 range as a solid support area.
- Resistance levels: Immediate resistance lies at $12.75 (the 200 EMA), followed by $18.3 and then $22.8.
Potential breakout levels:
- Bullish scenario: If LINK breaks out of the bull flag and claims the $12.75 level, it could rally toward the $18.3 and $22.8 levels. A close above $22.8 would signal further continuation to the upside, with the possibility of testing the ATH around $53.
- Bearish scenario: On the downside, strong support lies at $9.63. If this fails, the demand zone between $8.25 and $7.12 will likely act as the next accumulation area.
Cryptonary's take
Chainlink is at a pivotal moment, trading around its 200 EMA in both daily and weekly timeframes. While Chainlink isn't the top meme play this cycle, its strong technical structure, coupled with key moving averages and demand zones, makes it an asset to watch.If LINK breaks above the 200 EMA and consolidates, we could see a significant rally to $18.3 and eventually a test of the $22.8 level. However, caution is warranted, and we are monitoring whether the price can sustain momentum above key resistance levels.
SHIB:
Overview
Shiba Inu ($SHIB) continues to be one of the largest meme coins by market capitalization, having held a strong presence in the market for an extended period. While not a focus of our core strategy, it remains a key asset in the cryptocurrency ecosystem, warranting analysis due to its significant market movements.From a technical perspective, SHIB has displayed some interesting patterns on the charts, providing a potential setup for traders to keep an eye on. Given its long-standing market presence and current price action, this is a good opportunity to examine its latest performance, especially in relation to key support and resistance levels.
Daily timeframe analysis
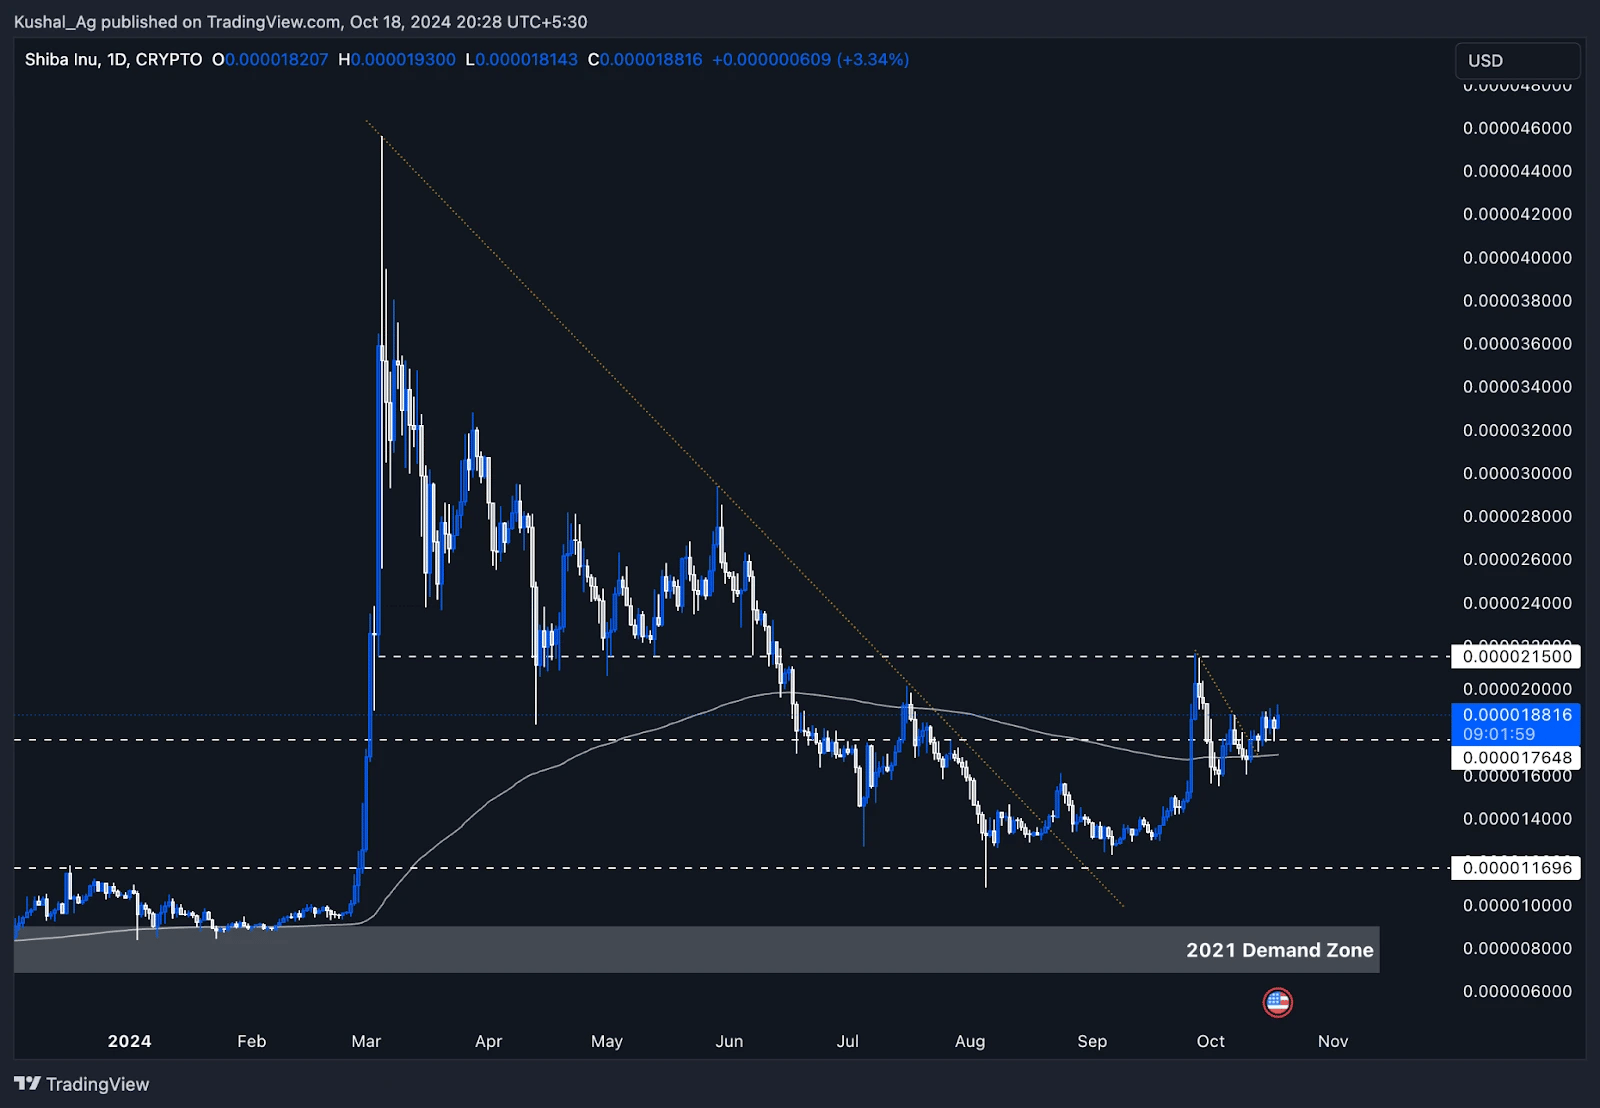
On the daily chart, SHIB has recently been trading in a range between $0.0000176 and $0.0000215. This range has served as both support and resistance as SHIB struggles to make a decisive move in either direction. The 200 EMA currently lies at $0.0000168, offering a crucial support level that SHIB has been testing.From a structural standpoint, SHIB broke out from its prior downtrend earlier this year and has since been consolidating within this range. The $0.0000215 resistance level remains the next key hurdle for SHIB, and a break above this level could lead to a potential move toward its local high of $0.000045 made in March 2024.
On the downside, SHIB's immediate support sits at the $0.0000116 level. If the price fails to maintain its current levels, a break below the 200 EMA would likely result in a retest of this support. Beyond that, the demand zone from 2021, ranging between $0.0000068 and $0.000009, remains a significant longer-term support zone.
Conclusion
While SHIB has shown strength in holding key support levels, the price remains within a range, and we'll need to see a decisive breakout to signal further momentum. The technicals indicate that SHIB has the potential for another move on the upside if it can break the $0.0000215 resistance with conviction.However, the downside support levels, including the 200 EMA and the 2021 demand zone, are crucial to monitor for any retracement.
This is a setup to watch closely, but at this point, it's essential to stay neutral and observe how SHIB reacts to its current levels before drawing any conclusions about its next move.
Recommended from Cryptonary


