Save 23% ($351) & Get a Free 1-1 Call with our Team ⏰ : 0d 2h 59m 43s
Disclaimer: This is not financial or investment advice. You are responsible for any capital-related decisions you make, and only you are accountable for the results.
BTC:
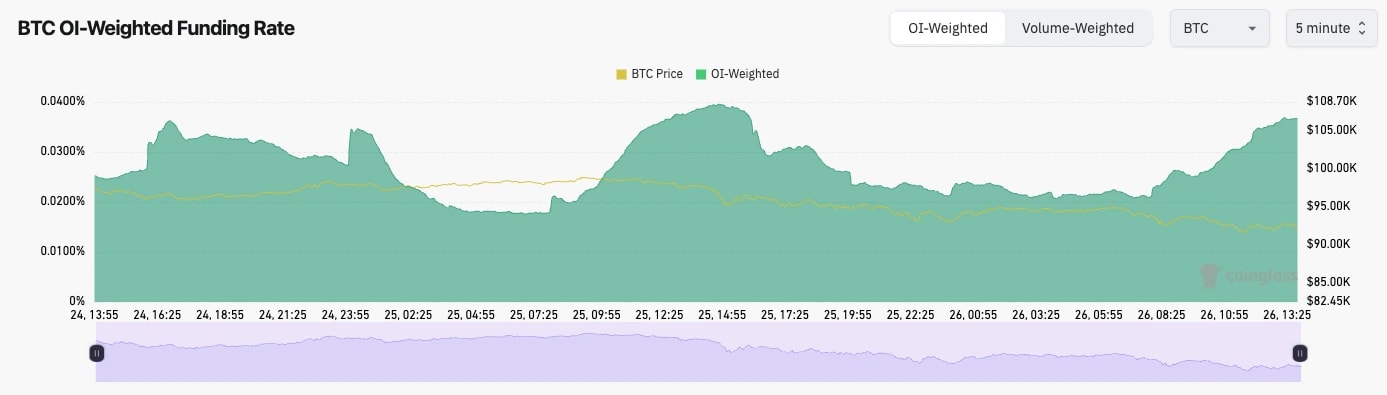
- As BTC has retraced from $99k back to $92k, Open Interest (the amount of leverage in the system) has pulled back very slightly, although it still remains very high.
- The Funding Rate has also crept back up again to 0.038%, indicating that new Longs have piled in on this 7% price pullback for BTC.
- In bull markets, it's common to see the amount of leverage be high. However, currently, this doesn't strike us as enough of a flush out yet. Therefore, it's possible that BTC could still see slightly more of a pullback here, potentially somewhere between $87k and $92k.
BTC funding rate (5min timeframe):
 Technical analysis
- BTC broke out of the bullish pennant at the $92k level and immediately moved on to $99k, where it was met with large sellers at $100k. As to be expected at that psychological level.
- The price was extremely overbought, and as we mentioned in our last update, it had caused a bearish divergence. This is now playing out with price pulling back.
- This pullback has seen the RSI pull down from extremely overbought territory to 61. This is welcome, and we'd even welcome slightly more.
- Price is now resting on top of the old local resistance ($92k) and the new local support of $92k.
- Beneath $92k, there is a more significant support zone between $87k and $92k. We expect the price to find support in this zone, and we'd be extremely surprised if the price were to fall below $87k in the short term.
- On the upside, the resistance is at an all-time high of $99,500.
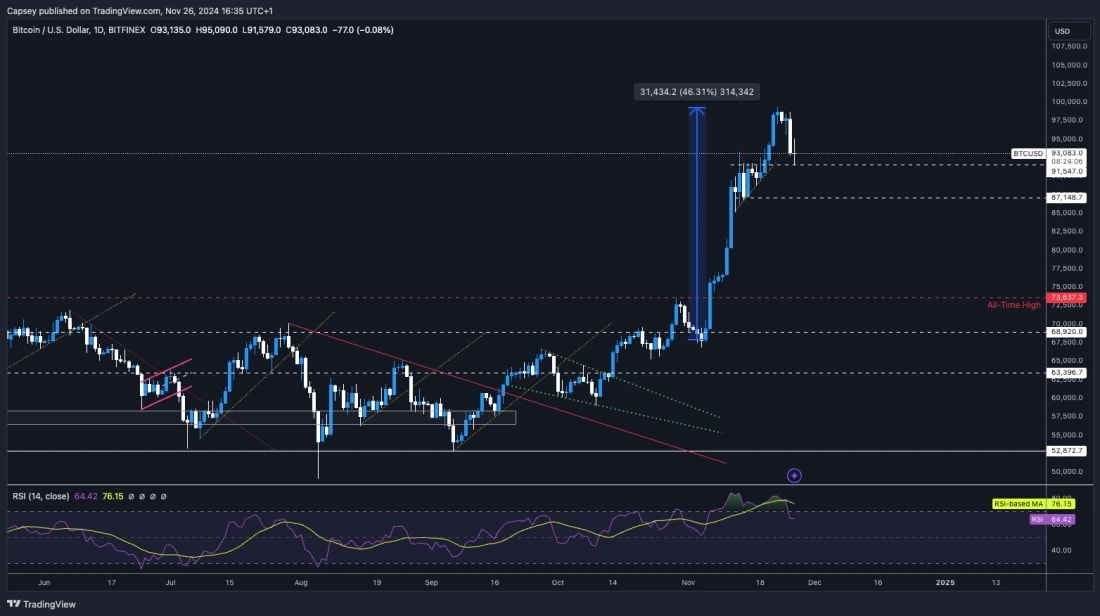
- Next Support: $91,500
- Next Resistance: $99,500
- Direction: Neutral
- Upside Target: $99,500
- Downside Target: $87,000
Cryptonary's take
Price was up 46% in 3 weeks (since the election), and a pullback was absolutely needed. And we had called for this for the last week, where we have exercised some caution across the board. This pullback for price is very normal in a bull market, and it might feel worse in that most don't have much exposure to BTC, and rather Alts and Meme's, which, in our view, are yet to really have their run.We expect BTC to find support over the next week, probably below $92k, but between the range of $87k and $92k. What we're looking for is a break into the range (between $87k and $92K) and enough of a breakdown that we see the Open Interest pull back more substantially and Funding reset. We expect this over the next week. Once/if we get that, we'd look at that as being the local bottom.
For now, we're sitting tight in Spot positions, as we signalled for last week. We are in a majorly bullish environment overall, so it would feel wrong to sell Spot when we expect much more from this market over the coming months. We remain in Spot, with no plans to sell soon.
ETH:
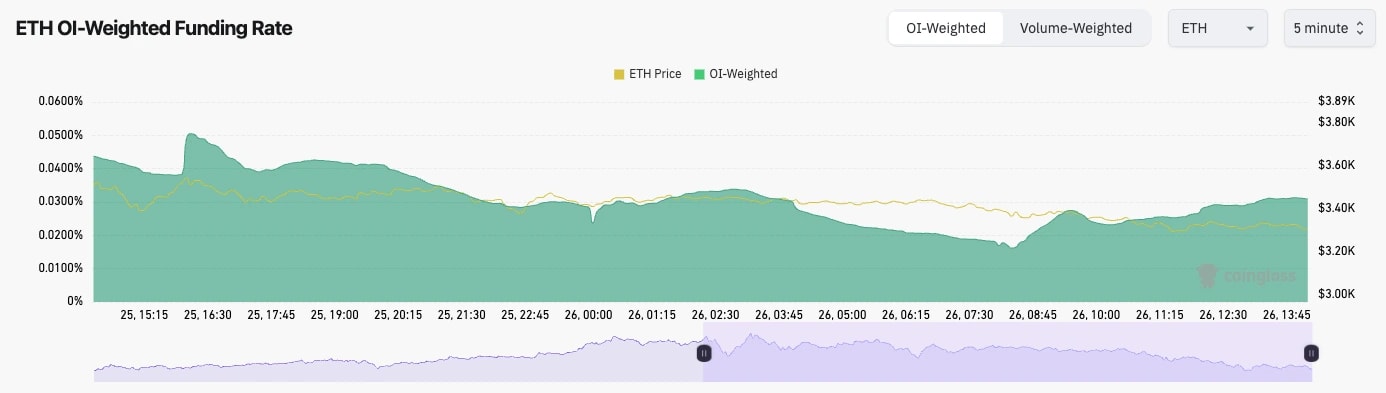
- Like BTC, ETH's Open Interest remain very high. An element of this may be institutional players taking advantage of the carry trade, longing the ETF, shortening the futures, and profiting from the funding rate.
- ETH's Funding Rate also remains high at the 0.03% level, although it has been higher, and this isn't very extreme here, all things considered.
- ETH looks less vulnerable to a flush-out in comparison to BTC, even though it is still somewhat overheated here.
Technical analysis
- Much more positive price action from ETH here, with it being able to hold above the $3,280 horizontal support.
- For now, in the short term, the $3,480 horizontal level remains the major resistance.
- A break above $3,480 and ETH likely moves on to $4,000.
- If $3,280 is lost to the downside, then it's possible that ETH pulls back as much as $3,000, although there is a fair amount of support between $3,000 and $3,280.
- The RSI was overbought but has recently approached back into overbought territory, with it now resetting to 61. This is positive to see it's not overbought.
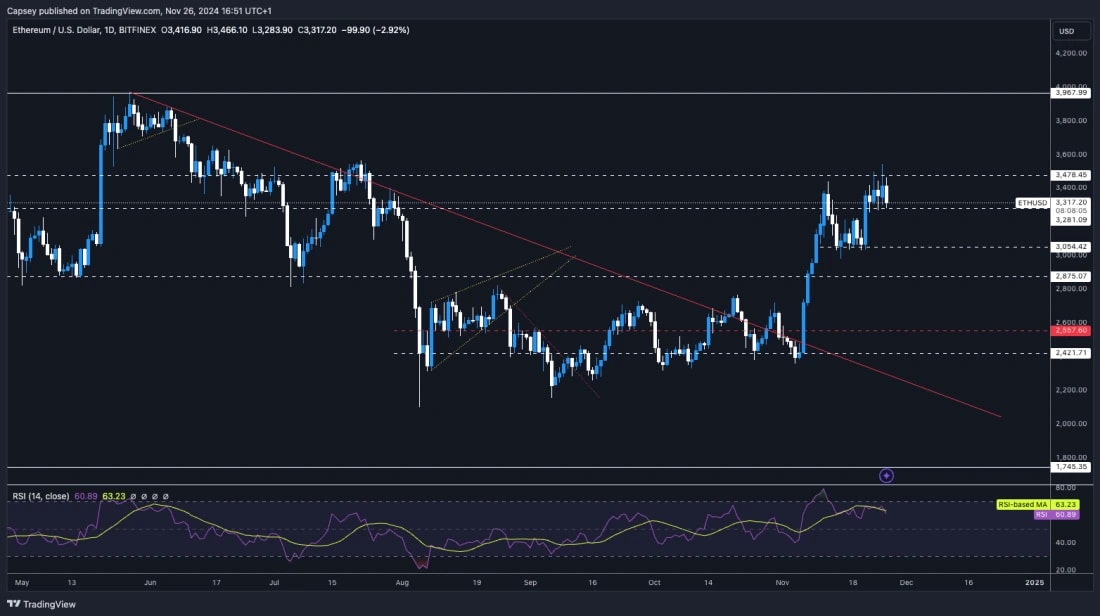
- Next Support: $3,280
- Next Resistance: $3,480
- Direction: Neutral/Bullish
- Upside Target: $4,000
- Downside Target: $3,050
Cryptonary's take
This is the first time ETH has performed relatively well, even with the rest of the market seeing a more significant pullback. Institutions may be looking at ETH here and saying, "It's 25% off its all-time highs, whilst BTC is 50% above its old all-time highs; there is some divergence here".This may then attract institutional money into ETH here as it's beginning to look more attractive in relation to BTC, despite ETH still somewhat lacking the narrative.
We'd like to see ETH continue to find support above $3,280. If it does this, we'll grow in confidence that a $3,480 break out is on the cards.
We're holding Spot ETH and are not looking to sell it here. Overall, we think ETH looks relatively positive here, especially if BTC can avoid a larger pullback to the $87k area, let's say.
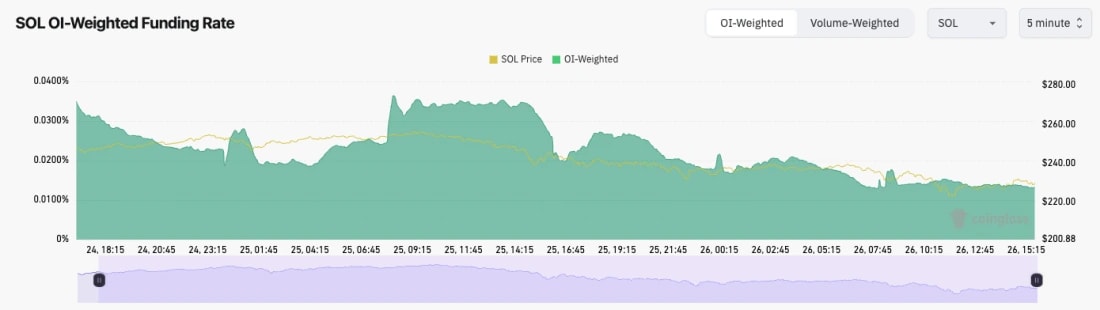
SOL:
- Like BTC and ETH, SOL's Open Interest is also very high despite its recent shallow pullback from the highs.
- The Funding Rate is interesting. It has more meaningfully reset and is back close to the 0.01% level, indicating even positioning. Longs are not getting overly aggressive here.
- SOL has a much healthier leverage setup than BTC and ETH.
Technical analysis
- SOL was initially rejected from the prior all-time high of $260. This is the new major resistance.
- The price has pulled back, and it's using the prior local resistance of $220 as new local support.
- We expect the zone between $203 and $220 to be significant support, and we don't expect SOL to break below this support zone.
- SOL has pulled back substantially from overbought territory, having been at 77 on the RSI. It's now at 55, which is a significant pullback and a really clean resetting.
- Next Support: $220
- Next Resistance: $260
- Direction: Neutral/Bullish
- Upside Target: $260
- Downside Target: $200
Cryptonary's take
SOL looks like the best setup out of the majors (BTC, ETH, and SOL). It's had a reasonable pullback where the price is now sat on top of a major support zone, and the overbought indicators have also reset substantially. A really nice natural pullback within a larger uptrend.We expect SOL to consolidate on top of/or in and around $220 before moving back up in the coming weeks. We're not looking to sell any Spot SOL anytime soon; we think SOL looks very positive here, even if there is a consolidation in the short term.
WIF:
- In our last update, we called that WIF might pull back and retest the grey box between $2.84 and $2.97. We have now had that retest.
- WIF was rejected at the horizontal resistance of $3.40 a number of times and couldn't seem to surpass it, so that's the next major market for WIF to clear above.
- If WIF loses the grey box, then the next area is $2.55. However, we expect the grey box to hold for WIF.
- On the move down in price, the RSI reset substantially, having been majorly overbought.
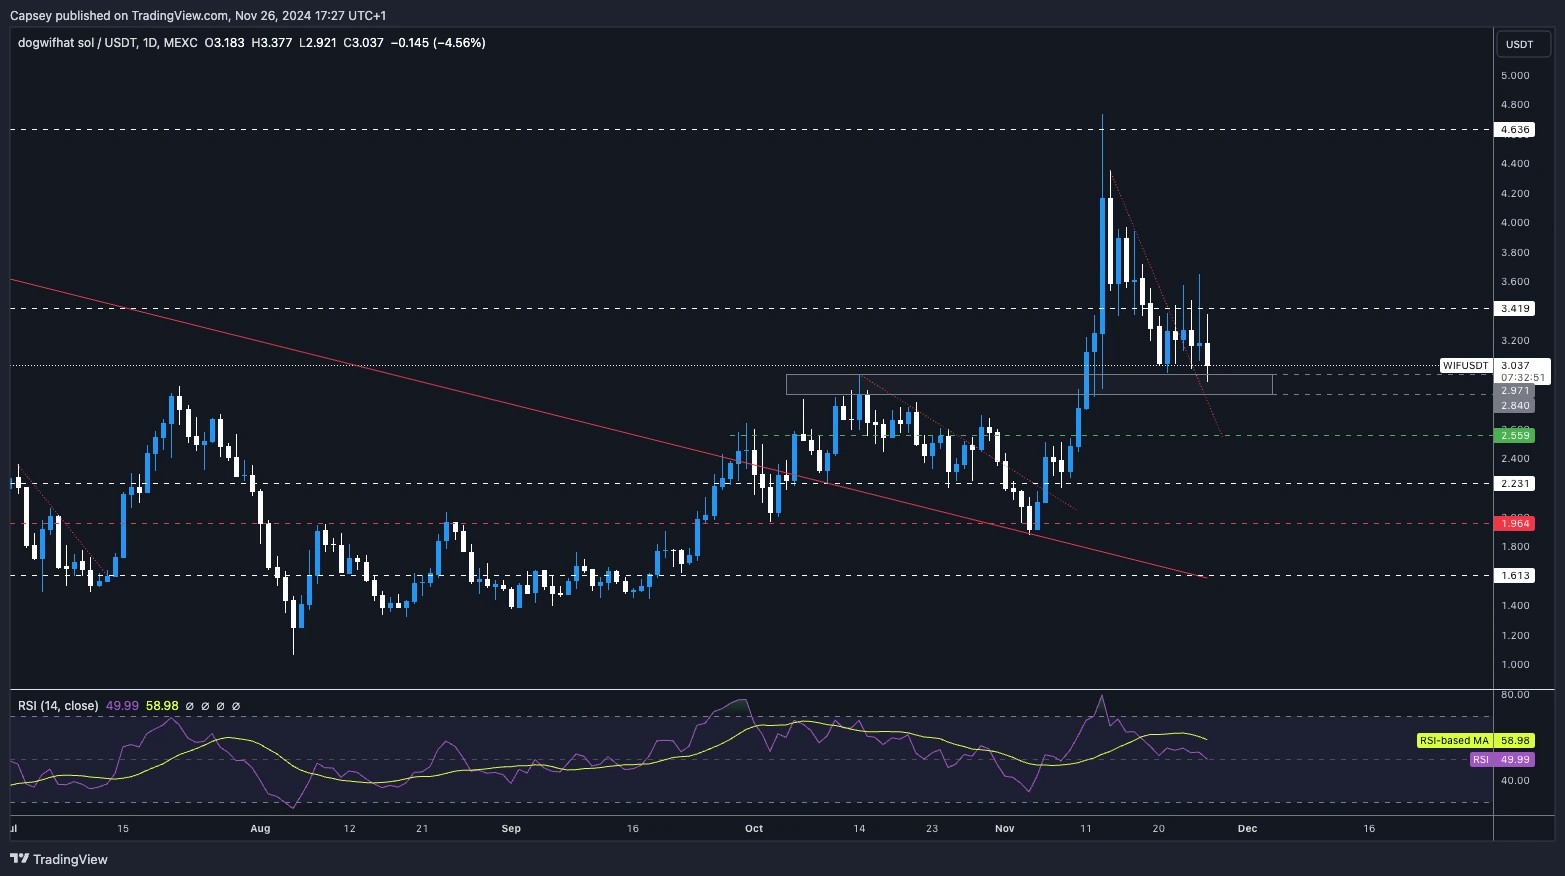
- Next Support: $2.85
- Next Resistance: $3.40
- Direction: Neutral
- Upside Target: $3.40 (then $4.00)
- Downside Target: $2.85
Cryptonary's take
WIF is now listed on major Exchanges, which is a huge plus for this coin. We expect this to be the major winner of this cycle, with it being the number 1 SOL meme. The grey box is and was the area for those to accumulate who may be underweight WIF. We expect there to be more chop over the coming days, but we think WIF has done the majority of its pullback here.Overall, we're extremely optimistic about the outlook for WIF, so we're not looking to sell Spot holdings anytime soon.
POPCAT:
- One we've called wrong, unfortunately. We thought POPCAT might bounce from the $1.40 area, but the price broke below the uptrend line and the horizontal support.
- There is a support box between $1.13 and $1.20. We would expect this to be the major support for POPCAT if it were to even pull back that far.
- The price is in a local downtrend, so we would expect a break out at some point, with the local target being the prior support, with the new resistance at $1.40 and then $1.60 above that.
- The RSI has reset substantially, and it is now back to 40.
- One interesting and very positive element here is that we now have a hidden bullish divergence (a higher low in price and a lower low on the oscillator). It may be that this downtrend is close to being over.
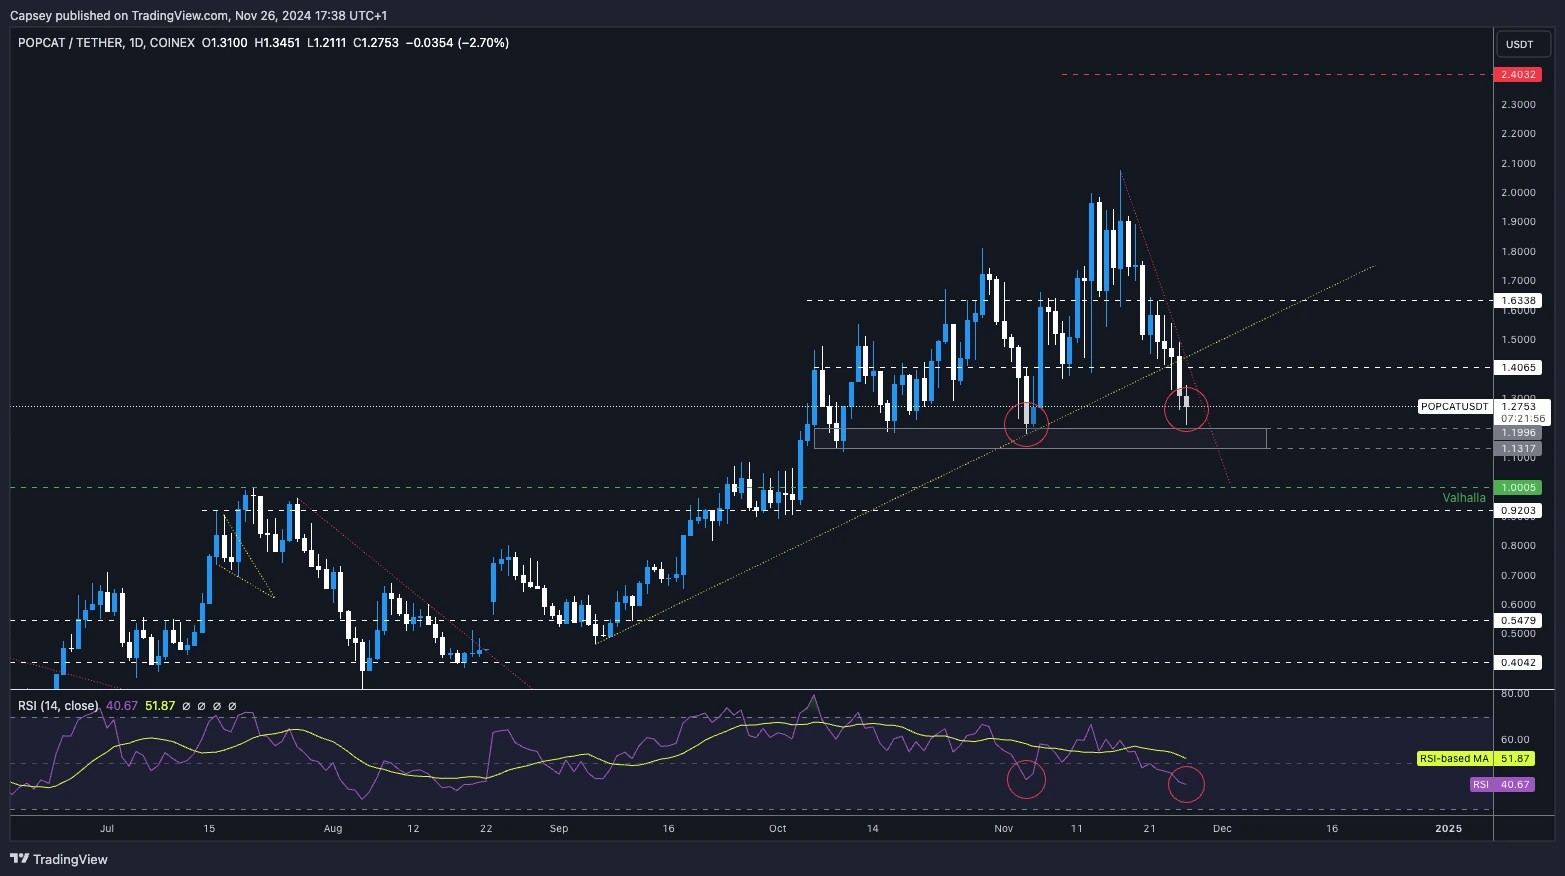
- Next Support: $1.20
- Next Resistance: $1.40
- Direction: Neutral
- Upside Target: $1.60
- Downside Target: $1.13
Cryptonary's take
POPCAT is now back to levels that look very attractive, particularly now that the RSI has reset and put in a hidden bullish divergence. Our concerns are that it's out of its main uptrend and below the $1.40 horizontal level.We do expect POPCAT to break out of its downtrend in the coming week and likely retest the $1.40 to $1.60 range. We will reassess again once/if we get that. That's our current thinking for POP.
In the long term, we're still very bullish, and there's no change to our thesis.
SPX:
- In the majority, SPX has continued its downtrend and has been unable to breach the above resistance areas.
- The main resistance on the local timeframes is the $0.55 to $0.60 area.
- SPX is now in the zone that it has used as prior support between $0.45 and $0.50.
- One concern here is the continuation of declining volumes.
- If SPX can reclaim $0.50, this may help fuel a retest of $0.60, but it's pivotal that the price can get back above the recent local resistance of $0.55.
- Price has formed what looks to be a double bottom at $0.45, so this may help fuel a move higher in the short term.
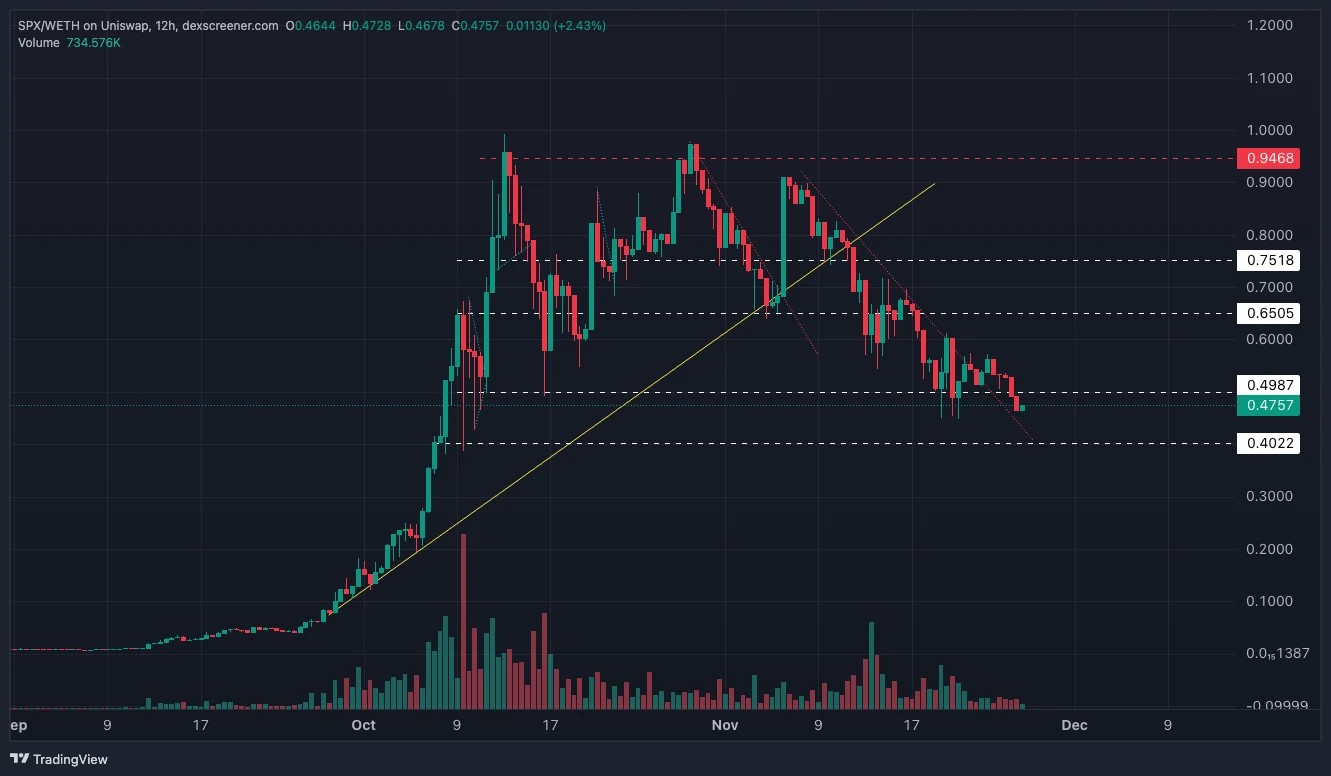
- Next Support: $0.45
- Next Resistance: $0.60
- Direction: Neutral
- Upside Target: $0.60
- Downside Target: $0.40
Cryptonary's take
Following a massive move higher, it's not too surprising to see profits being booked by larger holders, which may have impacted the price action here over the last few weeks.However, we're now likely close to the end of that, and it looks as if the price is double-bottoming here, so this may be a good area to begin building a position if you're underexposed. We're expecting continued chop, but with a chance, SPX will try for a breakout in the coming week.
Recommended from Cryptonary


