Save 23% ($351) & Get a Free 1-1 Call with our Team ⏰ : 0d 2h 59m 43s

As the crypto market keeps shifting, staying ahead demands a sharp understanding of key trends. Today, we'll break down Bitcoin's recent price action and the dynamics of Ethereum and Solana and give you updates on standout assets like WIF and POPCAT.
Let's dive in!
Disclaimer: This is not financial or investment advice. You are responsible for any capital-related decisions you make, and only you are accountable for the results.
BTC
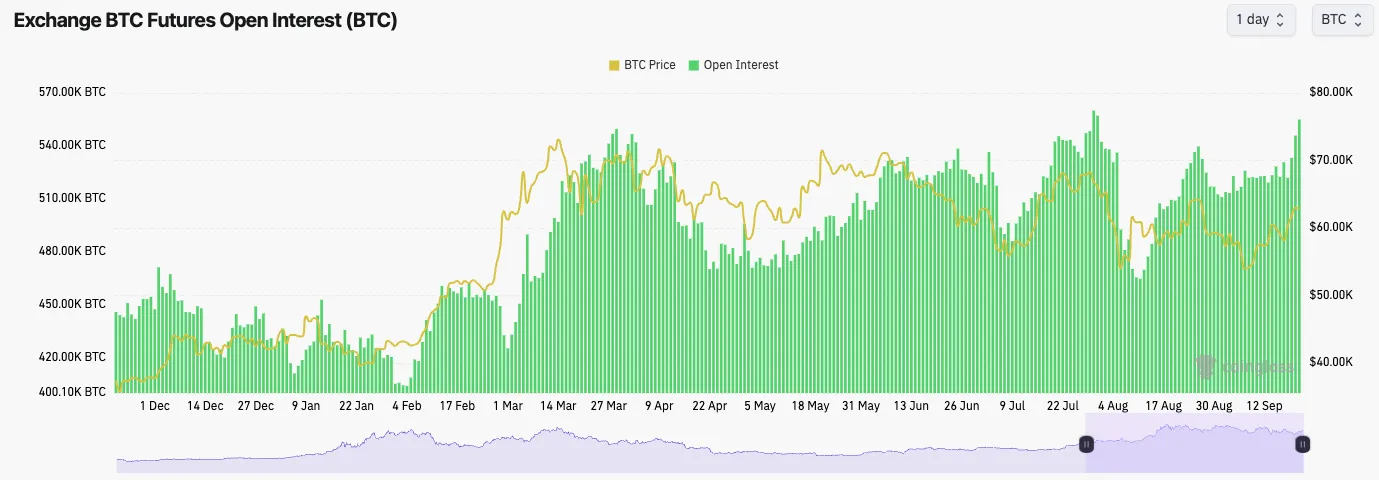
- Bitcoin's funding rate has mostly been positive but fluctuated, and the open interest rate has increased more noticeably.
- A rising OI, especially considering that it's mostly Longs, might mean the price is vulnerable to a small flush out to the downside, shaking out these late Longs.
- We wouldn't expect the flush out to be severe, potentially just a 2-3% price move lower before a rebound.
Note: Note the larger-than-usual increase in OI (far right-hand side of the chart) in the last few days as the price has moved higher.
Technical analysis
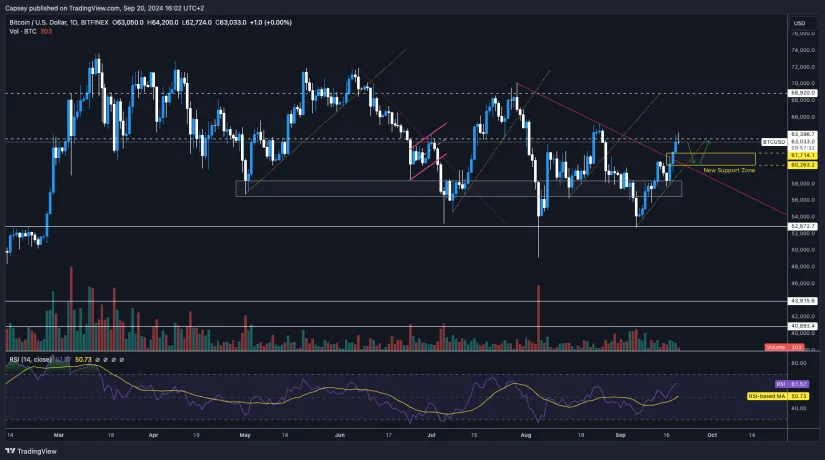
- In the last Market Direction we released, we mentioned BTC pulling back from $60k, retesting $58k, and then pushing on to retest $63,400, which is exactly what's happened.
- Price is now testing the horizontal resistance at $63,400 but struggling to maintain above it.
- In the short term, $63,400 may act as enough of a resistance that the price rejects from that area.
- We would be looking at a slight pullback and retest of $60,200 to $61,800 as an area of support.
- If price does lose $60k, we'd expect $56k to $58k to act as support again.
- What we do like is that BTC is still in it's local uptrend whilst it has also broken out of the local red downtrend line.
- The RSI isn't yet close to being overbought so there is still the potential for more upside to be had here.
Cryptonary's take
In the short-term (next 2-4 days), we expect the price to pull back very slightly from $63,000 and potentially retest the Yellow box area (between $60,200 and $61,700). But, beyond that, we think there can still be another positive week or two before we move closer to the build-up of the election, where markets might get more jittery throughout October, and the level of risk-on might be more subdued during that period. Over the next 10-14 days, we're expecting the price to remain relatively range-bound between $60k and $64k, but it is more tricky to call here beyond a very shorter-term pullback, which we think is likely. Let's see what we get beyond that.ETH
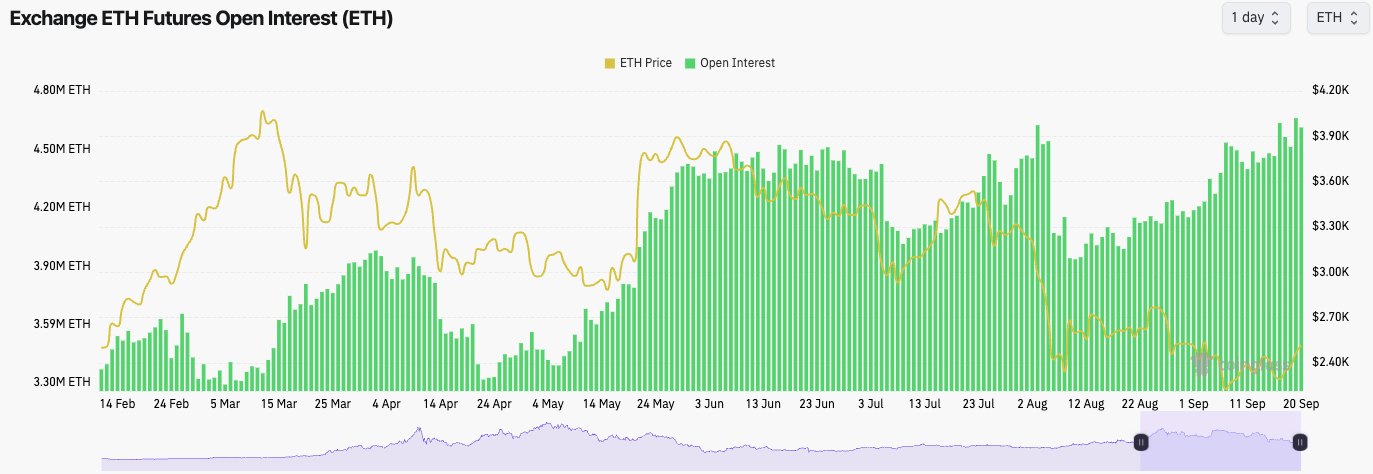
- ETH's Open Interest has been in a relatively steep uptrend, with Funding Rates positive over the last few days, indicating that the leverage that has gone on is long.
- This is a potential setup for a small flush to the downside, again wiping out late Longs, although the price could likely rebound following a small flush out.
Note: ETH's OI is gradually increasing.
Technical analysis
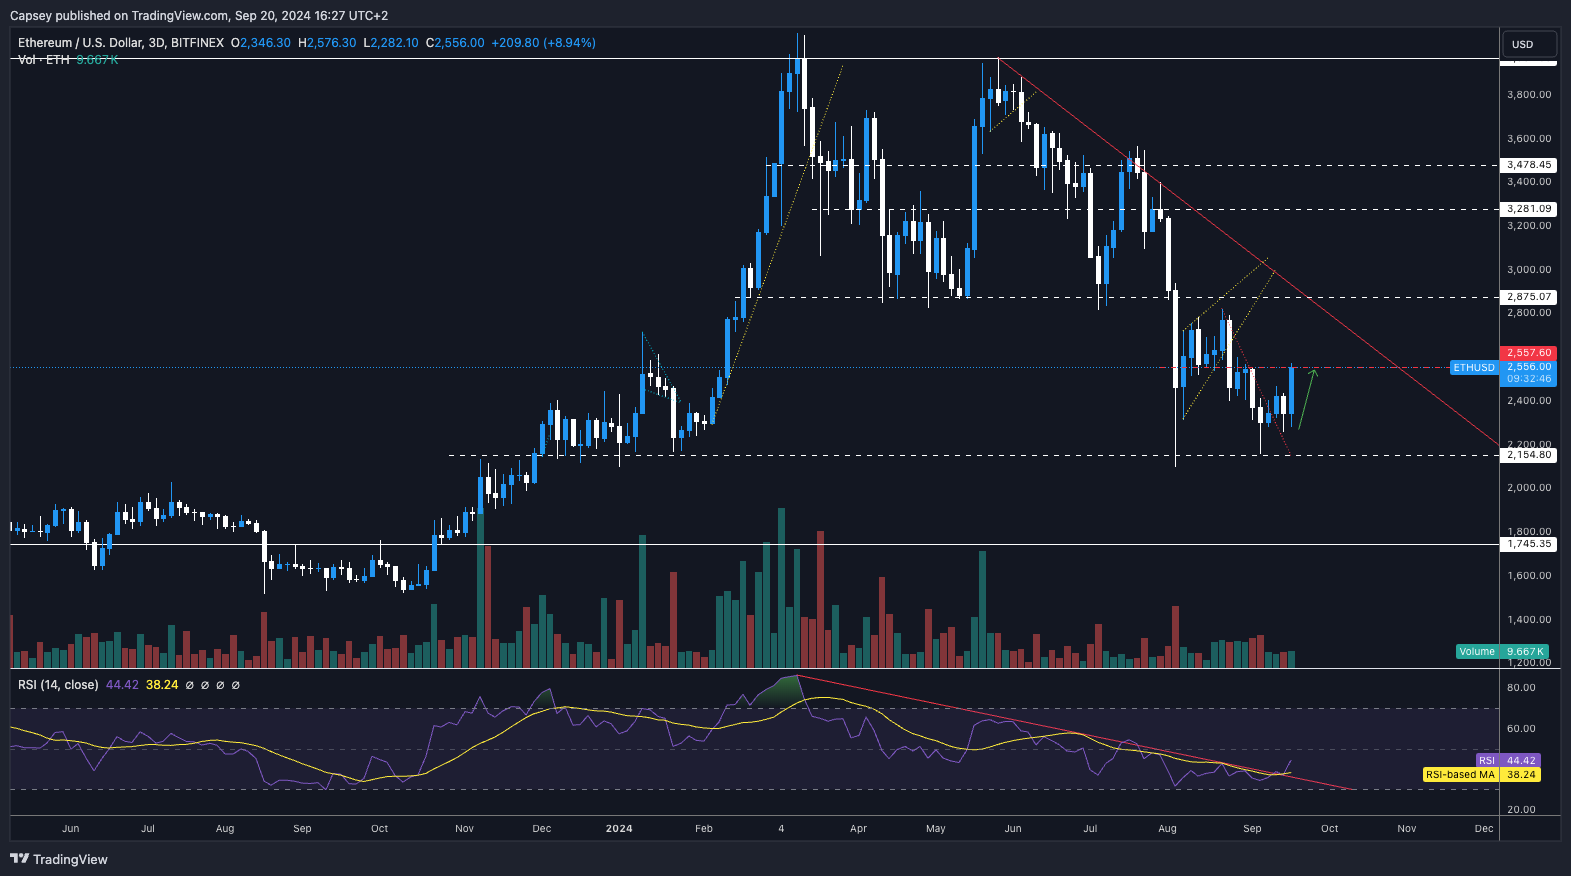
- For ETH, our focus has been on the 3D timeframe/chart, so for now, that's where we'll stay.
- ETH has found support on the horizontal support of $2,150 and has been able to bounce from there.
- Price is now retesting the underside of the local horizontal resistance of $2,557. We think this can be a short-term stopping zone for ETH.
- It's possible that a short-term retest of $2,450 is on the cards first before ETH can break out above $2,557 and potentially then head up to $2,800.
- The RSI on the 3D chart is really clean, showing a breakout of the downtrend that has been the trend since March.
Cryptonary's take
ETH has lacked momentum and it may therefore take more days to consolidate under $2,557 before it breaks above it. But, that's our expectation for ETH to break back above $2,557 and possibly push up to $2,800 in the upcoming weeks. In the immediate term (next 2-4 days), it's possible ETH will remain between $2,400 and $2,550 - consolidate below the local horizontal resistance of $2,557.SOL
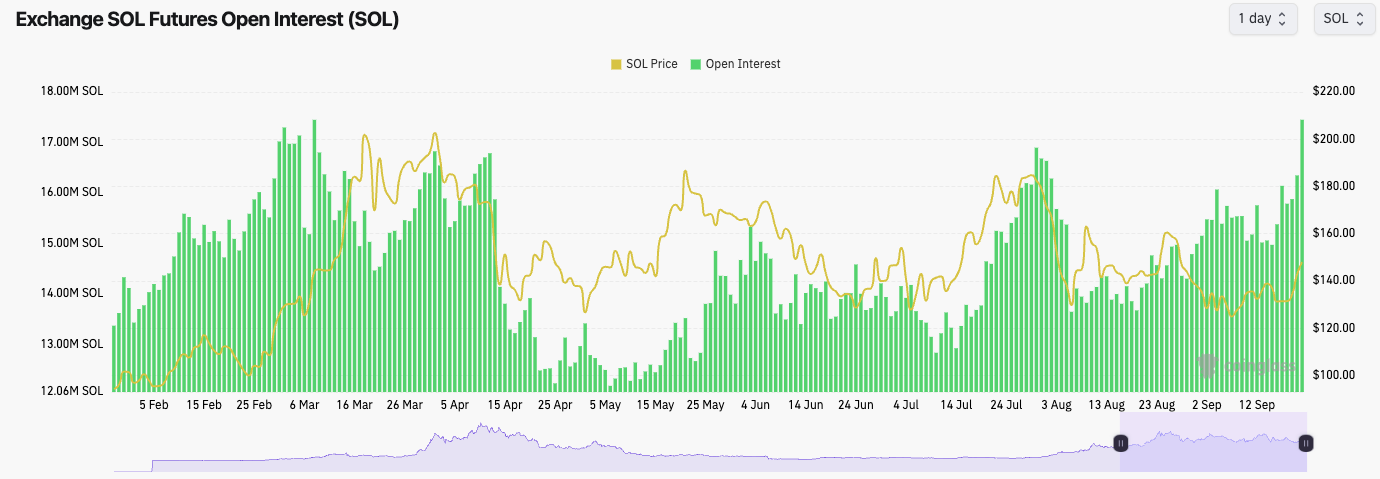
- SOL's Open Interest has increased substantially over the last 48 hours, whilst Funding is at 0.01%.
- This indicates that a lot of late Longs have piled in to SOL as price has moved higher over the last day or so. This likely results in a quick flush out to the downside wiping out some of these late Longs, before possibly reversing back up again.
Note: the large increase (far right-hand side of the chart) in Open Interest.
Technical analysis
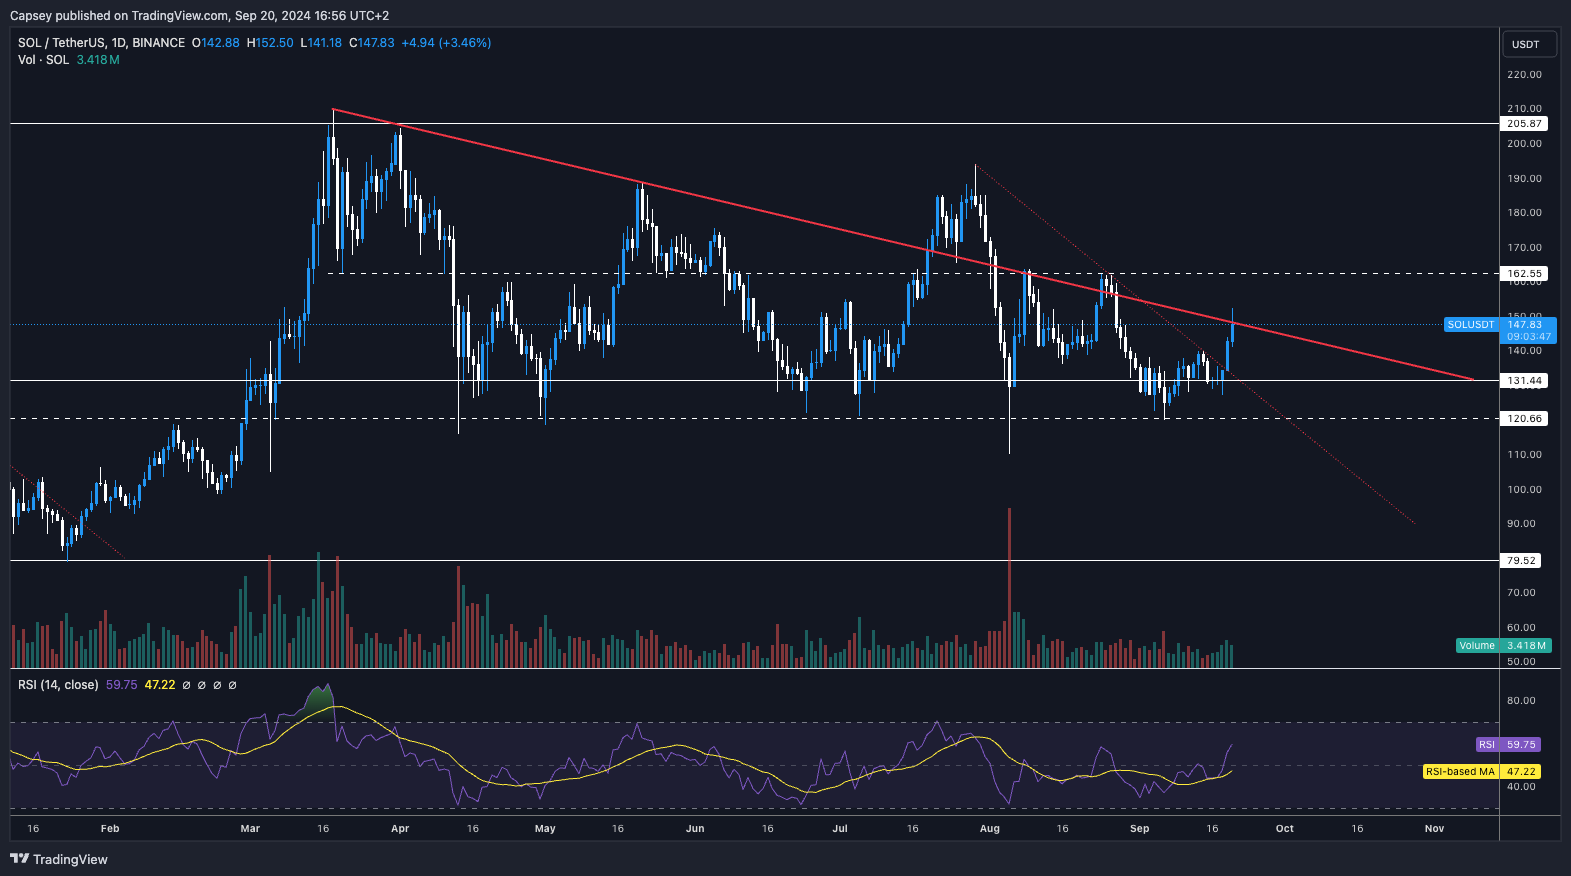
- SOL has bounced from its support zone between $120 and $131 and has now pushed up to retest the underside of the main downtrend line.
- Price initially cleared the $130 area due to the price being able to break out from the local downtrend line, which has helped fuel this 15% increase in price.
- Price may stall at this local level in the immediate term, but we are expecting a further breakout in the coming week or two.
- If the price does break out from the main downtrend line, the next major resistance will likely be the horizontal level at $162.
- The RSI is still not near overbought territory, so it's possible that the price can run further after a short period of consolidation beneath the main uptrend line.
Cryptonary's take
In the immediate term, we're expecting the price to be rejected at the main downtrend line and consolidate for a few days beneath it. But, we then expect the price to break out and move higher. We do, however, think we'll see a small flush out of the late Longs that have piled on over the last few days, which may see the price revisit $139 before rebounding higher from there.WIF
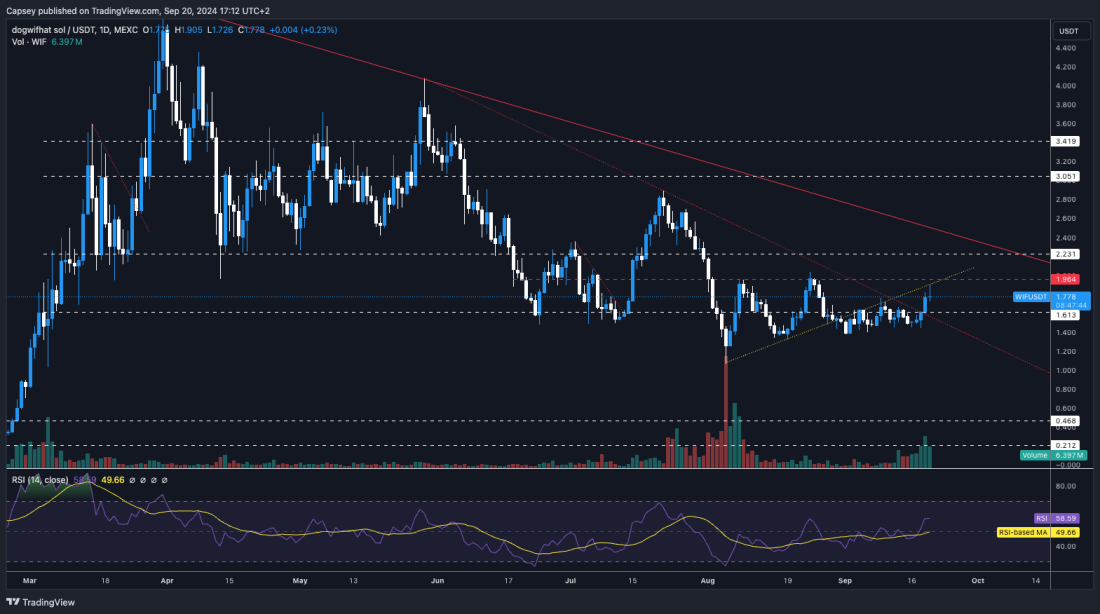
- WIF has broken above the horizontal level of $1.60, which was acting as a resistance for price.
- However, the price has now found new resistance at the underside of the local uptrend line (yellow line) and also the local horizontal resistance of $1.96.
- What's positive to see is an increase in volume and a breakout to the upside of the range rather than the downside.
- For the price to really clear higher, the price needs to reclaim the $1.96 level, and then ideally $2.20, as we see that as the last key local level before WIF can make a much larger move higher, potentially then progressing up to $3.05.
- On the downside, it's pivotal that the $1.50 to $1.60 area is held as a support zone.
Cryptonary's take
In the short-term, we think the rally for WIF might have stalled around here. But, we're hoping that WIF can now hold itself above $1.60, establish itself in a new and higher range, which can then setup a major breakout in the weeks to come. In the immediate term, the level to reclaim is the $1.96 area. Above $2.20 and we should see more explosive price action to the upside. Those are the key levels to watch for now.Discover the latest insights on dogwifhat (WIF) and its impact on the market.
POPCAT
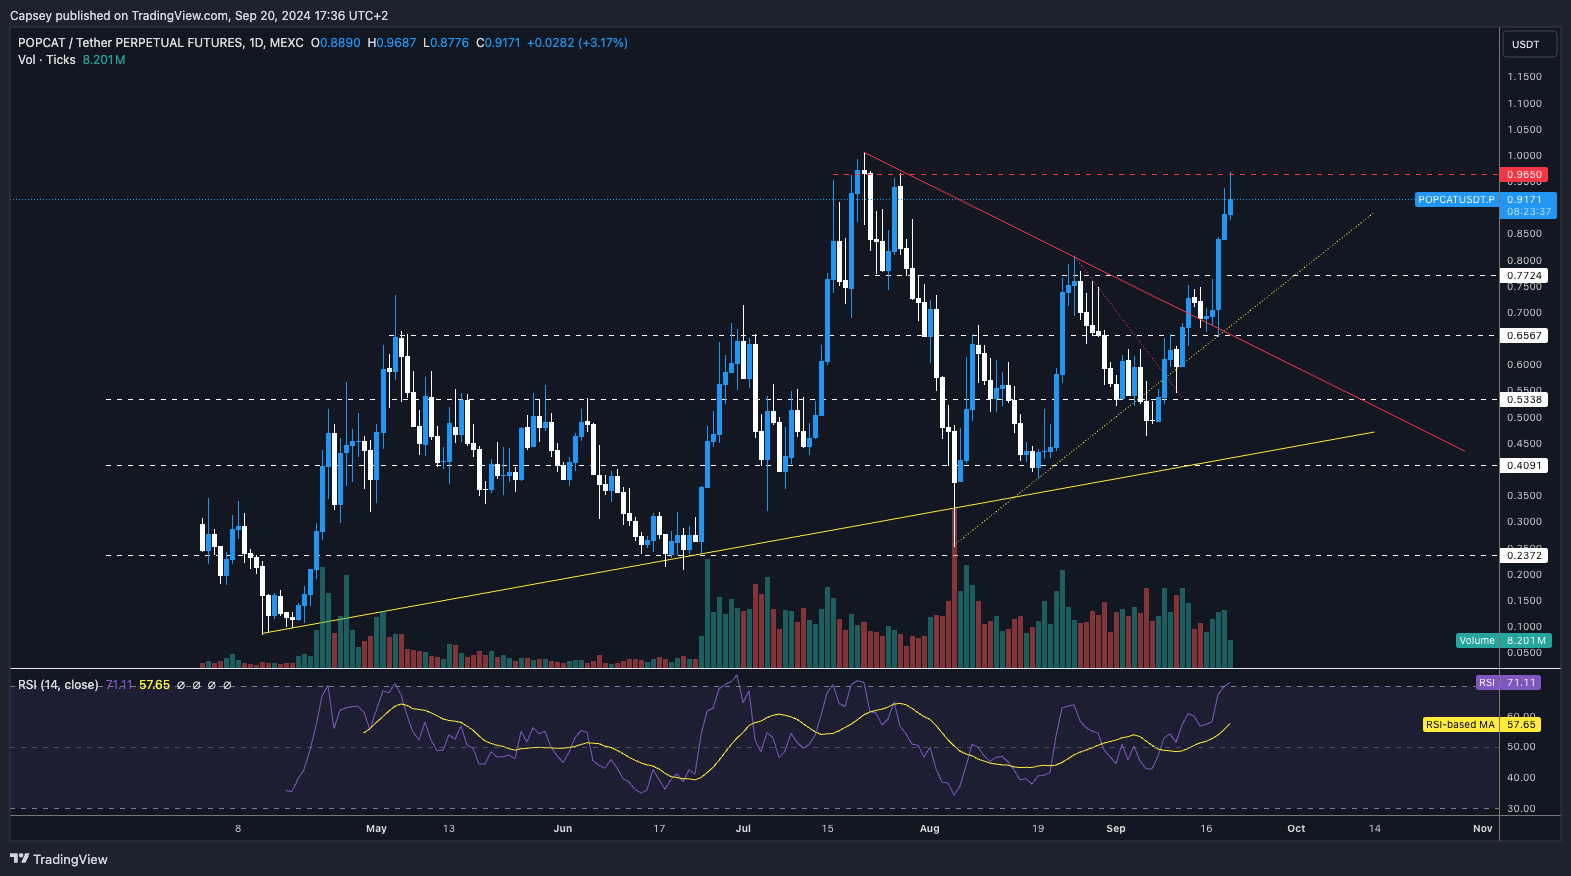
- The monster. A brilliant move to the upside, breaking out above some key levels.
- POPCAT was able to breakout of the downtrend line, retest it as support and then launch higher from there, which gave the move legs for a more substantial move to the upside.
- POPCAT has currently seemingly rejected the major horizontal resistance of $0.96, with $1.00 also being a psychological level above this. In the short term, this might be resistance.
- To the downside, the two major horizontal levels are $0.65 and then $0.77, so ideally you'd like price to find support somewhere between these levels, assuming it does pullback.
- POPCAT's RSI is now in overbought territory on the Daily timeframe, so it is possible we will see a pullback from the $0.96 major horizontal resistance.
- POPCAT has also outperformed the majority of the market, so it wouldn't be surprising to see some profit in the mid-$0.90 range.
Cryptonary's take
As we're now used to this asset, it's very possible that we will see deeper retracements. If we do get them, we'll be buyers with a view to holding them for a longer term. In the immediate term, we think POP might struggle to break above $0.96, particularly with the psychological level of $1.00 above it.This may mean the price is likely to pull back first. The area we would be targeting for this potential pullback is between $0.65 and $0.77; however, if the uptrend line is broken, then $0.53 could be on the cards. In the long term, we think it's possible we'll see POPCAT north of $2.00 by Christmas.
Recommended from Cryptonary


