Save 23% ($351) & Get a Free 1-1 Call with our Team ⏰ : 0d 2h 59m 43s
Crypto supercycle: Macro, on-chain, and technical analysis plot new timelines
Welcome to our Monthly Market Update Report, where we assess the market from a top-down approach. First, we examine the Macro environment to determine whether conditions are favourable for risk assets before moving on to on-chain data and charts.

This month's report paints a captivating picture—one where the Federal Reserve finds itself caught between a rock and a hard place, facing the dilemma of taming inflation while managing the spiralling costs of the government's swelling debt.
As the economic data paints a robust picture, the central bank may be forced to make a pivotal decision—do they ease rates into a strong economy and potentially risk inflation rearing back up, or do they maintain the "higher for longer" narrative and potentially risk the economy falling into a recession in early 2025? They absolutely want to avoid the economy falling into a recession, hence their bias to want to begin easing.
But this is where the real fireworks begin. Beneath the surface, the on-chain metrics tell a fascinating story—a tale of two cycles.
Some indicators suggest the market is nearing a state of euphoria, hinting at the possibility of a parabolic price surge in the coming months. Yet, others point to a market that still has room to run, with the potential for Bitcoin to reach dizzying new heights by the end of 2024 or early 2025.Amidst this intricate maze, the technical analysis uncovers a compelling path forward—a bullish flag that, if played out, could ignite a powerful rally, sending the market soaring.
But the road ahead may not be without its challenges, so you may need to brace for potential choppiness in the near term.
By the way, this looks like a long read, but that's mostly because it includes lots of charts. However, once you start reading, you won't want to stop.
Are you ready to make sense of where the market is headed?
Let's dive in!
TLDR
- Macro environment analysis: Examines employment, inflation, and monetary/fiscal policy dynamics - notes recent strong economic data could delay expected Fed rate cuts.
- Fed's dilemma: A strong economy may force the Fed to maintain a hawkish stance, but growing government debt could push them to cut rates to reduce interest payments.
- Divergence in on-chain metrics divergence: Some indicators suggest market euphoria and cycle top nearing, while others point to prolonged upside potential in the coming quarters.
- Technical analysis: We've identified a potential bullish flag pattern in Bitcoin's price action and see an opportunity for a breakout rally in H2 2024.
- Solana ecosystem: The Solana ecosystem remains a core focus in this bull run. We see potential buying opportunities if price pulls back to the $141-$154 range.
- Did Bitcoin ETFs change the game? At this point, it is still somewhat hard to predict, but we expect crypto ETFs to continue having a positive impact on Bitcoin demand and price.
- Choppiness ahead: You can expect near-term consolidation and volatility, but we remain bullish on crypto in the second half of 2024.
- When will the market top?: A potential peak could occur by the end of 2024 or early 2025.
Disclaimer: This is not financial or investment advice. You are responsible for any capital-related decisions you make, and only you are accountable for the results. "One Glance" by Cryptonary sometimes uses the RR trading tool to help you quickly understand our analysis. These are not signals, and they are not financial advice.
Current macro environment
Our goal in analysing the macro environment is to determine whether the macro setup is bullish or bearish for risk assets. Therefore, we will dive into the nitty-gritty details to help us flesh out an overall picture. If you want to skip the nitty-gritty details, skip to the 'Macro Conclusion' section.When we assess the macro environment, the first thing we look at is the economic data, with inflation and employment currently being the two major data sets.
Employment data
Non-farm payrolls, the Unemployment Rate, and Jobless Claims are all important data points in the employment category.Non-farm payrolls have been above 200k for three consecutive months now, although the reported numbers have been significantly larger (more jobs added). The following month, they were revised lower, but they are still north of 200k.
Alongside this, the Unemployment Rate was at 3.8% in August 2023 and dropped to 3.7% in Q4 23, before ticking up to 3.9% in January 24.
This is a good headline figure, as it shows low unemployment levels in comparison to historical standards. Jobless Claims (the number of people in the US claiming unemployment benefits) have stayed just north of 200k per week, which again is relatively low historically speaking.
All the above suggests that the labour market remains relatively robust, mostly due to stronger supply.
Inflation data
Inflation data, on the other hand, showed some more meaningful progress towards the end of 2023, despite some elements being sticky at the 3.0% level, which is considerably above the Fed's 2.0% mandated target.However, the first few readings of 2024 have been hotter than expected, yet J Powell (the Fed Chair) brushed this off as "a bump in the road" at the most recent Fed Press Conference.
But, in the most recent release (April 10), the inflation data came out hotter than expected at 0.4% MoM in Core and Headline Inflation. This may push back on Chair Powell's "just a bump in the road" narrative. It's very possible that the reason we have seen inflation come in slightly hotter at the start of 2024 is due to a robust economy and labour market.
However, this is inflationary. So, the question then becomes: How can the Fed cut rates to address this?
Cutting interest rates will reduce the restrictiveness of the current rate (and it could be argued that the current rate isn't even that restrictive), fuelling the economy further and, again, increasing inflationary pressures.With recent data coming in strong, the market has now priced in a June rate cut at less than 18%, pushing rate cuts into Q3/Q4, with a now growing expectation that there may only be 1, 2 maximum, rate cuts this year – something we have called for since December 2023.
However, Powell came across as somewhat overly dovish in the most recent Fed Press Conference. Dismissing recent hotter inflation prints, he steered away from pushing back on how stimulative financial conditions are currently. He also openly spoke about how the committee (the FOMC) had discussed how Quantitative Tightening may be tapered in the near future, i.e., the Fed would let fewer Bonds/MBS roll off its balance sheet each month. This would be a net positive for liquidity, which is supportive of risk assets. So, the question is: why would Powell and the Fed seem as if their bias is to begin cutting interest rates soon when the labour market and the economy are holding up? Wouldn't cutting interest rates into this risk inflation rearing up again?
Well, yes.
But here's the catch…
The US has issued so much debt (raised money for its needs) that the USD value of the interest payments on that debt has almost gone parabolic since COVID-19. The issuance of this debt is known as fiscal spend, and this has kept liquidity net positive despite the Fed running off their balance sheet. The fiscal spend and the resulting very positive net liquidity are why risk assets have performed so well in the last two quarters.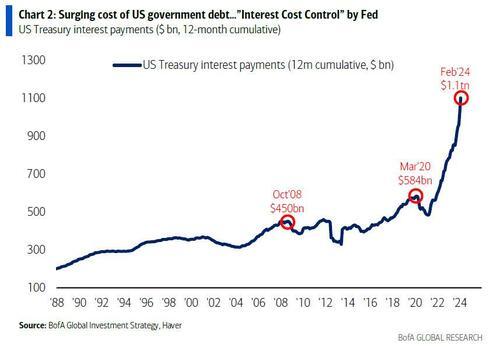
US Treasury Interest Payments:
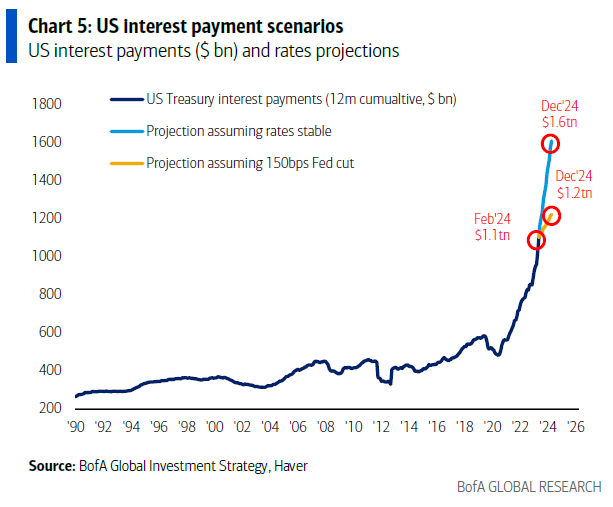
The above chart shows the US Treasuries Interest repayments up to February 2024.If the interest rate remains as it is (5.5%), then the interest repayments on the debt will increase to $1.6tn by the end of the current year.
However, if the Fed reduced interest rates by 150 basis points over the next 18 months, then the US Treasury's interest payments on their issued debt will only increase by $100b to $1.2tn.
Either way, it's not a good situation, and this is how the dominant global currency has ended up collapsing before, although that's an issue for another day.
But, essentially, the Fed will be pushed to reduce interest rates by the Treasury as the US will not be able to sustain paying the interest on its debt for long if the interest rate is 5.5%.
If it is under 4.0%, then this is more manageable. This has been labelled an "Interest Cost Control" policy.
US Interest Payment Scenarios:
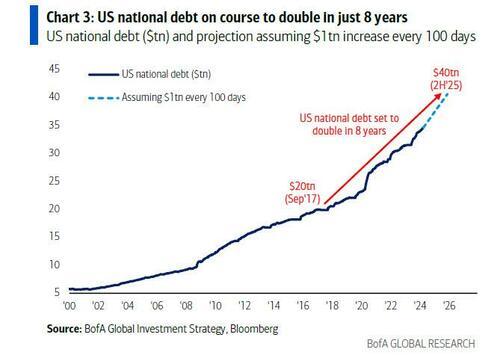
At the current rate, US national debt is expected to double from $20tn to $40tn from 2017 to 2025—that is, all US debt before 2017 will double in the following eight years…
Yep, up the finite assets = Bitcoin.
The US is absolutely on an unsustainable fiscal path. While the stimulus from this is positive for markets now, when the US eventually deals with it (assuming they do, rather than just straight-up defaulting), markets will likely come down substantially.
This may be what causes the next bear market in late 2025 or 2026 unless whoever is elected in the US Presidential Elections in November can somehow drag this out for more years.
US National Debt
We have now assessed monetary and fiscal policy to help lay out a general picture.
One more thing to consider is liquidity. As we know, Bitcoin and liquidity have a positive correlation. Increasing liquidity is a stimulative for Bitcoin to go higher.
One metric we're watching closely is the Global Liquidity Index from Michael Howell's Cross Border Capital.
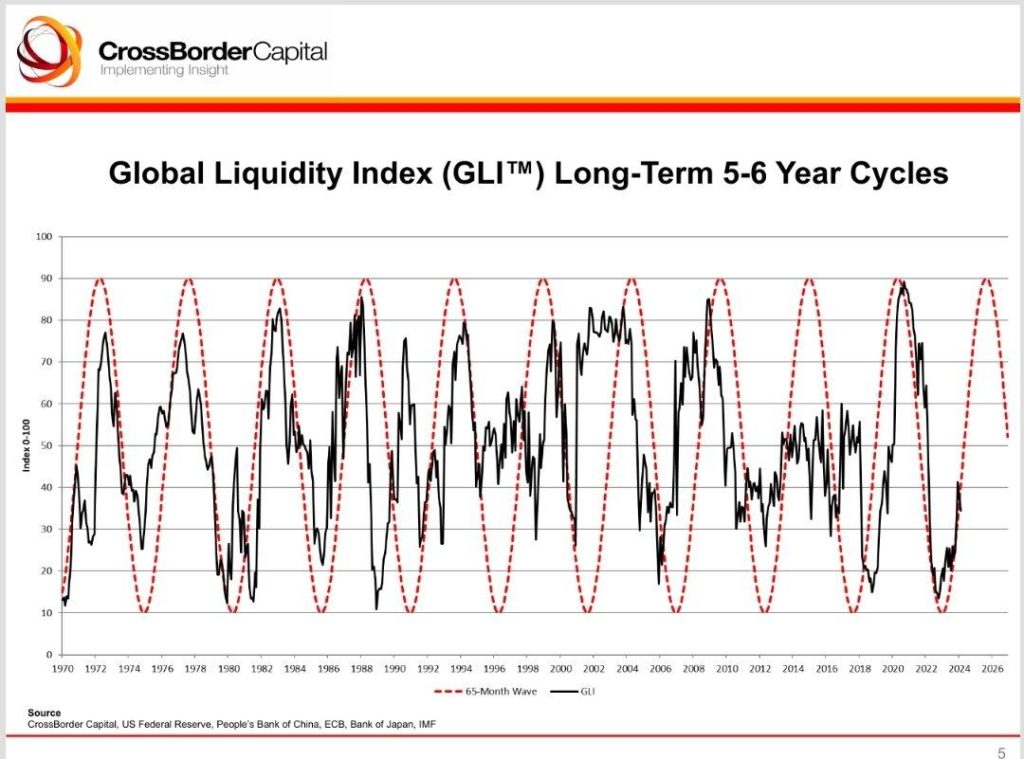
This metric shows that Global Liquidity is in an uptrend and may have considerably further to go, although we may see a slight pullback in the very near term. This is due to US market participants selling down assets in April to essentially pay their taxes. This will likely have a negative impact on liquidity (in the very short-term) as the Treasury General Account will approximately increase from $800b to $1tn.
It's Treasury Secretary Janet Yellen's job (somewhat) to get Biden re-elected in November, so she will likely draw down the TGA to increase liquidity again from May onwards. This will be supportive of risk assets and good for Biden going into a Presidential Election in November. This is the likely reason why we see liquidity continue to increase.
Alongside this, the Fed and Powell are expected to announce a tapering of QT in the early May FOMC meeting. Expectations are for the $95b a month Balance Sheet run-off that we're seeing currently to be reduced to $60b to $70b a month. This is net positive for liquidity, but not in the very short term, from May onwards.
Conclusion on macro analysis
Despite recent economic data suggesting that interest rate cuts should be pushed further out and the Fed should be "higher for longer," the Fed seems to have a bias toward cutting interest rates this year.Alongside this, it's likely the Fed will announce a QT tapering beginning in June in May, and Yellen will also likely stimulate markets with a drawdown of the Treasury General Account.
This setup/outcome would be very stimulative for risk assets, and liquidity would continue to be accommodative. This environment would be bullish for risk assets in H2 (the second half of 2024).
On-chain analysis
Since January 23, when Bitcoin was $38,650, it has run up 91% to its all-time high of $73,650 and up 77.30% on today's price of $68,400.Given this kind of run and in a relatively short time frame, although it is not uncommon for Bitcoin to perform like this in short timeframes, this has pushed some on-chain metrics into overheated levels, which would suggest a certain level of caution should be exercised.
On the other hand, some other metrics still suggest that a substantial portion of this current bull run is ahead of us. We're going to separate the metrics into two cohorts: those that are currently overheated and suggest caution should be exercised and those that still suggest there is more to go in terms of upside price action.
Metrics that show signs of an overheated market
- Value Days Destroyed.
- Percent Addresses in Profit.
- Long-Term Holder Supply.
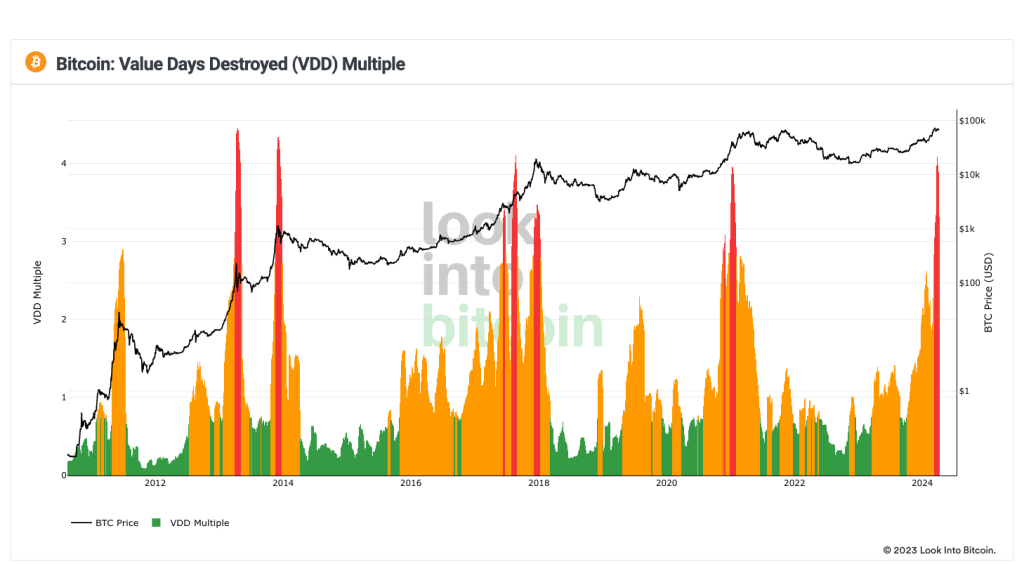
Value Days Eradicated
Value Days Destroyed multiplies Coins Days Destroyed (it assesses spending velocity, which gives an increased weighting the older a coin is) by the Bitcoin price, helping us more accurately identify when the Bitcoin price is becoming too overheated at each new cycle.The chart below shows that when these metrics spiked, older coins were being spent. These coins historically sell into new price highs, but that's usually 4-6 months before price all-time highs for that cycle. This is an early indicator of a potential cycle price top that shows up 4 to 6 months after the large red spikes.
When this metric spiked in the 2017 cycle, price topped out four months later, but this metric spiked at a price of $4,600, and the cycle high was $19,000.
In the 2021 cycle, this metric topped in early January 2021 at $33,700, and by on-chain activity, the cycle top was in late April 2021 at $65,000, so again, four months.
But price did double in those four months. This metric spiked in late March at $70,000 in this cycle. Even though this metric suggests there's only another 3-4 months more of price upside, it also suggests that price could comfortably double in that time.
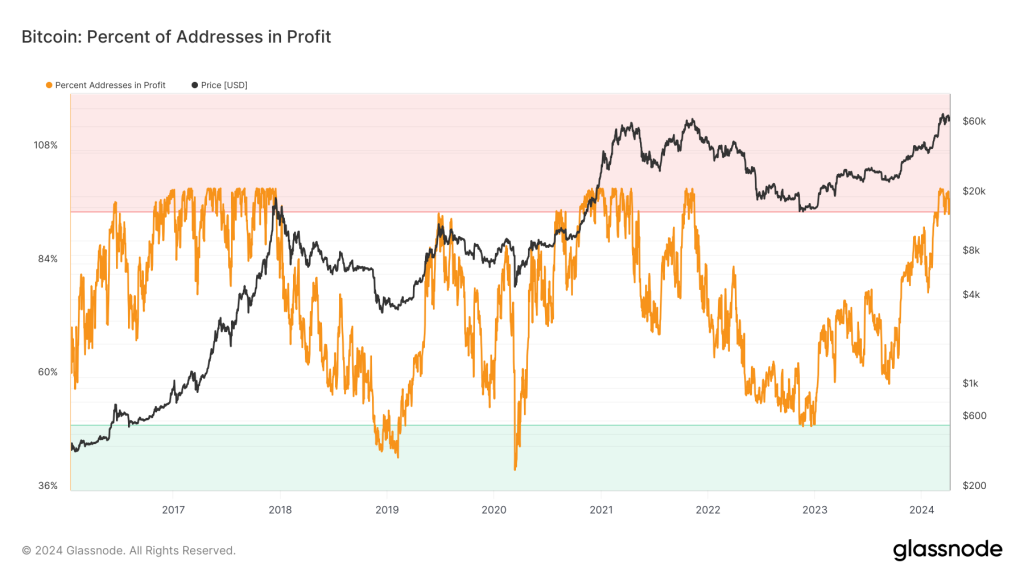
Percent Addresses in Profit
Percent Addresses in Profit identifies what percentage of addresses are currently in profit, i.e., is their average buy price less than the current price of Bitcoin?When this metric spikes into the red zone, that means that more than 95% of addresses are in profit. In the 2017 cycle, this metric spiked in early January 2017, when Bitcoin was trading at $1,120, and it finally peaked 11 months later when Bitcoin was priced at $19,000. There were substantial pullbacks along the way, but this metric essentially stayed in the overheated zone for 11.5 months, and price did a 17x in that time.
In the 2021 cycle, this metric got well into the red zone in early November 2020 at a Bitcoin price of $15,600. On-chain activity/price topped in mid-April 2021 at $63,000, so this metric remained overbought (in the red zone) for 5.5 months.
In this current cycle (2024), this metric has spiked into the red zone in the first few days of March at a Bitcoin price of $62,000. This suggests there may be another 2-4 months of positive price action from here, with prices growing from current levels. The above doesn't suggest the price top is in, but it does suggest that it might come in the next few months, although price could be substantially higher by then.
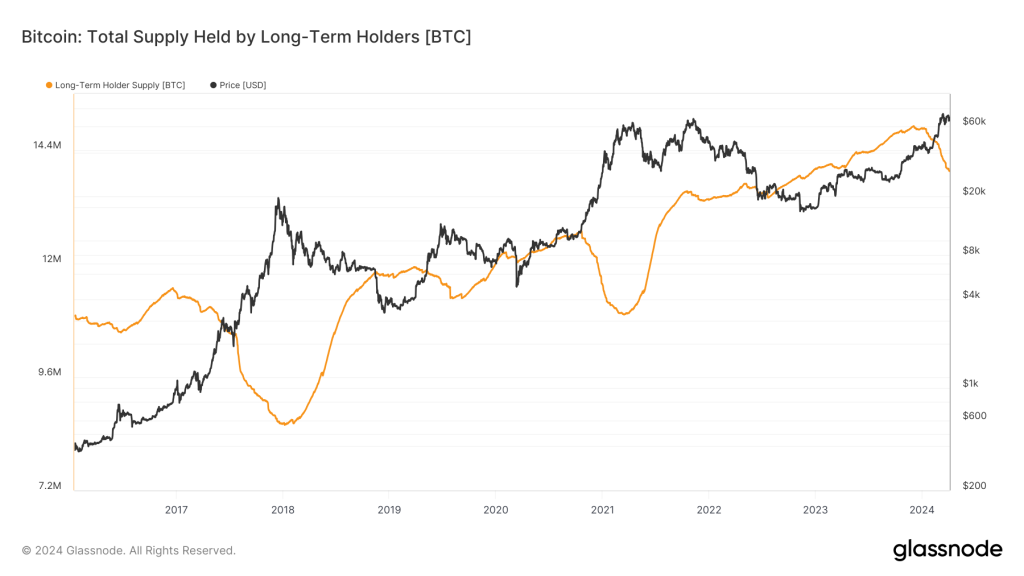
Long-Term Holder Supply
Long-Term Holder Supply is defined as coins older than 155 days (haven't moved in that time).In prior cycles, the Long-Term Holder Supply has increased in bear markets and decreased (when they have sold into) in bull markets into price highs.
We can now see from this metric that it has decreased recently, beginning at $42,000. In the 2021 cycle, the Long-Term Holder Supply begin decreasing at a Bitcoin price of $13,800, and price did nearly do a 5x from there. However, the decrease in this metric lasted five months in the 2021 cycle, and in this cycle, it has been decreasing for three months.
Again, this is just something to watch here as we continue to flesh out the on-chain picture.
The above three metrics suggest we have now moved into the final part of the cycle, where price enters into price discovery during a period of market euphoria. In this period, we would expect Bitcoin to produce at least 60%-100% gains from here, with altcoins outperforming more substantially.
This is, of course, good; however, the above also suggests that there may only be 3-5 months remaining of the bull market, potentially even slightly less. But even though these metrics suggest this, this would be unusual when we compare this cycle to prior cycles.
The reason is that in prior cycles, Bitcoin's price usually goes parabolic a good six months, post-Bitcoin-halving, and currently, the halving is still a few weeks out. The halving would say that there could be another 9-12 months of bull market euphoria left.
Alongside this, we now also have the introduction of the Bitcoin ETF products, which have already brought substantial demand to the market, smashing many analysts' expectations for it. We would expect this trend to continue, but we will dive into this further in this report.
We will now move on to Cohort 2 and the metrics that suggest we're just at a midway point in this bull cycle.
Metrics that suggest that we’re at a mid-point in the bull cycle
- MVRV Z-Score + MVRV Gradient Oscillator.
- The Golden Ratio Multiplier.
- Pi Cycle Top Indicator.
- Percent Addresses in Loss.
- LTH – NUPL.
- Realised Price.
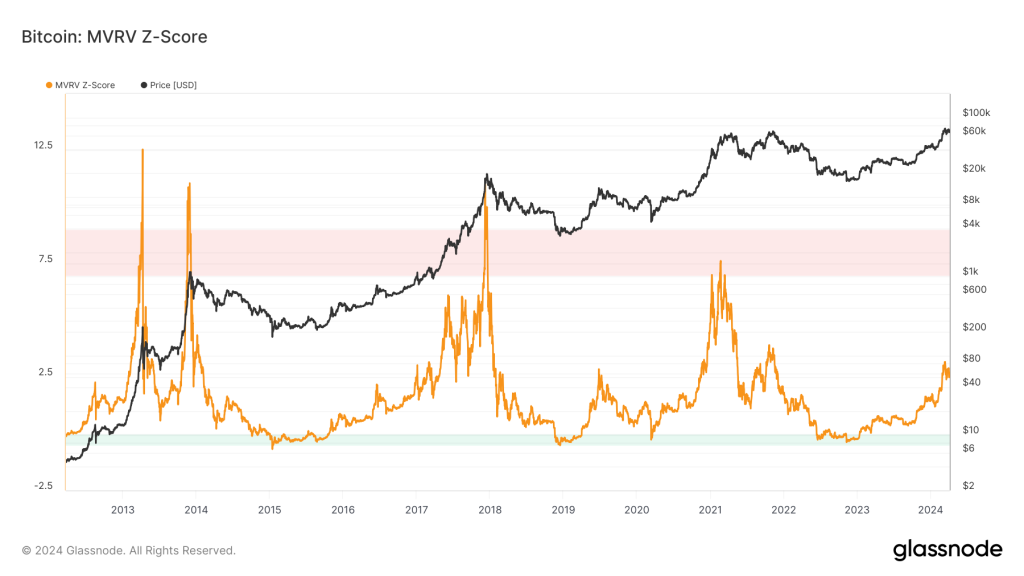
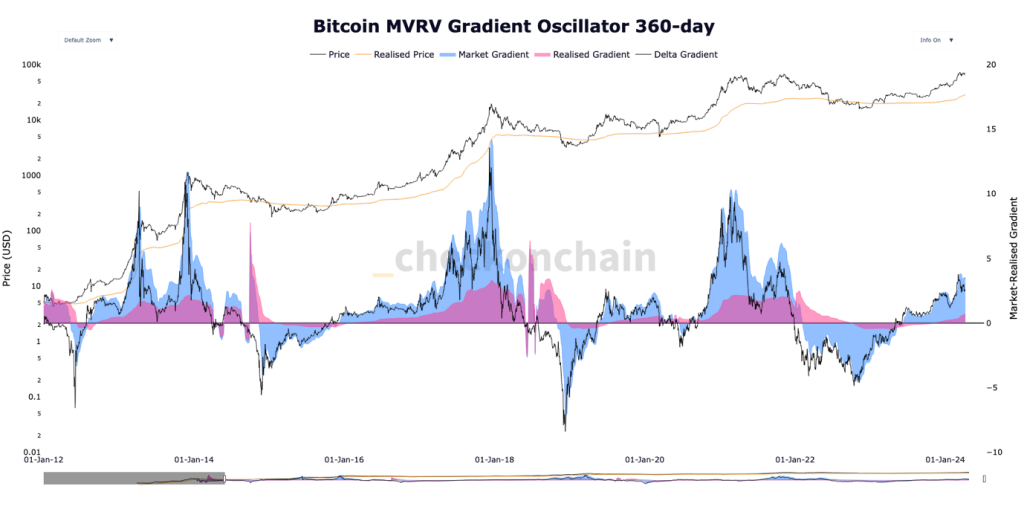
MVRV Z-Score
The MVRV Z-Score evaluates whether Bitcoin is overvalued or undervalued relative to its "fair value".Its "fair value" has previously been estimated based on Bitcoin's cost of production, which assumes that Bitcoin is at least worth what it efficiently costs to produce, i.e., the cost of electricity, hardware, etc.
When this metric is in the 'green zone,' historically, this has been a good time to buy Bitcoin and hold the position for 12-24 months. When the MVRV Z-Score spikes past a value of 6, it is a good time to sell Bitcoin because it is overvalued at that point.
Below, we can see that the MVRV Z-Score is currently in the middle territory. When this metric has been in this middle territory in prior cycles, it has often gone parabolic in the following six months as Bitcoin's price moves drastically higher.
If we then look at the MVRV Gradient Oscillator, this metric uses a gradient to show the velocity of the move up (in Bitcoin's price). In prior cycles, we've seen the Market Gradient (purple shaded area) signal Bitcoin price tops when this has spiked up dramatically.
Alongside this, in prior cycles, when Bitcoin's price tops, the Realised Gradient (pink shaded area) moves considerably higher but in a less dramatic fashion. We can see below that both have begun moving higher but moving higher in a gradual uptrend rather than a parabolic move higher. This metric suggests there could be another 6-12 months of significant upside for Bitcoin's price.
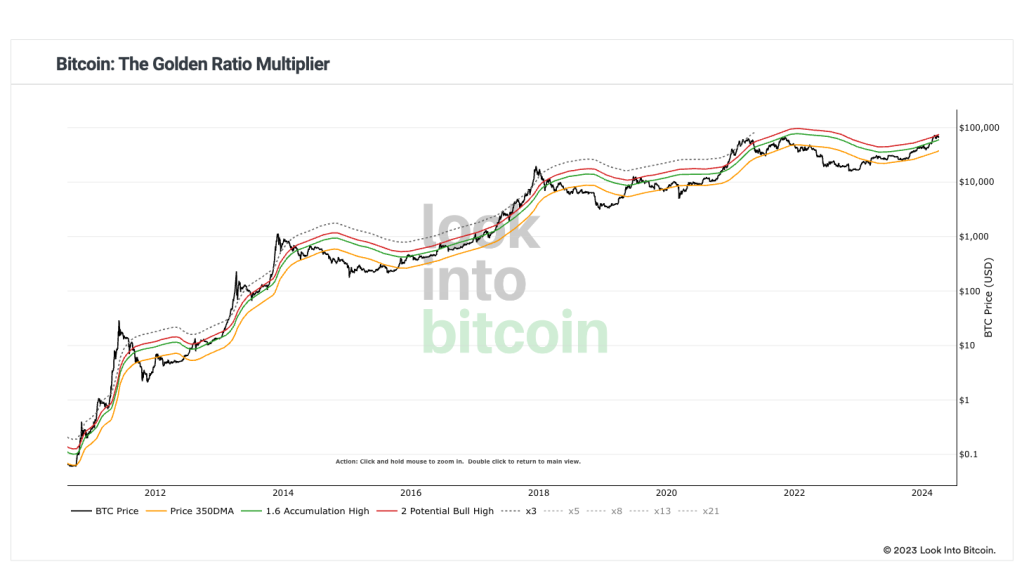
The Golden Ratio Multiplier
The Golden Ratio Multiplier explores Bitcoin's adoption curve and market cycles to understand how high price may go in bull markets.With each cycle, it's expected that Bitcoin will see diminishing returns, with this cycle's high potentially being a 3x on the 350DMA. The current DMA is $37,600, meaning that this metric suggests that Bitcoin's price may top out somewhere around the $111k mark. Note: Given the likely left-sided cycle and the introduction of an ETF, its possible price will be substantially higher than $111k.
When Bitcoin breaks above the red line, which is the 2x Potential Bull High line, its price goes parabolic in the following months. Bitcoin's price is currently just below this level; a clean breakout would be a break above $75k.
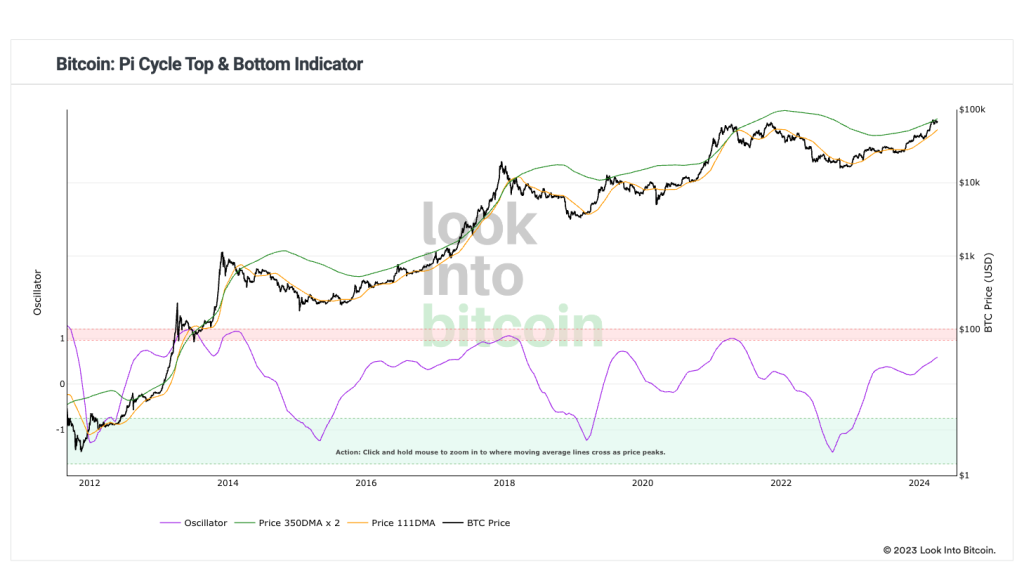
Pi Cycle Top Indicator
The Pi Cycle Top compares the 111DMA (yellow line) and 2*350DMA (green line).Bitcoin's price has gone parabolic when it has broken above the 2*350DMA (green line). We can see that in 2017 and 2020, when Bitcoin's price got above the 2*350DMA (green line), it grew 14x in 2017 and 3x in 2020, approximately six months after the price crossed this line.
As we can see in the chart below, price is currently just below this level. Assuming price will break out above the 2*350DMA (currently at $75,200), we should expect price to move up violently.
Let's also look at the oscillator (purple line) despite it looking relatively high. It's currently at a value of 0.59, which is still indicative of mid-bull cycles rather than towards the end of bull cycles.
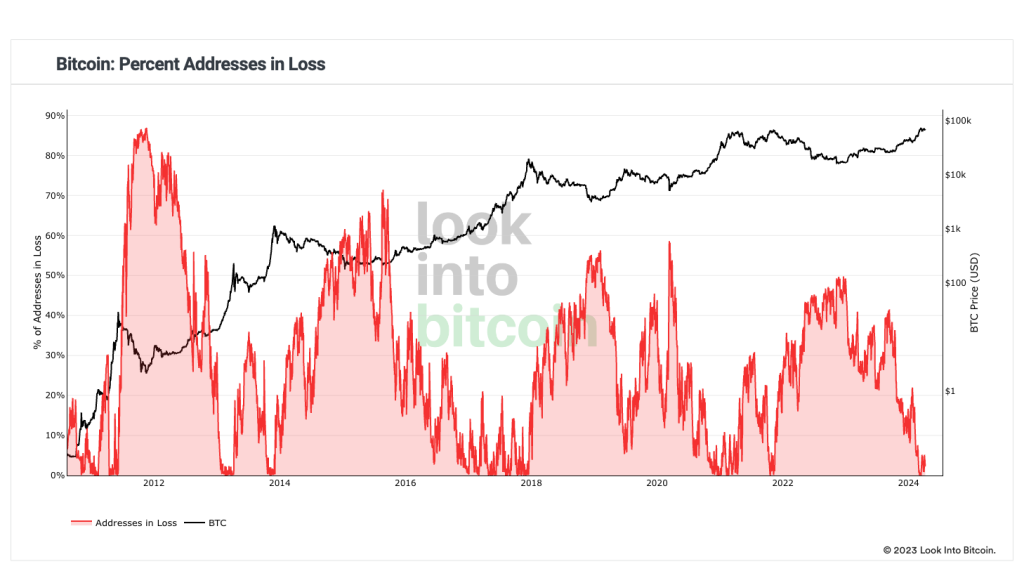
Percent Addresses in Loss
The Percent Addresses in Loss shows the percent of addresses where the average purchase price of Bitcoin is above the current Bitcoin price.In mid- and late-stage Bitcoin bull markets, this metric drops to a very low value, particularly as Bitcoin hits new price all-time highs. In the 2017 cycle, the period when this metric showed an extremely low percent of addresses being in an unrealised loss lasted approximately 12 months.
During the 2021 cycle, this period lasted 5.5 months.
In the new 2024 cycle, this period began in early March. It's hard to know how long this period will last for in this current cycle, and we should expect the percent of addresses in an unrealised loss to also spike off of the 0% value throughout the bull market as Bitcoin has some corrections.
Most importantly, this metric is used to confirm when the bull market is over. This would be when you see a more prolonged period where this metric is no longer settling at the 0% mark. For now, though, it doesn't look like we're anywhere near that, and it's likely we'll see Bitcoin generally make new highs over the coming six months.
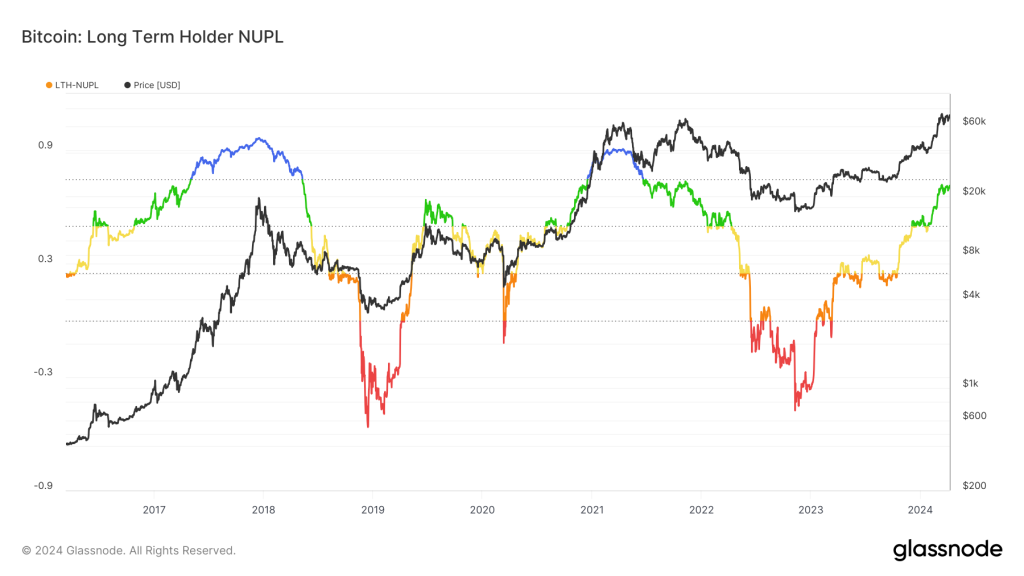
Long-Term Holder NUPL (Net Unrealised Profit/Loss)
This is the Net Unrealised Profit/Loss of all UTXOs (consider this as Bitcoin) that are older (haven't moved in) in the last 155 days.When this metric turns from green to blue, going above the value of 0.75, this has been the euphoric period when price goes parabolic in prior cycles.
In the 2017 cycle, this (the blue 'Euphoria' period) lasted for seven months before it stopped putting in new highs.
In 2021, this lasted for four months, so potentially, in the current/new cycle, this only lasts 3-4 months. We'll have to continue to assess, but for now, this metric isn't even in the blue 'Euphoria' zone, so there are likely a good six months left here, assuming the price continues to trend higher.
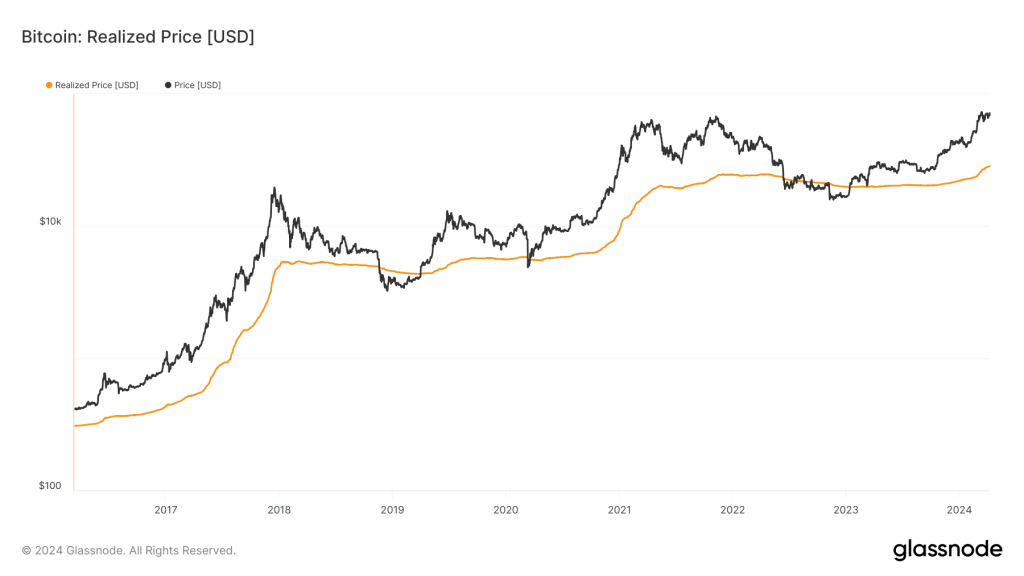
Realised Price
The Realised Price is the average cost of all coins.In bear and mid-markets, this metric remains relatively flat, as seen in the chart below.
However, when Bitcoin is in a bull market, and new market participants flood in and buy Bitcoin, the Realised Price ramps up. As the price goes higher, of course, the average cost basis also increases.
The chart below shows that the Realised Price has been flat for approximately 2.5 years and has begun to ramp up recently, but only slightly.
In the 2021 cycle, the Realised Price ramp-up lasted for nine months.
In this current cycle, Realised Price began to ramp up in the first few days of March, so it has been just one month so far. This suggests that this metric still has 3-6 months before topping out, meaning price can likely ramp higher from here for the upcoming couple of quarters.
Youtube Views
We're now going to cover one last on-chain metric, which is rather unique. This is YouTube views.In prior bull markets, YouTube views (for crypto content) have ramped up as Bitcoin's price has ramped up to highs.
I (Tom) also remember when I first got into crypto, I went to YouTube for knowledge. Yes, that's questionable, I know. But the theory applies: When newbies come into the market, YouTube is a key place where they get their tips/knowledge.
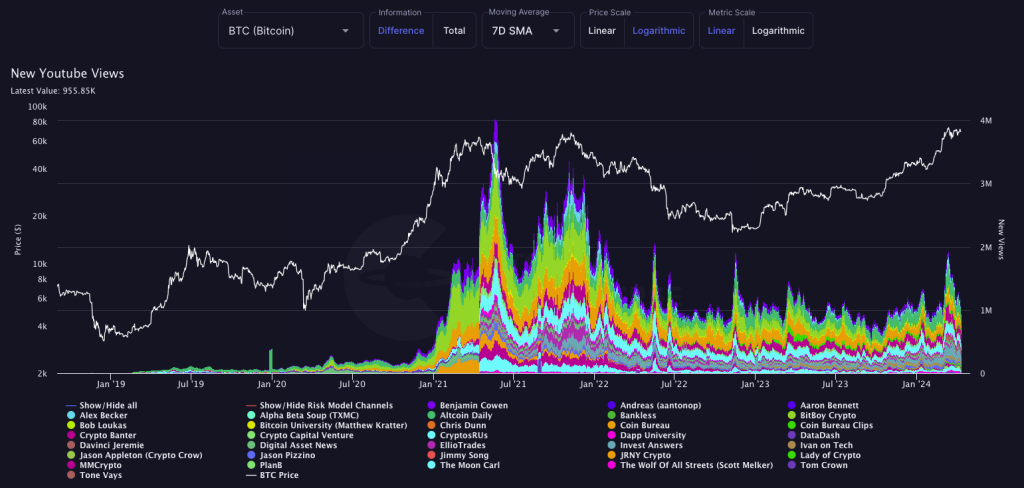
In the chart above, we look at the largest crypto Youtubers and how their views on their videos change based on where we are in the cycle. We can see in the chart below that YouTube views for the major channels ramped up slightly last month but have now come down. However, this ramp-up is nothing close to the highs we saw in 2021.
Therefore, we feel we will likely see this metric ramp up more aggressively over the coming months. We believe this will likely be a top signal for Bitcoin's price when it comes.
Conclusion on on-chain analysis
Many of the above metrics suggest that Bitcoin is beginning to enter the phase where price increases more parabolically - the 'euphoria' phase.In prior cycles, this 'euphoria' phase tends to last roughly six months and cause substantial upside in prices. Many of the above metrics suggest that this phase has just begun, which means we may see another 4-6 months of more upside. It is also possible that we're just before the 'euphoria' phase currently, and therefore, a slightly more negative macro and liquidity environment could see prices and, thus, the above metrics pull back slightly over the coming 3-8 weeks.
In my (Tom) opinion, this would actually prolong the bull market and, therefore, be the best setup for prices to reach even greater heights in late 2024 or early 2025. This assumes that this current cycle is a more left-sided cycle, i.e., it peaks 12 months post-Bitcoin halving rather than 18 months post-halving, which has been the case in prior cycles.
The above scenario would be my preferred scenario for Bitcoin and this bull cycle. It would likely extend these on-chain metrics to potentially top out in 6-9 months instead of 4-6 months.
Technical analysis
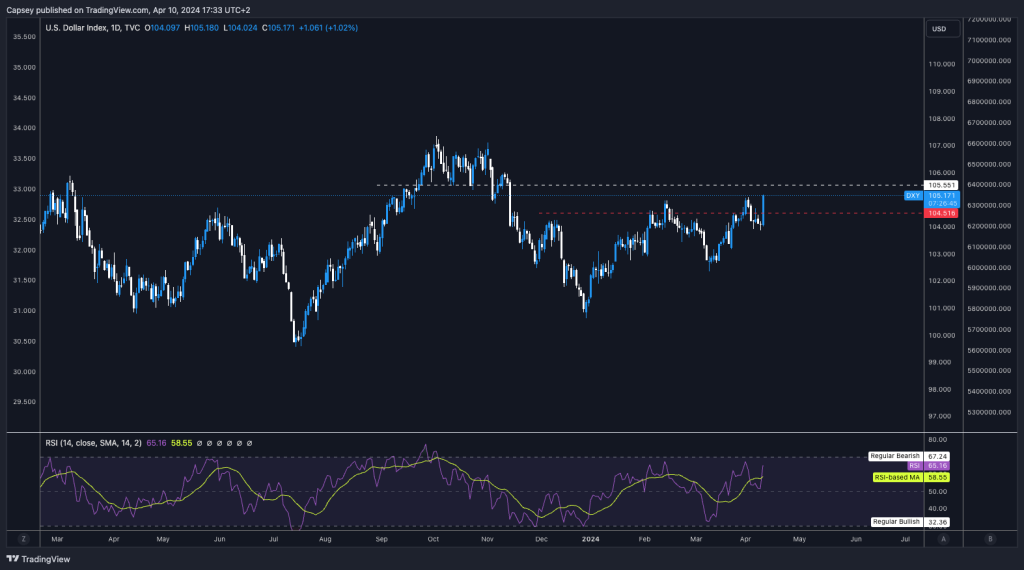
The first set of charts we focus on are macro charts, although we keep this analysis' short and sweet'. The DXY (Dollar Index) and Bond Yields increased on April 10 due to the slightly hotter inflation DOT print and the market pricing in a "higher for longer" Fed where rate cuts come later in the year, and maybe less of them.Now, there will be 1-2 rate cuts at most, rather than the three that were originally priced in.
DXY 1D Chart
US 2Y 1D Chart
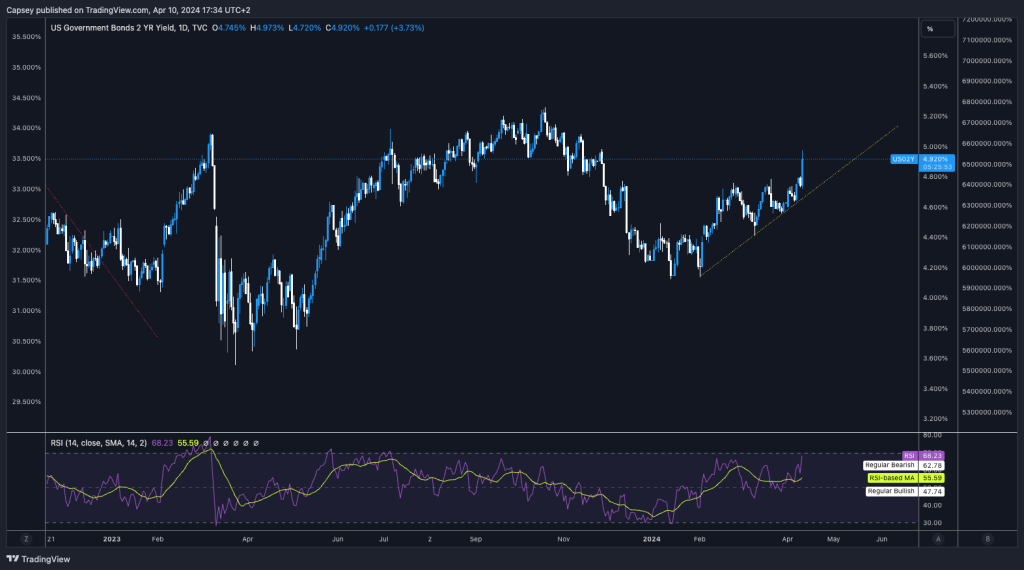
Both of these charts may see further upside in the next few weeks as the market continues repricing. This will likely lead to risk assets and crypto moving lower or at least remaining range-bound for a few weeks. BTC 1D Chart
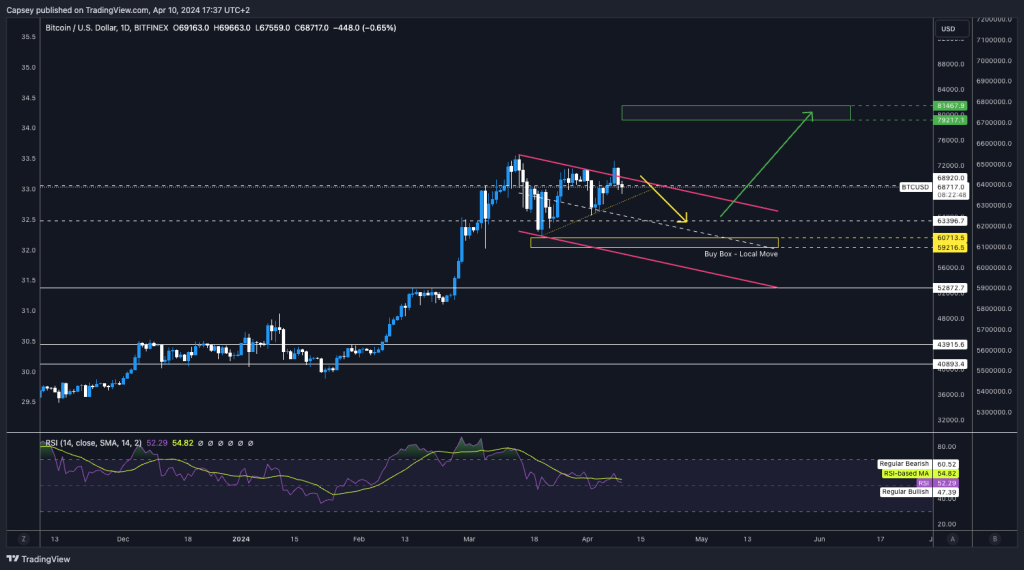
From a technical analysis perspective, Bitcoin was either in a pennant or a bull flag pattern.
It was my (Tom's) personal feeling that it was and is a bull flag. We have had price break above the top border of the bull flag, but it has rejected, and price is now back in the flag – a potential deviation.If we consider all the above macro and on-chain data, we could expect Bitcoin's price to remain range-bound between $70k and $63k (possibly even $59k, but less likely) throughout April and maybe even some of May.
However, this would set up a very bullish bull flag pattern that could break out in late May/early June. This would also align with the Fed QT taper, a further increase in liquidity from Yellen, and the drawdown of the TGA.
More price consolidation over the coming 3-8 weeks would also go a long way to pull back some of the slightly overbought indicators and on-chain metrics. A clean break above the bull flag would likely see Bitcoin surge to the green box between $79,200 and $81,500 relatively swiftly.
We would then expect price to continue higher in Q3 and Q4 when we expect Bitcoin to reach levels well above $100k.
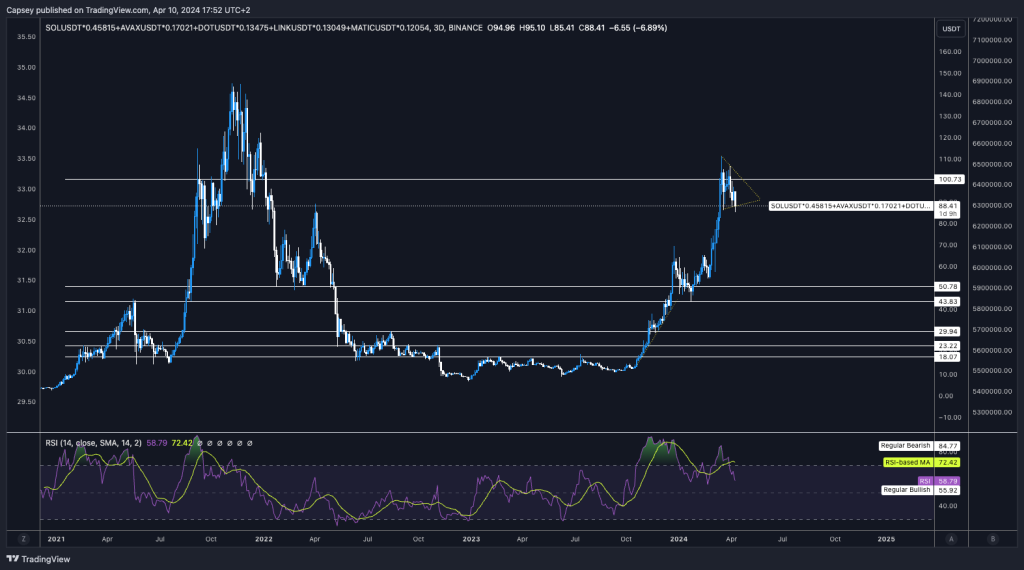
As many of you know, we have built custom indexes for large caps. This helps us identify whether the sector looks bullish or bearish from a TA perspective and also from a more zoomed-out view.
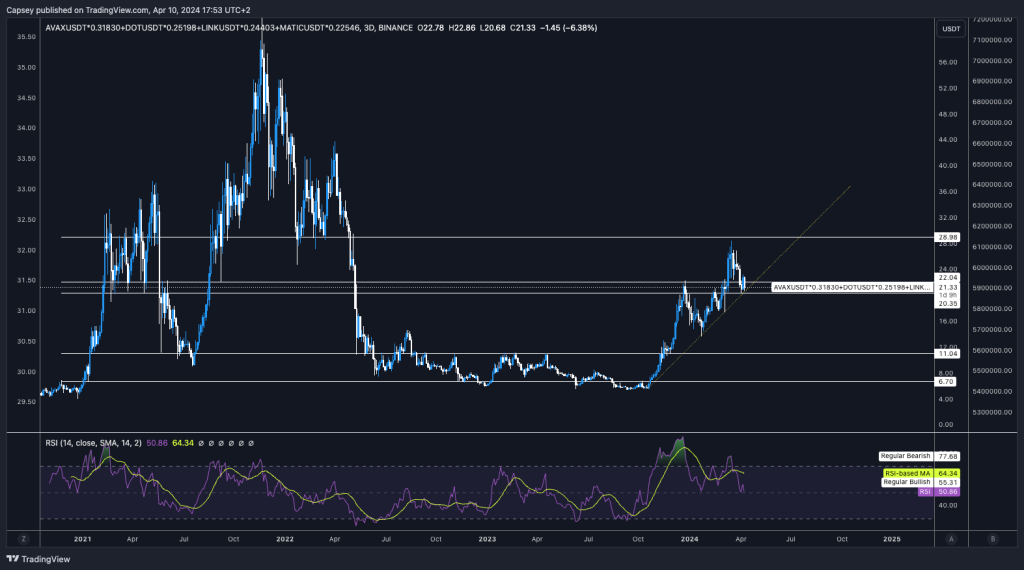
If we look at the large caps index, with and without Solana, we can see that they are both in bullish formations. Both are experiencing pullbacks currently, but upon breakouts, we expect the Major Caps to increase in price substantially in the following months.
Big Caps Index with SOL
Big Caps Index without SOL
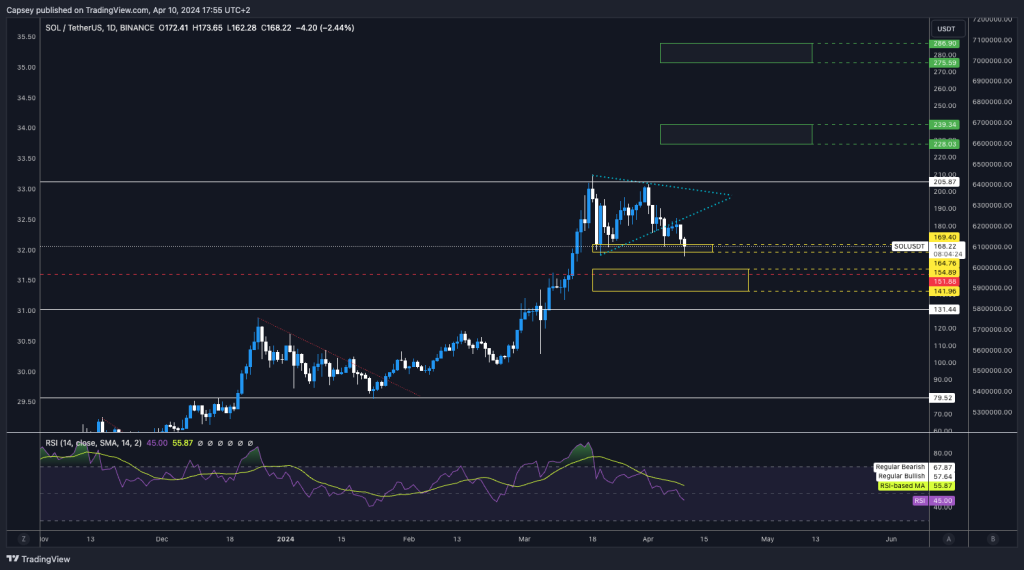
One of the core plays we are focusing on is Solana.
Price has broken down from the pennant, having rejected at the horizontal resistance of $205. We would look to add to our SOL positions sub $160, with more aggressive Buy Orders coming in between $141 and $154. However, we're not phenomenally confident we actually see the majority of this Buy Box fill.
SOL 1D Chart
Cryptonary's take
Strong recent economic data likely pushes the Fed to begin cutting interest rates in July or September, with possibly only 1 (at most 2) interest rate cuts in 2024. The worst-case scenario would be the first rate cut coming in December, yes, post-presidential Election.This has changed the risk environment to less risk-on in the past few weeks, and this may continue for another 3-8 weeks.
However, this is almost a welcome surprise as it may help crypto remain in a consolidation range (prices-wise). As a result, it will reset many of the overbought on-chain metrics and trading indicators, which should help prolong the bull cycle that was seeming to become too frothy too quickly. This would also extend the peaking of the on-chain metrics, meaning they would likely produce price tops towards the end of 2024.
From June onwards, a potential tapering of QT and increasing liquidity from Yellen and the TGA would provide an accommodative environment for risk assets. This will also be a month after the Bitcoin halving, which has always been a bullish catalyst for Bitcoin's price.
This would potentially set up a very good second half of 2024 for crypto, with a possible market top coming at the very end of the year or even early 2025.
However, one thing we haven't mentioned that we should also continue paying attention to is the demand for ETFs. It's hard to know what effect the ETFs will have, although we expect they'll continue to bring demand to Bitcoin, which should only aid Bitcoin's price going higher.Ultimately, we may be in for a choppy next month or so, but we expect crypto to perform very well in the second half of 2024. We continue to hold Spot positions with a focus on the majors and the SOL ecosystem, with a look to sell towards the end of 2024, maybe early 2025.
Until the next one,
Cryptonary, Out!
Recommended from Cryptonary


