Save 23% ($351) & Get a Free 1-1 Call with our Team ⏰ : 0d 2h 59m 44s
Disclaimer: This is not financial or investment advice. You are responsible for any capital-related decisions you make, and only you are accountable for the results.
Bitcoin (BTC)
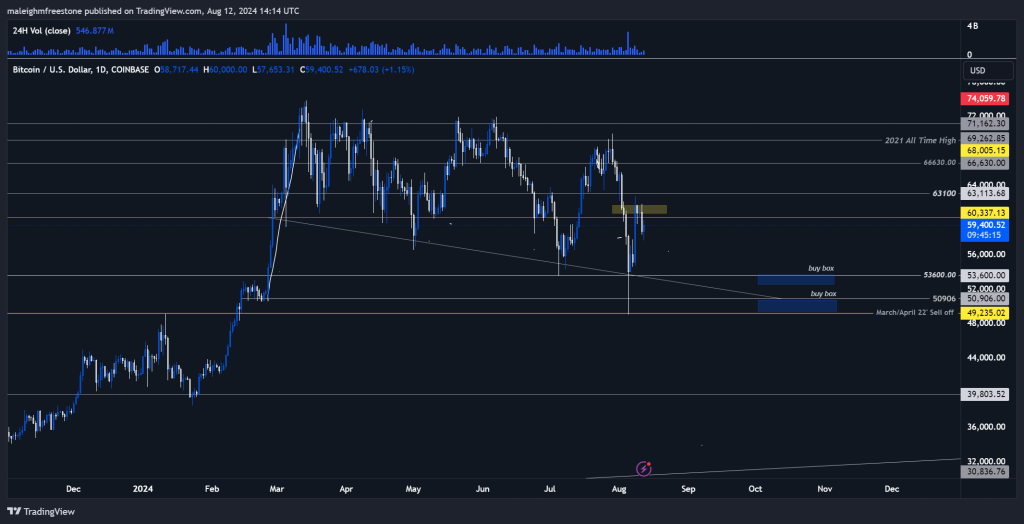
Our analysis of Bitcoin began with a focus on the weekly chart to understand its broader market context. Over the past 150 days, Bitcoin has been consolidating within a range between $57,000 and $72,000, indicating a lack of momentum to break out decisively in either direction. The recent pullback from $60,000 represents a 17% decline, which is relatively minor within this broader context. We noted that the market's inability to push higher could be due to profit-taking and indecision among traders, especially after a significant pre-cycle expansion.We identified key support levels at $53,600 and $50,906 as potential areas where buying interest might re-emerge. These levels could provide strong buy zones if Bitcoin continues to dip lower or consolidate further. While the short-term outlook appears cautious, we believe that these periods of consolidation are necessary for the market to build the strength needed for a more decisive upward move. Traders should watch for a sustained break above the $60,000 level, which would signal a more bullish continuation.
Solana (SOL)
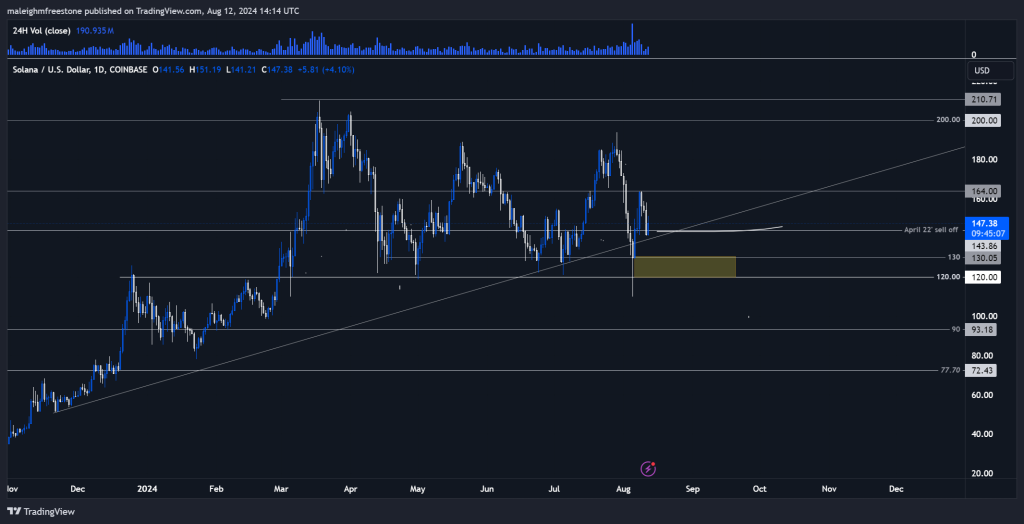
Our examination of Solana showed that the asset had experienced a notable sell-off, leading us to close our spot trade at $143. Despite this, Solana's long-term potential remains intact, but we expect some short-term downside or consolidation before any significant upward movement. The asset has been trading within a range, and we believe it could revisit the $120 to $130 area before making another move higher.Solana continues to show strong bullish characteristics on the weekly chart, but it may require more time to stabilise after recent market volatility. Patience will be crucial for traders looking to accumulate Solana, as the market could offer better entry points in the near future. Our analysis suggests that a double-bottom formation or further consolidation within the current range could present favourable buying opportunities.
Ethereum (ETH)
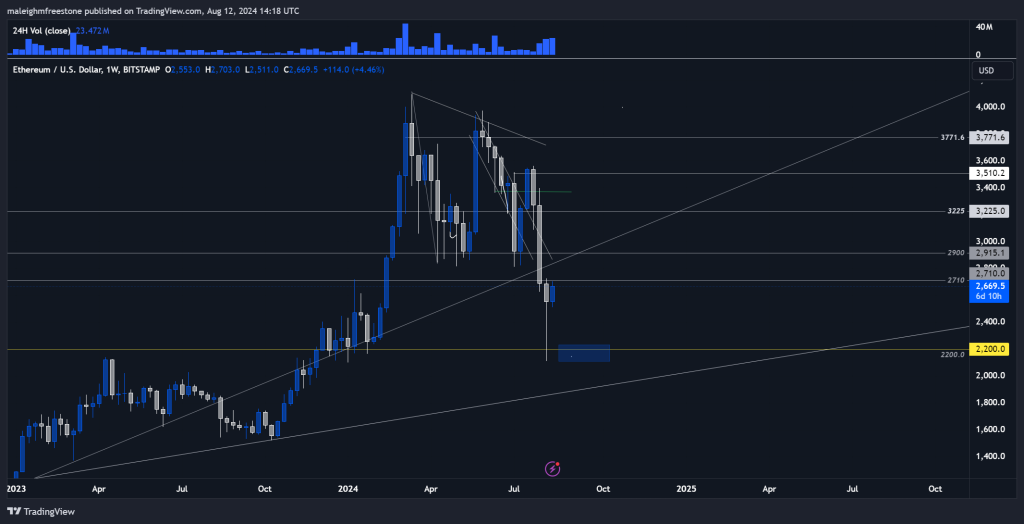
Ethereum presents a slightly different scenario compared to Bitcoin and Solana. The asset has maintained a solid bullish structure, characterised by a series of higher highs and higher lows. This pattern suggests that Ethereum is poised for a significant move, potentially setting up for a new high in the coming months. We are particularly interested in the potential formation of a double bottom, which could serve as a strong entry point for a long-term swing trade.Ethereum has shown resilience in the monthly time frame, holding above key support levels despite market-wide volatility. The asset's ability to sustain these levels reinforces our bullish outlook. We are closely monitoring Ethereum's price action, especially in the context of broader market conditions, as we believe it could offer substantial opportunities for traders in the near future.
Thorchain (RUNE)
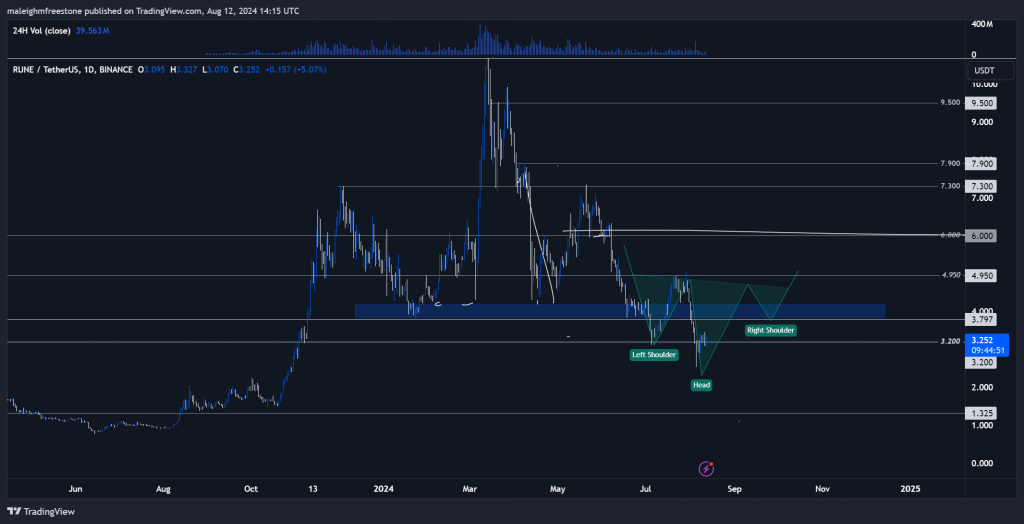
For Rune, we discussed the impact of recent shifts in market sentiment, which have driven the price down from its peak at $6 to around $3. Despite this decline, Rune's chart suggests it might be approaching a bottom, particularly given the broader market's behaviour. We are looking for a potential head and shoulders pattern to form, which could indicate a reversal in the current downtrend.Our target buy zones for RUNE are around $3.20 to $3.40, where we believe there could be a strong accumulation opportunity. The formation of a reversal pattern and a broader market recovery could position RUNE for a significant upward move. As always, we advise caution and patience, allowing the market to confirm these patterns before taking action.
Dogecoin (DOGE)
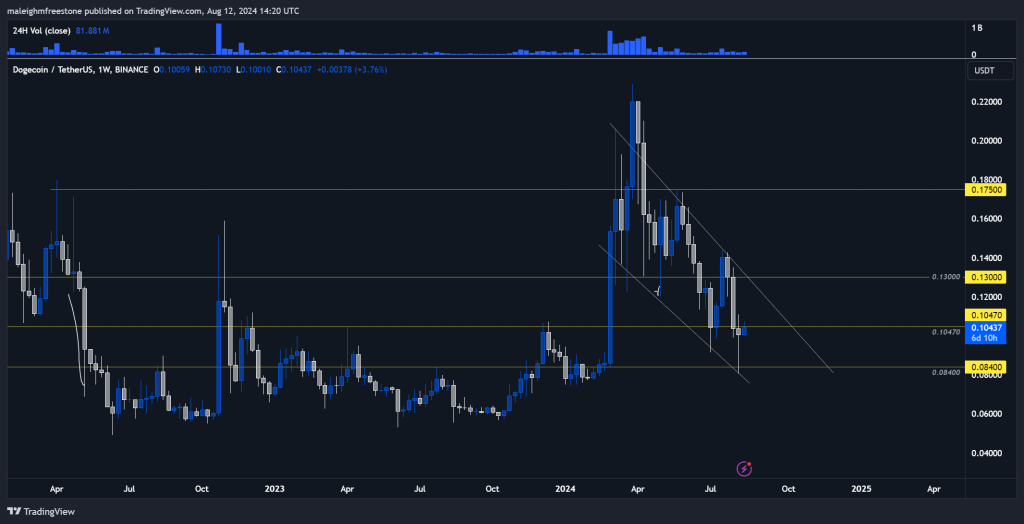
Dogecoin has been trending downward, forming a well-defined descending channel. However, the correction has been orderly, indicating that the market might be setting up for a potential reversal. We identified key levels at $0.084 and $0.13 as critical areas to watch. A break above $0.13 could signal the beginning of a bullish reversal, while a dip to $0.084 might present a more attractive entry point for accumulation.We believe that Dogecoin's long-term potential remains positive, especially if it can hold above these key levels and break out of its current downtrend. Before entering new positions, traders should watch for signs of a reversal, such as a breakout above resistance or a strong bullish candlestick pattern.
Pepe (PEPE)
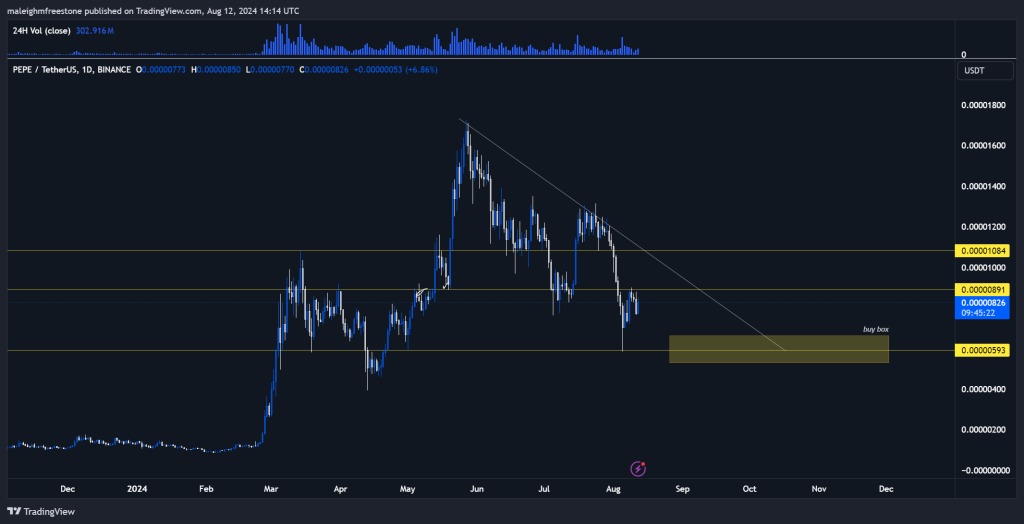
Pepe (PEPE) is currently in a consolidation phase after a significant decline, with the price stabilising in a critical support zone between $0.00000593 and $0.00000891. This range is particularly important as it aligns with previous demand areas where buyers have historically shown interest. The recent price action suggests that Pepe might be gearing up for a potential reversal, making this an area of interest for long-term investors.Our analysis indicates that if Pepe can hold above this support zone and begin to show signs of strength, such as forming higher lows or seeing an increase in buying volume, it could signal the beginning of a nice move, which correlates nicely with ETH and that projection.
DogWifHat (WIF)
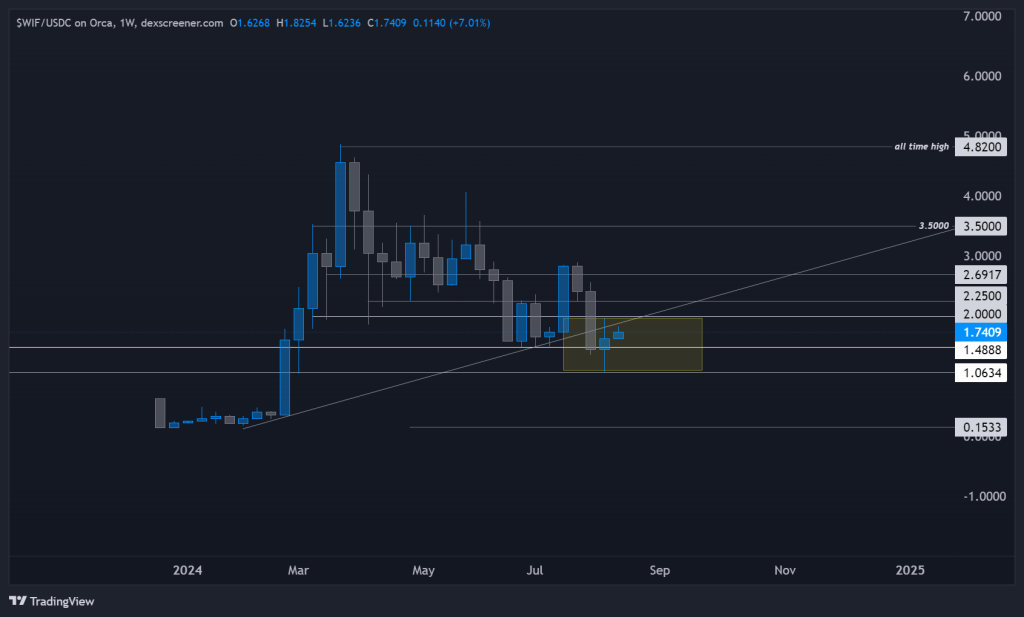
WIF is currently forming a promising candlestick pattern on the weekly chart, suggesting it may be nearing the bottom of its current range. We recommend looking to accumulate WIF between $1 and $2, as this range aligns with a key Fibonacci retracement level (61.8%), which often serves as a strong reversal point.This retracement level correlates with previous areas of demand, reinforcing our view that WIF could soon see a reversal to the upside. If the market stabilises and WIF reclaims key support levels, it could present a solid buying opportunity for those looking to capitalise on the next leg up.
Popcat (POPCAT)
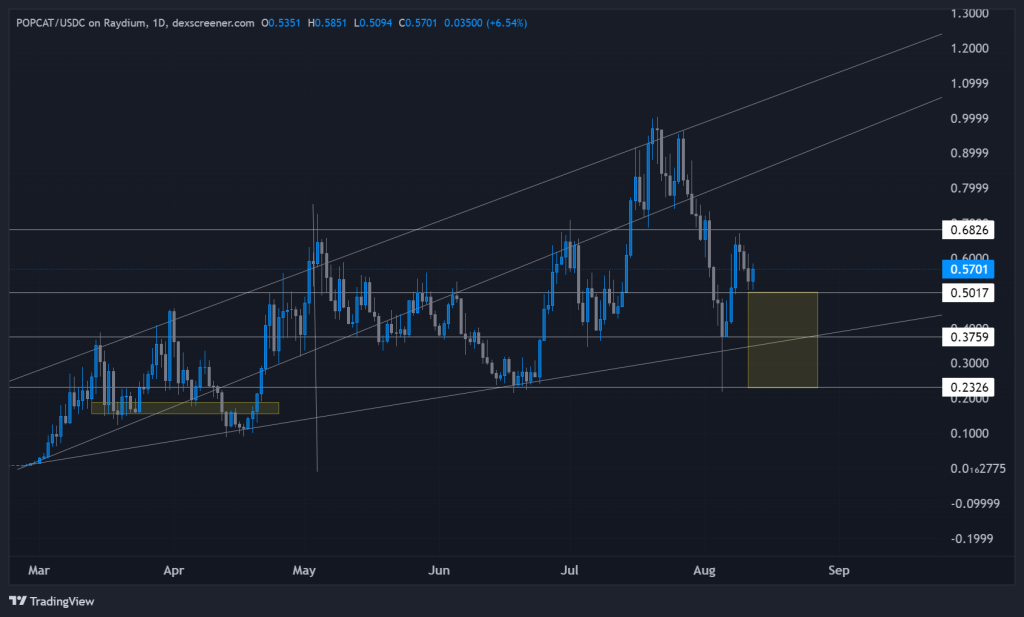
Popcat has been displaying a strong bullish trend, with expanding trend lines indicating increasing momentum. We identified a potential buying opportunity between $0.2 and $0.5, especially if the market experiences further downside. However, Popcat's long-term chart suggests significant upside potential, making it an attractive asset to accumulate during dips.We noted that Popcat's trend lines have been reliable indicators of future price movements, and reclaiming key levels could signal the beginning of a new upward phase. Traders should watch for a breakout or a retest of these trend lines as potential entry points for accumulating Popcat.
Cryptonary's take
Our analysis across all these assets indicates that the market is largely in a consolidation phase, with the potential for further downside before a more decisive upward move. While this may create short-term uncertainty, we believe these periods offer critical opportunities to position ourselves for the next major leg up.Each asset has unique characteristics and key levels to monitor, but the common theme is patience and careful observation.
By staying informed and ready to act when the market confirms its direction, our community can capitalise on the opportunities that lie ahead.
Recommended from Cryptonary


