Save 23% ($351) & Get a Free 1-1 Call with our Team ⏰ : 0d 2h 59m 43s

Why you should read this report
- BTC: A weekend surge and reclaimed key level - but what's next? Our analysis reveals the crucial support and resistance zones to watch.
- ETH: An intriguing pattern is forming. Discover why the current leverage setup could be a positive sign for Ethereum's future moves.
- SOL: A 15% jump and a bullish pattern in the making. Find out the key price levels that could trigger Solana's next major move.
- WIF: Breaking out and forming a flag - but is it bullish? Learn which price points could confirm a potential reversal.
- POPCAT: From breakout to retest - what's driving this explosive move, and where might it be headed?
Disclaimer: This is not financial or investment advice. You are responsible for any capital-related decisions you make, and only you are accountable for the results.
BTC
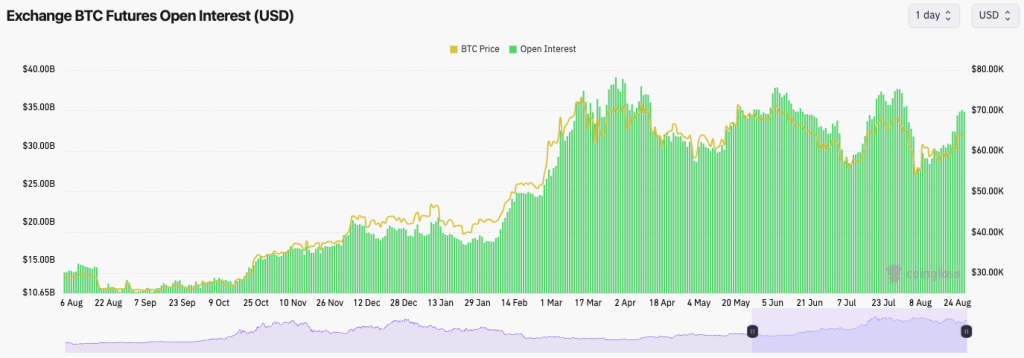
BTC's Open Interest increased substantially over the weekend to $34.7b, a substantial increase from the $26.6b lows just three weeks ago.BTC's Funding Rate remains relatively low, between 0.00% and 0.01%, indicating a bias to be Long, but it's not a substantial bias.
Traders are relatively balanced here between Longs and Shorts.
BTC Open Interest:
Technical analysis
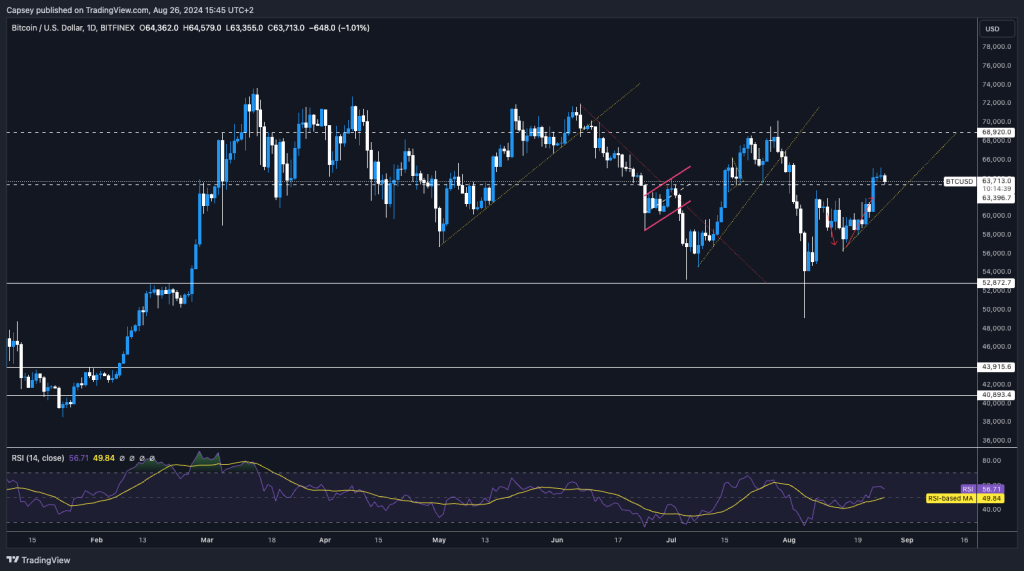
- It was a really great weekend, with Bitcoin moving higher and reclaiming above the key horizontal level of $63,400.
- We'd like to see price use the $63,400 horizontal level as new support, which can help propel price higher from there.
- Above the current price, the major horizontal resistance is the $68,900 level.
- On the downside, if $63,400 is broken, we'd expect price to find support in the zone between $60,300 to $61,800.
- The RSI is at 57, so this indicator suggests there could be more upside momentum for price ahead.
Cryptonary's take
The market has made a very positive move up over the last five days or so, reclaiming a key level of $63,400. We didn't expect price to move up as strongly as this last week.However, with positive comments from Powell at Jackson Hole, the market has responded to the upside. The market may now consolidate until Thursday and Friday's data and will likely move up or down more materially based on how that data comes in.
In the immediate term (next few days), we don't have a clear view of how price might move here. So, we'd look for price to retest the $63,400 horizontal support and bounce from that level. That would increase our confidence that Bitcoin can move up and retest its overhead resistance at $68,900.
ETH
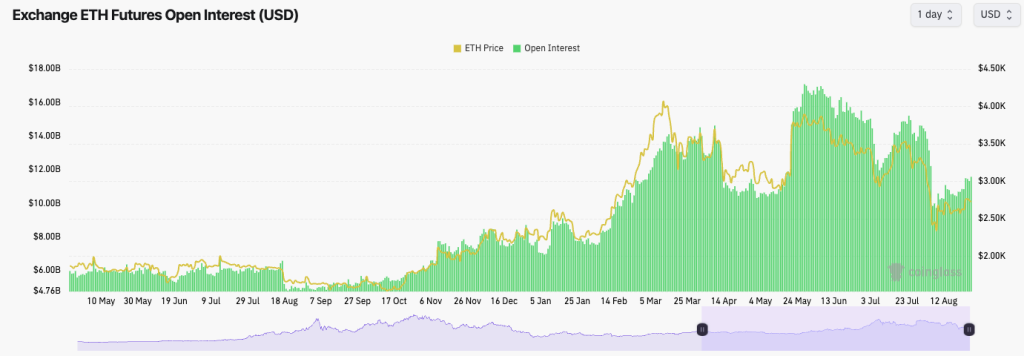
ETH's Open Interest has increased over the last few weeks but remains well below its highs in late May.The Funding Rate is also relatively flat, suggesting that traders lack the conviction to take a meaningful position in betting on ETH.
This is a positive leverage setup, as excesses have been flushed out, and new leverage has yet to pile back on.
ETH Open Interest:
Technical analysis
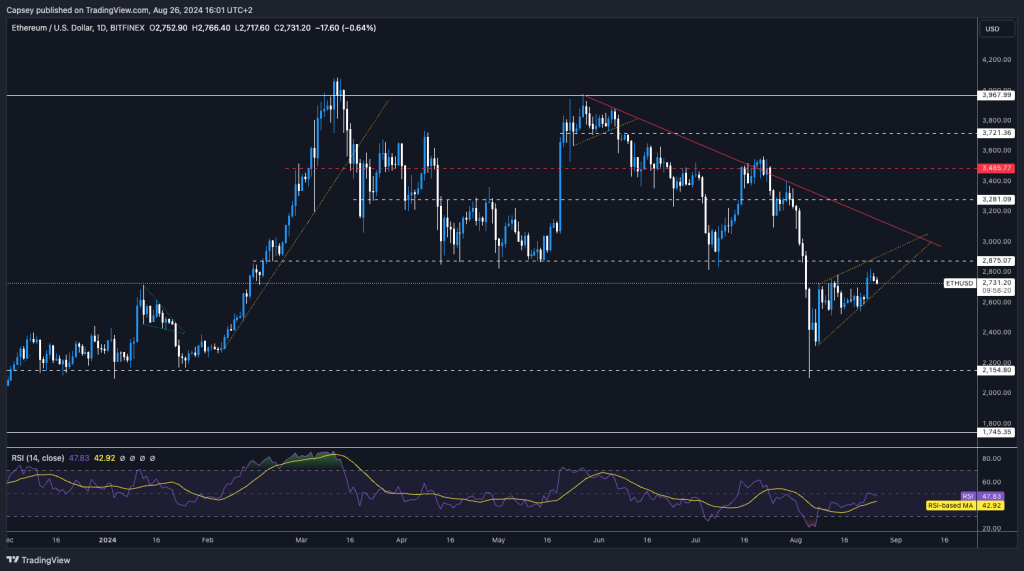
- ETH is currently in an ascending triangle. These patterns tend to have a bias to break to the downside.
- If the ascending wedge breaks down, ETH has support between $2,540 and $2,640. We would expect this zone to act as support if the price retests lower.
- To the upside, there is a major horizontal resistance at $2,875. If ETH can reclaim above this level, we'd consider that very positive.
- The RSI is at 48, so ETH is not currently anywhere near being overbought.
- If ETH were to clear above $2,875, the next main resistance would be the main downtrend line (red line).
Cryptonary's take
If ETH were to dip back into the $2,400 to $2,600 range, I (Tom) personally would see that as an attractive area to add to Spot bags. We've seen that ETH can still run in this market; look back to February, when it ran from $2,300 to $4,000 in five weeks.In the immediate term, we think ETH can pull back very slightly and maybe retest between $2,500 and $2,600. A clean break above $2,875 would be a bullish signal for us.
SOL
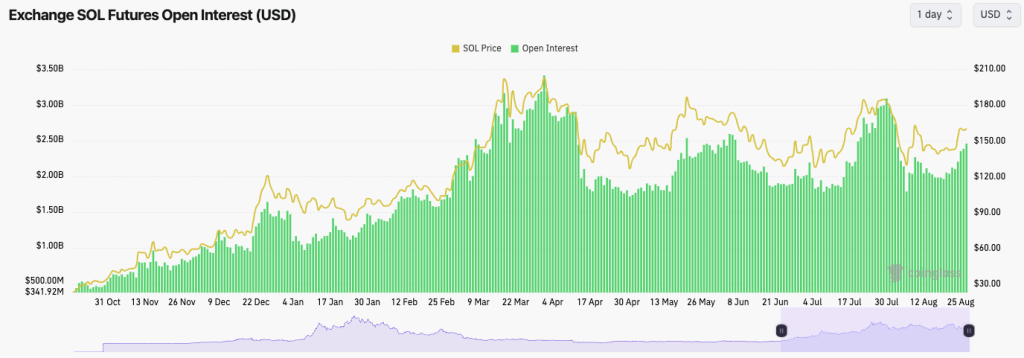
SOL's Open Interest has ramped up in recent days, but it remains below its highs set back in late March.The funding rate is positive, suggesting that the leverage used in the past few days has been mostly on Longs.
SOL Open Interest:
Technical analysis
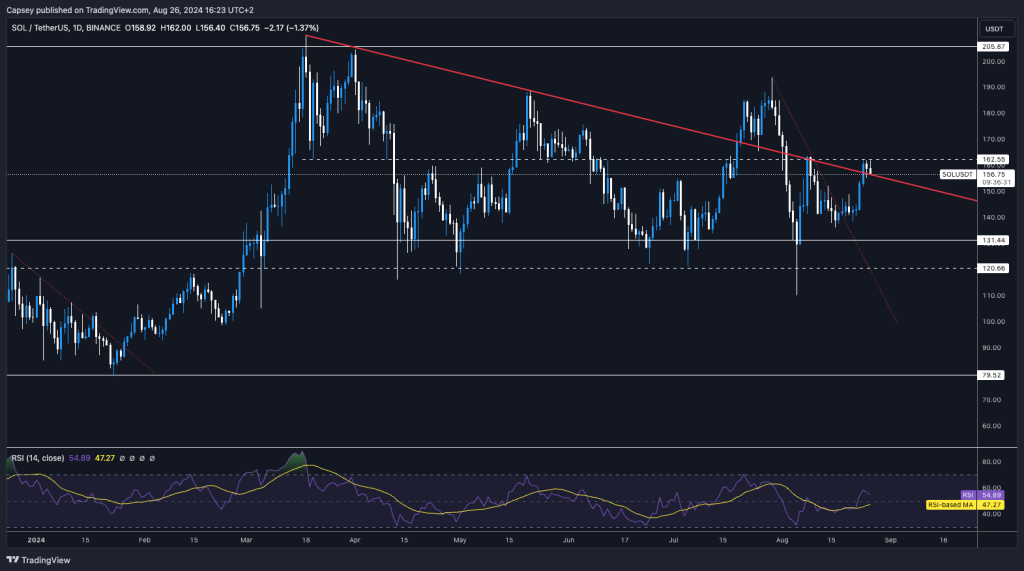
- There has been a really nice 15% or so move up in the last few days, which has seen SOL spike above the main downtrend line.
- However, SOL has encountered resistance at the horizontal resistance level of $162, which we have marked as a key level for a long time.
- However, SOL is also forming a pennant/bull flag pattern (we're not sure which one yet; we'd need more days' worth of price action), but it looks like a bullish pennant. These tend to have a bias to break to the upside.
- There is a lot of support below the current price, with the first zone between $140 and $145. The second zone would be between $120 and $131, although we wouldn't be confident about price retesting this level.
- The RSI is at 57, so SOL is not currently in or even near overbought territory on the Daily, meaning there's the potential for further upside in the short term.
Cryptonary's take
SOL has now moved into a more significant horizontal resistance area, so we may see a slight pullback in the immediate term, but likely just a shallow pullback.However, we believe that in the coming week or two, we can see a break out above $162, and that may be enough to ignite the bullish reversal that sends price back to $200.
For now, we remain patient, having had months to accumulate in the $120s and $130s—assuming you weren't here in 2023 when we accumulated in the $20-$40 range.
WIF
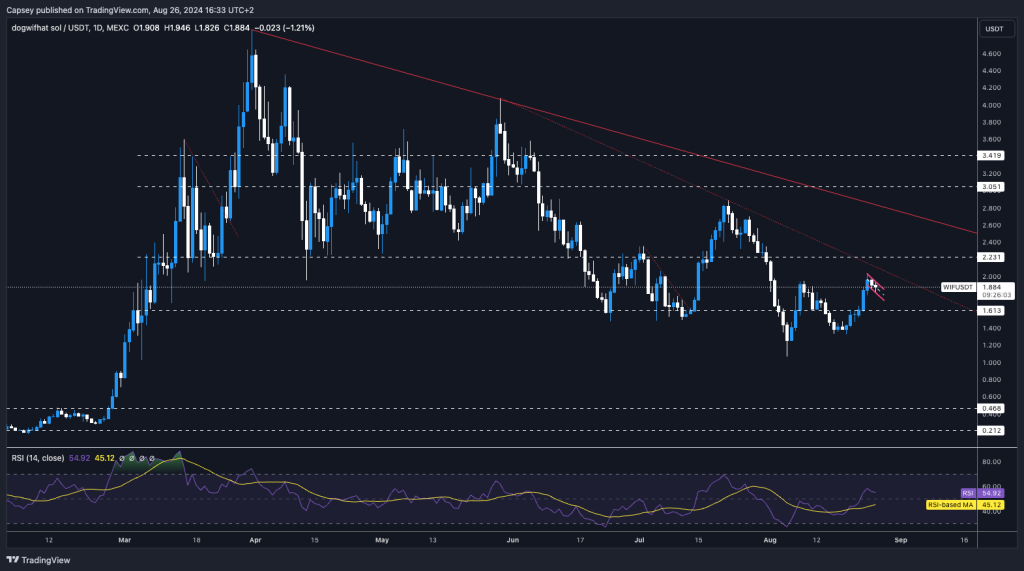
- WIF bumped into the underside of the $1.60 horizontal resistance a few times; however, we got a convincing break out above $1.60 last Friday.
- Price is now locally creating a bull flag. These have a bias to break out to the upside.
- To the upside, the resistances are the local downtrend line (red dotted line) and the horizontal resistance of $2.23.
- A break out above $2.23 would be the first sign of a bullish reversal. The main level will be if/when price breaks out above $3.05 and $3.40 (that range/zone).
- To the downside, we'd expect $1.60 to act as support. If that level is lost, we'd have to reconsider our current bullish bias on WIF.
Cryptonary's take
WIF is at a local resistance here, although we do expect it to continue breaking out and retesting the main resistance at $2.20 sometime this week, possibly towards the end of the week. We would also expect the $1.70s to hold up as support in the immediate term.For now, we'll continue to play and monitor the range. The bull reversal occurs upon a breakout above $2.20.
For an in-depth look at market performance, see our analysis on dogwifhat (WIF).
POPCAT
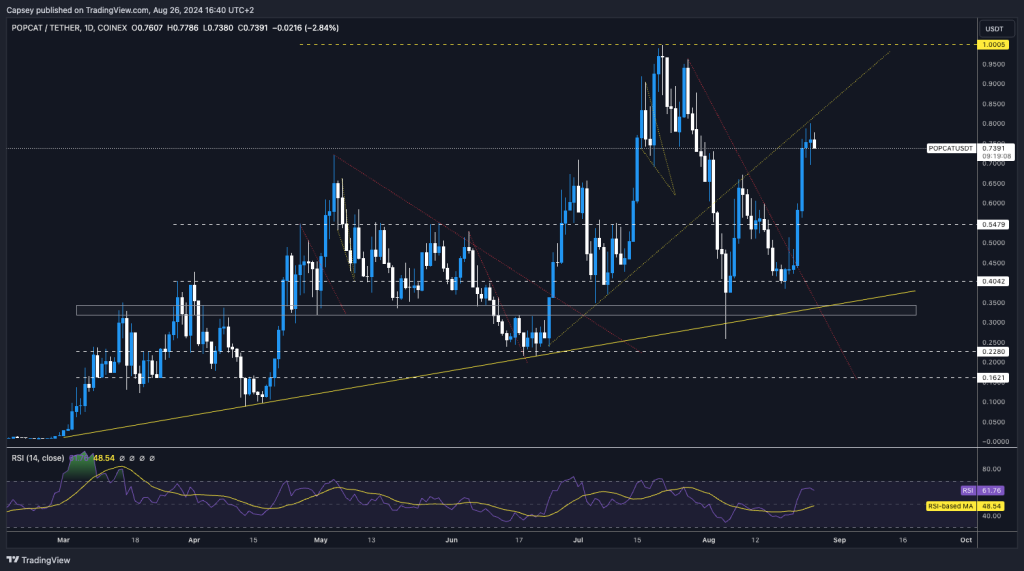
- POPCAT has had a monstrous breakout from the main downtrend line, where the price smashed through the horizontal resistance of $0.55.
- Price now finds itself testing the underside of the prior uptrend line as a new resistance.
- To the downside, we would now expect the prior local highs of $0.65 to act as new support, with $0.55 also being a new major support.
- It may take more time, but we expect the all-time highs to be retested in the coming weeks/month ($1.00).
- The RSI is not yet overbought on the Daily, but it is nearly overbought territory.
Cryptonary's take
Overall, this was a brilliant move. However, we think in the immediate term, price might pull back slightly and retest the $0.55 to $0.65 levels. For those thinking of selling their bags and rebuying lower, we certainly wouldn't feel comfortable doing this; we prefer just straight holding. We expect it'll just be a matter of time before POPCAT breaks above all-time highs and establishes itself in the $1-$2b range.
Recommended from Cryptonary


