Save 23% ($351) & Get a Free 1-1 Call with our Team ⏰ : 0d 2h 59m 43s
Election tensions heighten key levels for BTC, ETH, and others
With the election approaching, BTC, ETH, SOL, and others are trading at key levels. BTC, ETH, and SOL face critical support zones, while WIF, POPCAT, and SPX test important buy areas. Will election results spark a rally or deepen the retreat? Let's dive into the latest crypto trends.

Disclaimer: This is not financial or investment advice. You are responsible for any capital-related decisions you make, and only you are accountable for the results.
BTC:
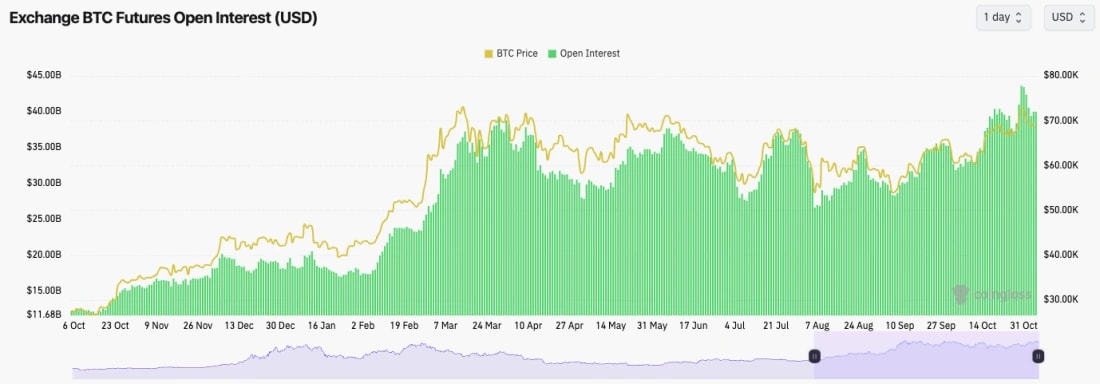
- BTC's Open Interest remains high, although it has pulled back slightly in the last few days as Trump's odds have come in and "Trump trade" assets have pulled back.
- BTC's Funding Rate remains positive, around the upper end, but still a healthy area of 0.01%.
Technical analysis
- BTC was rejected from the all-time highs at $73,600 and has since pulled back to the prior horizontal resistance at $68,900.
- To the upside, $73,600 (all-time high) is now the major resistance and a clean break out above likely ignites the "euphoria" stage of the bull run.
- On the downside, the current level of $68,000 to $68,900 should act as support going into the election.
- Beneath $68,000, $66,000, and then $63,400 are the key horizontal levels.
- Since poking into the all-time highs, the RSI has pulled back from overbought levels, and it's now in a more middle and neutral territory at 54.

- Next Support: $68,000
- Next Resistance: $73,500
- Direction: Neutral
- Upside Target: $73,500
- Downside Target: $66,000
Cryptonary's take
It seems the obvious explanation for this pullback is that price moved into all-time highs on strong odds of a Trump win. However, as those odds have come in slightly, there has been profit-taking on "Trump trade" assets which has then led to a pullback. It was also unlikely that risk appetite was going to increase substantially pre-election.Most smart money waits for an outcome, regardless of what the outcome is, to put capital into work. If Trump wins, it's very likely we'll see BTC trade north of $75k by the end of this week. If Harris wins, it's possible that BTC will sell off and potentially trade between $60k and $63k. However, we would see this as a buying opportunity. We're bullish mid and long-term, regardless of who the winner is.
Get the latest Bitcoin price prediction—dive into our detailed analysis to stay one step ahead!
ETH:
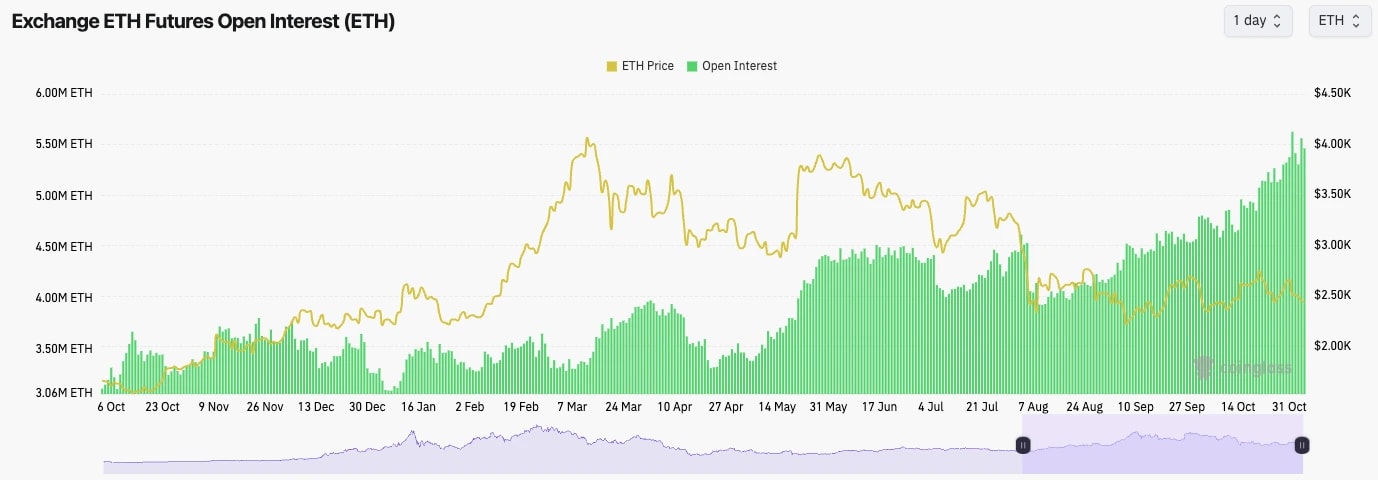
- ETH's Open Interest remains at highs (measured in the number of coins rather than USD) suggesting there are a lot of leverage bets on ETH currently.
- The funding rate is at 0.01%, so it is still at a relatively healthy level.
- If there is a Harris win, it's possible we see price trade lower and OI be flushed down.
Technical analysis
- ETH is now entering its fourth month in the lower price range of $2,150 to $2,800.
- ETH was rejected in the $ 2,700s and underside of the local uptrend line. Price has now fallen back into the main downtrend and beneath the key horizontal level of $2,557 - not great!
- Price is now approaching its local support level at $2,420, which will need to hold or $2,300 is likely and the door to the major support at $2,150 will be open.
- On the upside, honestly, our focus is just on reclaiming $2,557 at this rate. This will likely only happen if we see a Trump win.
- ETH's RSI is at 41, so somewhat still in middle territory, although the smaller timeframes are putting in bullish divergences.

- Next Support: $2,420
- Next Resistance: $2,550
- Direction: Neutral
- Upside Target: $2,550
- Downside Target: $2,150
Cryptonary's take
It's becoming harder and harder here to stay positive on ETH. ETH has attempted a breakout of the main downtrend line a number of times and it has failed at each opportunity. We would likely only see a more substantial upside for ETH upon a Trump victory, however, we still favour other assets under that scenario, SOL for example. If Harris wins, it's possible we will see ETH re-visit $2,150.SOL:
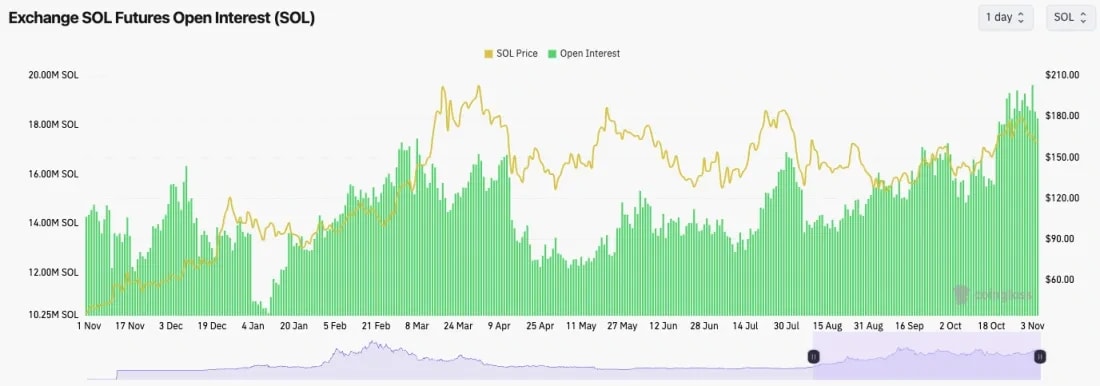
- SOL's Open Interest remains elevated despite the more than 10% price pullback.
- SOL's Funding Rate is also at 0.007% indicating that there is some Short interest despite the bias still being mostly Longs.
Technical analysis
- SOL moved into its higher price range (between $180 and $190) and swiftly rejected from that level as profit-taking began on "Trump trade" assets.
- Price has since pulled back having broken below the local uptrend line and now testing the horizontal area of $162.
- So far, the low $ 160 has acted as support. If that area cannot hold then the price will be back into it's old range (between $143 and $162).
- A break below $160 and a Harris win could see the price retest the next two horizontal supports at $143 and then potentially as low as $131.
- To the upside, $162 is the level to reclaim, and beyond that $180. Very likely we see $180 tagged if Trump wins.
- The pullback from the $180's has more meaningfully reset the RSI which had put in a bearish divergence at the highs. The RSI has now pulled back to the middle territory of 47.

- Next Support: $143
- Next Resistance: $162
- Direction: Neutral
- Upside Target: $162
- Downside Target: $143
Cryptonary's take
We currently look at SOL as just playing between the ranges, with the wider range between $131 and $180 and $143 to $162 as the tighter range for price. The coming day's price action very likely depends on the election outcome. A Trump win likely sends the price to the top of the range, and a Harris win is the opposite. Ultimately, if it is a Trump win, then $160 for SOL will look cheap a month from now. Hard to call here, it comes down to Tuesday/Wednesday's Election.WIF:
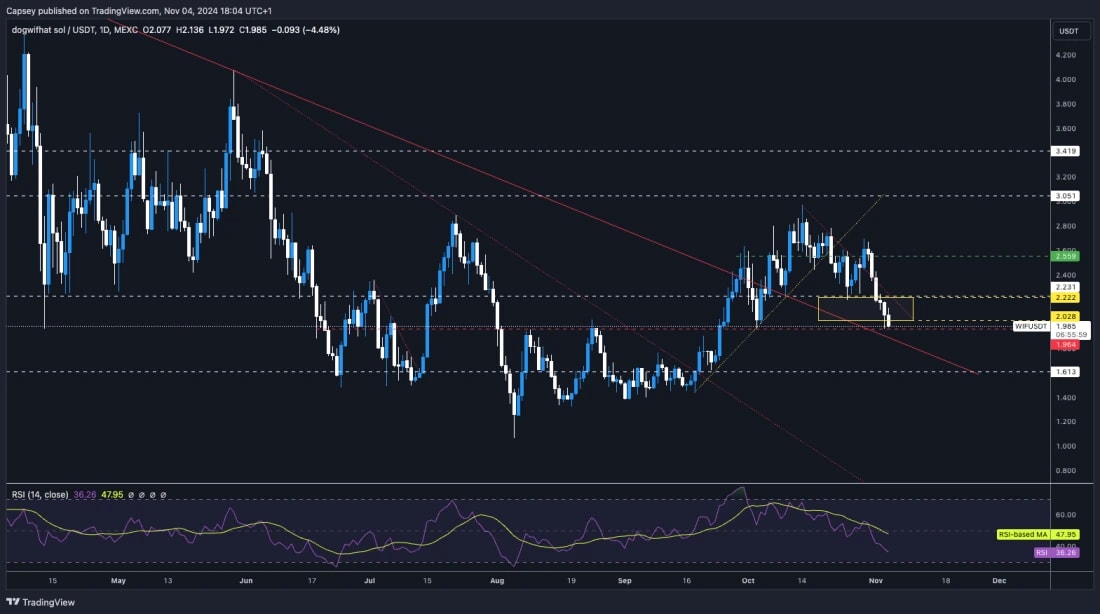
- Following the rejection at $3.00, WIF has pulled all the way back to the Yellow buy box and it is even testing the lower horizontal support now at $1.96.
- On this pullback over the last few weeks, the RSI has reset substantially and now it's just above oversold territory, with many of the smaller timeframes either in or close to overbought territory.
- On the downside, we wouldn't be surprised if $2.00 is the local low, especially if Trump wins. However, if there is a Harris win, it's possible there's a reaction lower and the $1.70 area is tested. But we'd expect this to be bought up.
- To the upside, the key levels to reclaim are $2.20 and then $2.55.
- Next Support: $1.96
- Next Resistance: $2.20
- Direction: Neutral
- Upside Target: $2.55
- Downside Target: $1.70
Cryptonary's take
Looking at the barbell portfolio and in terms of price, WIF looks the most attractive for a buy here. If we get a Trump win tomorrow/Wednesday, sub $2.00 will look super attractive. Ultimately, this week will come down to whether Trump or Harris wins. Personally (Tom), I added some WIF yesterday and today at the $2.00 level, although I still have cash on the side to buy up the major dip on a Harris win if that's what we get.POPCAT:
- A more meaningful pullback that was long overdue, in our opinion.
- Price broke out of the red resistance box and shot up to the green box that we thought might be the final resistance of the move. That's exactly what has happened and the price has reset since.
- The price has broken its local uptrend, which could potentially cause the price to revisit the $0.90 to $1.10 area. This would be a strong buying zone for us if the price did revisit this zone.
- In terms of downside, the price area for major support would be between $0.90 to $1.10, even on a Harris win, we'd be surprised to see POPCAT below those levels.
- On the upside, $1.50 to $1.60 will likely act as short-term resistance unless Trump wins.
- The RSI has pulled back to middle territory, but it's still not close to oversold territory on the Daily timeframe, although it is on the smaller timeframes.

- Next Support: $1.10
- Next Resistance: $1.60
- Direction: Neutral
- Upside Target: $1.60
- Downside Target: $1.10
Cryptonary's take
The price tagged $1.80 as we predicted and pulled back from there. This pullback is somewhat to be expected considering how strong the move up from early September was with the price going from $0.47 to $1.80 high. A healthy pullback to $1.10 to $1.25 preelection would be positive and healthy here, so we're not panicked, especially considering the rest of the market is also pulling back quite substantially.
SPX:
- The price has doubled, just shy of the $1.00 area, and has pulled back more substantially now.
- The price continues its downtrend, with the price now below the $0.75 horizontal support, and the main uptrend line is being tested.
- The main uptrend line has convergence with the horizontal level of $0.65. If these levels are broken to the downside, the price likely swiftly revisit $0.50.
- To the upside, $0.75 is the area to reclaim.
- We continue to note declining volumes here.
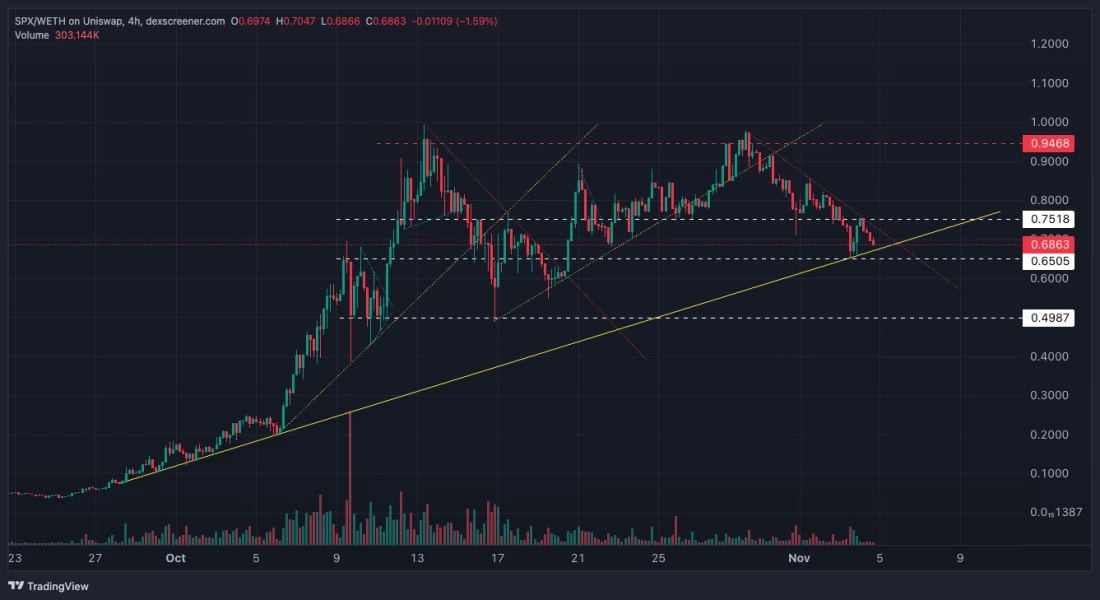
- Next Support: $0.65
- Next Resistance: $0.75
- Direction: Neutral
- Upside Target: $0.90
- Downside Target: $0.50
Cryptonary's take
SPX is in a crucial area here, to be honest. Price is squeezing into the pinpoint between the local downtrend line and the main uptrend line. Price likely breaks in the direction of the election winner; if Trump wins, price breaks up. Harris wins, price breaks down. Price is now tight between two key levels, $0.65 and $0.75. The election outcome tomorrow is likely pivotal for short-term price direction.Recommended from Cryptonary


