Save 23% ($351) & Get a Free 1-1 Call with our Team ⏰ : 0d 2h 59m 43s

In this report, we'll break down Ethereum's price action and lay out a playbook for capitalising on its current setup. By comparing it to the broader crypto market, analysing key levels, and exploring liquidation dynamics, we'll uncover why Ethereum, at this moment, may offer one of the most compelling opportunities for both short- and long-term traders.
Let's dive in!
Disclaimer: This is not financial or investment advice. You are responsible for any capital-related decisions you make, and only you are accountable for the results.
Price action comparison: Bitcoin, Ethereum, and Solana
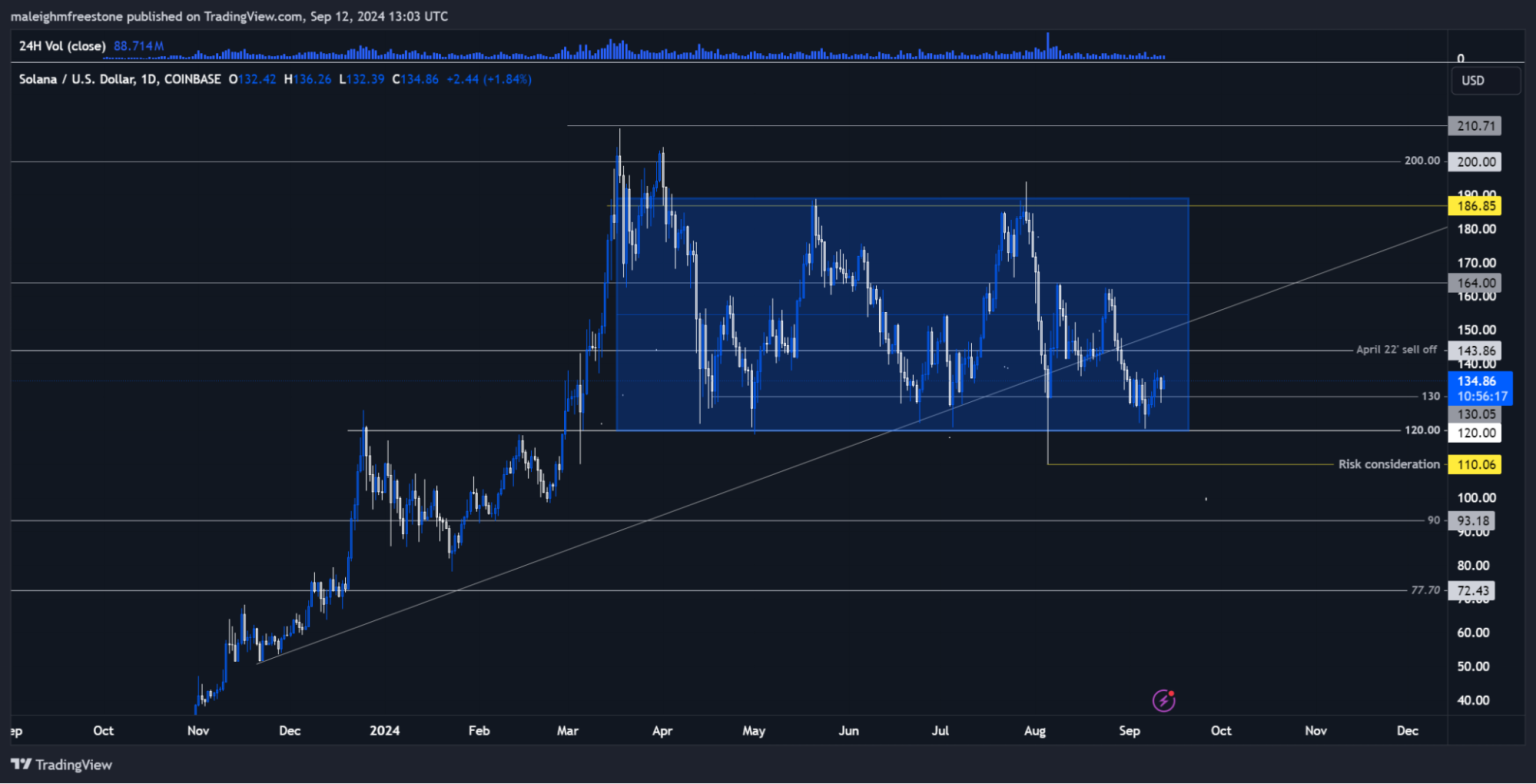
Let's start by comparing the price action of the big three: Bitcoin, Ethereum, and Solana.Despite Solana's potential to outperform Ethereum this cycle, Ethereum still offers an attractive setup. Ethereum's recent institutional adoption via its ETF approval is a significant catalyst comparable to Bitcoin's. While Ethereum might not provide the same potential upside as Solana due to its larger market size, it remains a solid opportunity for traders.
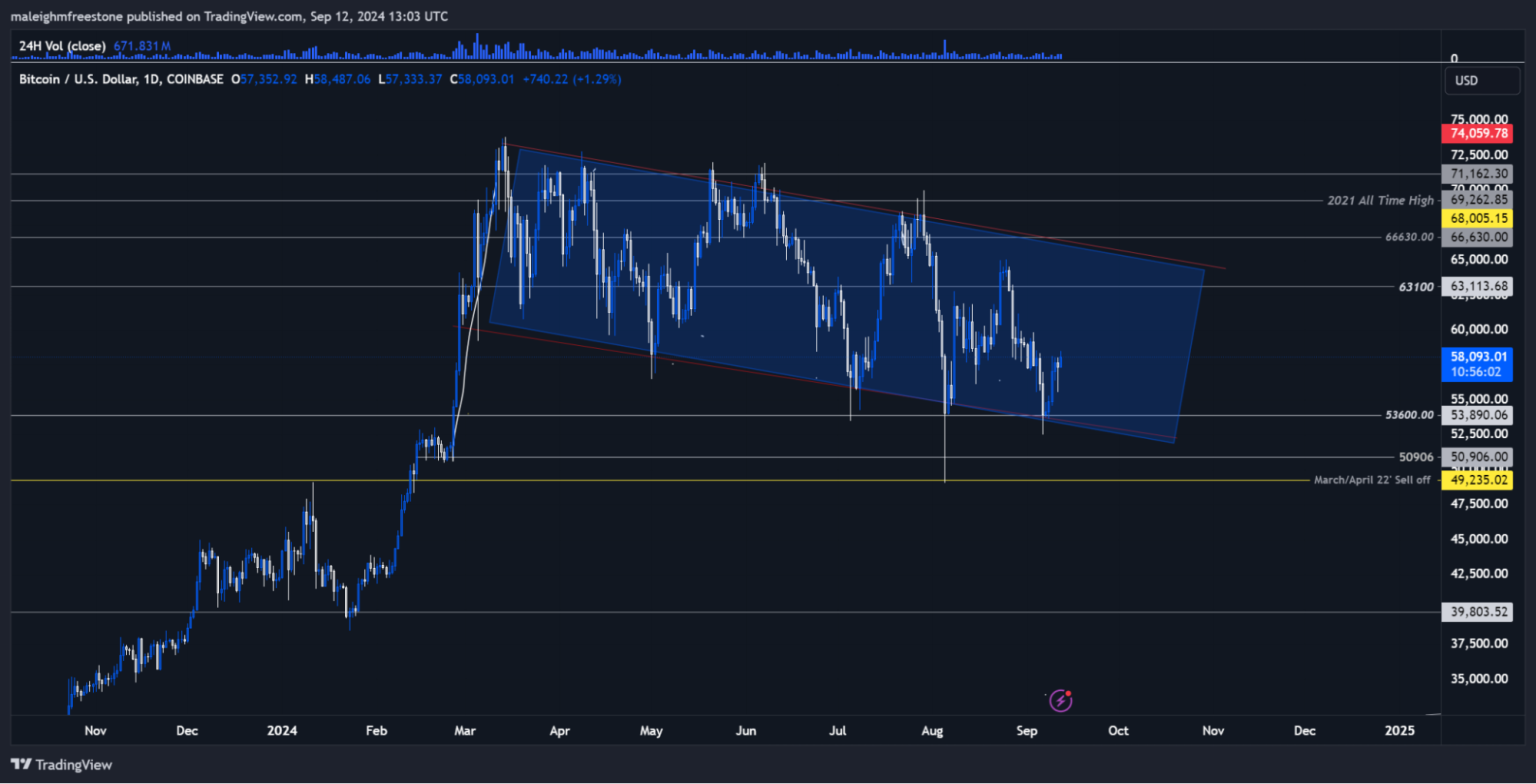
To understand the different impacts, think of Bitcoin as the ocean, Ethereum as a lake, and Solana as a large swimming pool.
Dropping a wrecking ball in these bodies of water represents how these assets react to market catalysts. The larger the liquidity pool, the less impact the wrecking ball (or price movement) makes, but the upside still exists for Ethereum as it consolidates and offers clear setups at key levels.
Educational nugget: Liquidity pools and market impact
Larger assets like Bitcoin and Ethereum have higher liquidity pools, meaning their price action tends to be less volatile compared to smaller assets like Solana, which can see sharper, more exaggerated moves.
Building the case for Ethereum: Fibonacci retracement & key levels
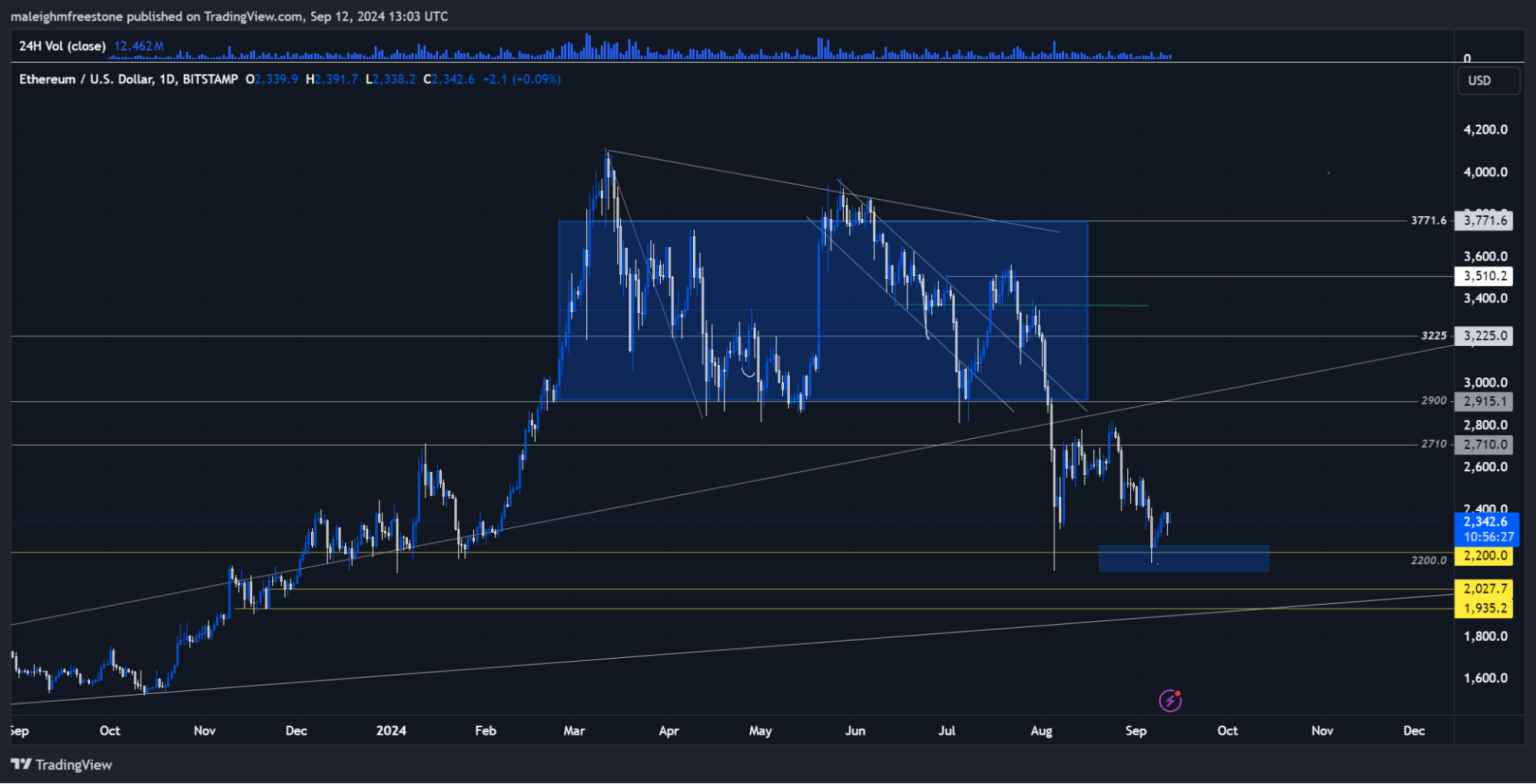
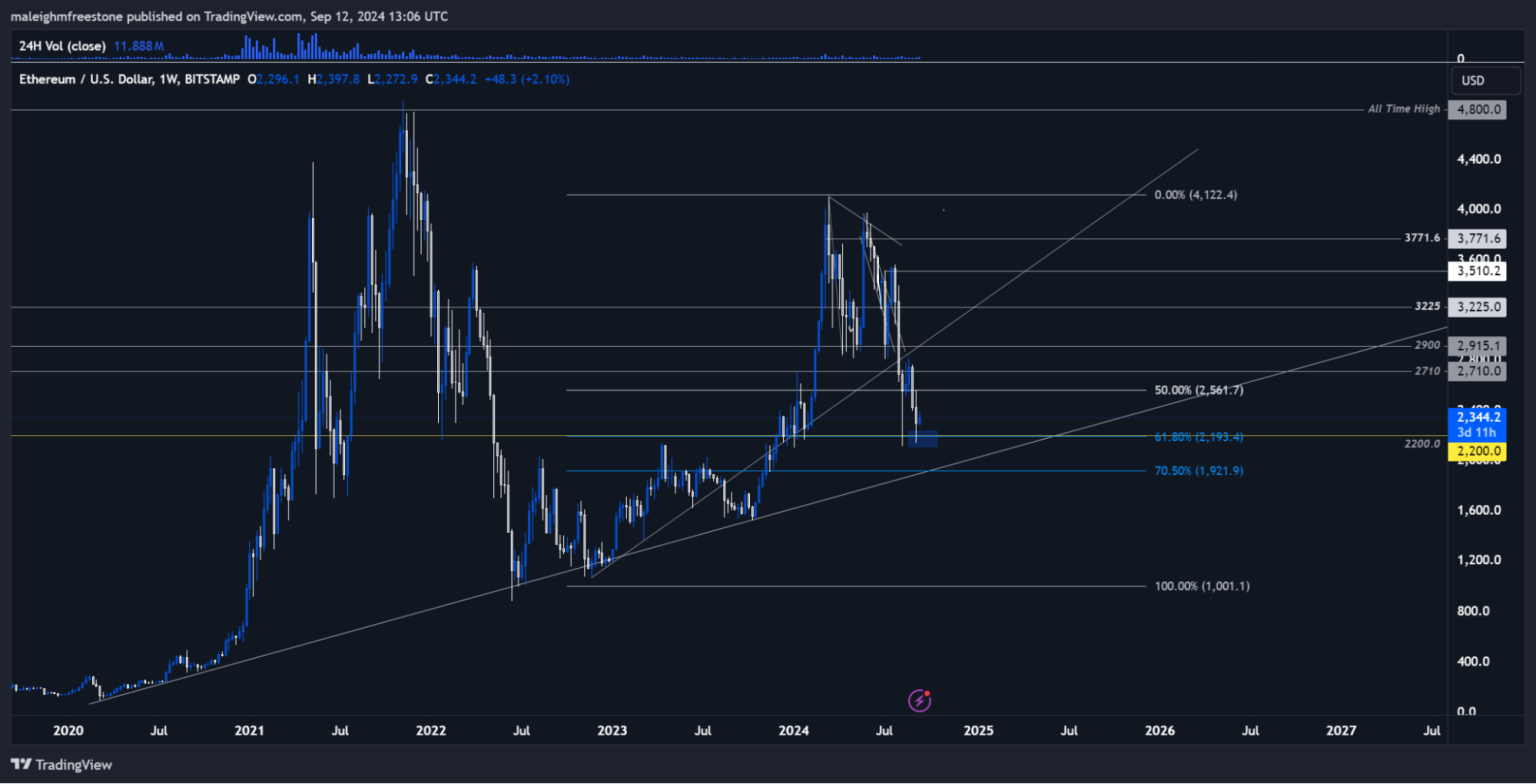
The current key level for Ethereum is around $2,200, which aligns with multiple technical indicators. By pulling a Fibonacci retracement from the low in June 2022 to the high in March 2023, we land precisely at the 61.8% retracement level. This is a powerful indicator, as Ethereum Fibonacci levels have historically proven to be reliable in identifying reversal zones. This level suggests a strong base for further upside.In addition to the Ethereum Fibonacci levels, Ethereum's previous price action reveals that the $2,200 level has often served as both support and resistance. This level triggered a significant surge in January 2023, further highlighting its importance. As traders continue to monitor this area, its historical significance, combined with the retracement zone, solidifies its role as a prime entry point.
Educational nugget: Fibonacci retracement
The 61.8% retracement level is a key zone used by traders to pinpoint potential reversal points in trending markets. Ethereum's consistent respect for Ethereum Fibonacci levels boosts confidence in this strategy, making it a valuable tool for technical analysis.
Market mechanics and liquidation heatmap
Ethereum's price action has recently been different from that of Bitcoin and Solana. While Bitcoin has been consolidating in what looks like a bull flag and Solana has been range-bound, Ethereum broke below its range. This divergence makes it look undervalued, which is exactly where the opportunity lies.Examining market mechanics reveals that the liquidation heatmap shows a significant cluster of long liquidations near the $2,200 level. This suggests that Ethereum could gravitate toward this area as long positions unwind. When coupled with the confluence provided by Ethereum Fibonacci levels, this makes $2,200 a compelling target for bullish entries.
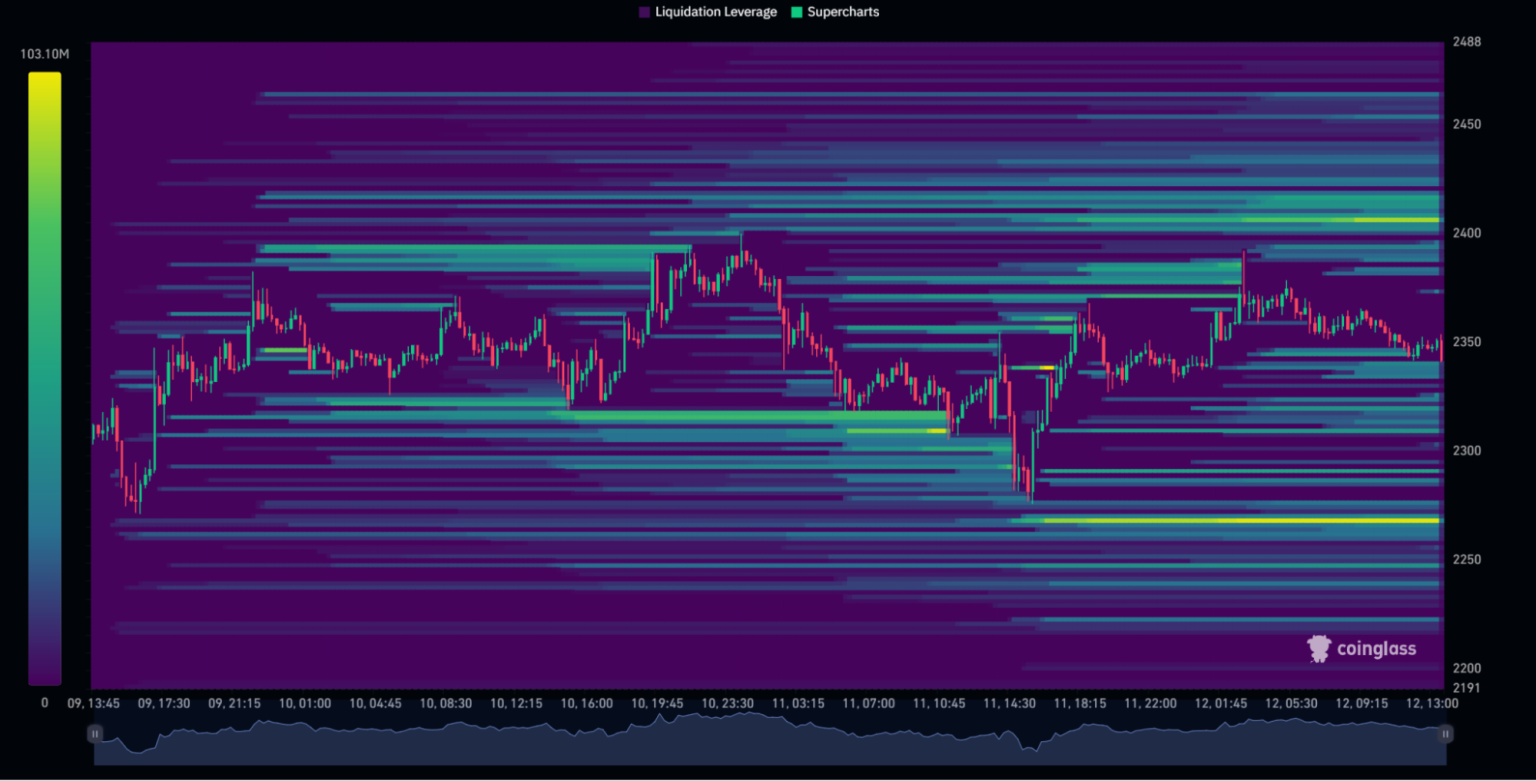
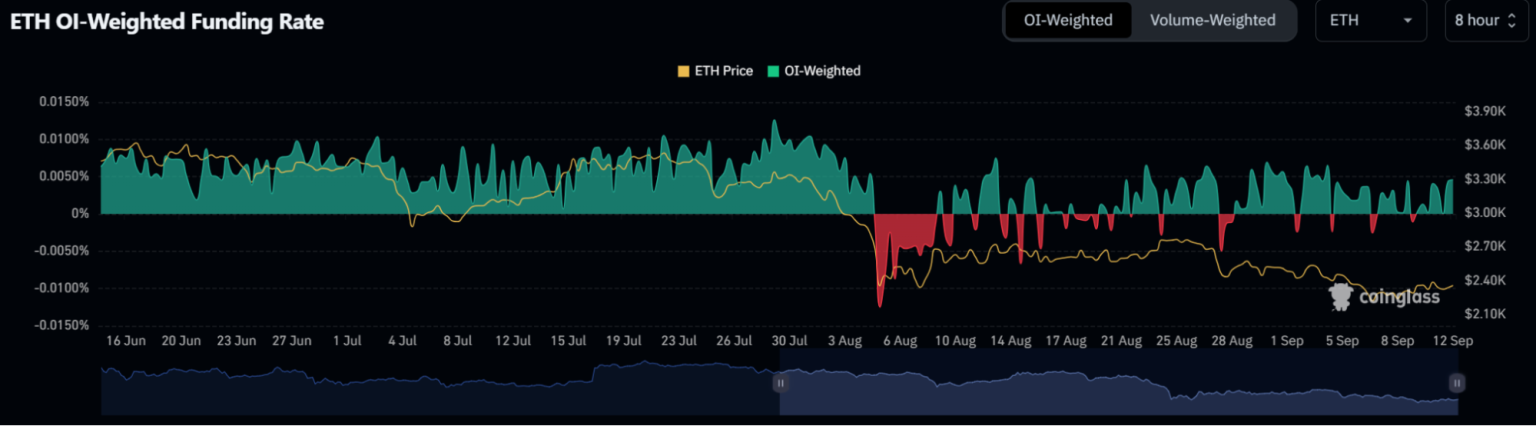
At the same time, a cluster of short liquidations above $4,000 presents the potential for a longer-term bullish breakout. While funding rates lean slightly towards longs, they remain balanced enough to avoid an imminent downside move. This setup is reinforced by the strength of Ethereum Fibonacci levels, which guide traders towards reliable strategies.
Educational nugget: Liquidation heatmaps
Liquidation heatmaps show areas where traders may be forced to exit positions, offering insights into potential price movements. In this case, the cluster of liquidations aligns perfectly with Ethereum Fibonacci levels, adding confidence to the $2,200 setup.
The playbook: Entry and risk management
Entry strategy
Key entry level: $2,200Based on the technicals, including the strength of Ethereum Fibonacci levels, this is a prime entry point. It's supported by historical price action, liquidation data, and the retracement zone.
Risk management
For leverage, keep it conservative. This trade should be approached with either 2x or 3x leverage. This allows for a balanced risk to reward, providing a comfortable margin for price fluctuations without risking liquidation.Stop losses: Place a stop loss 10-15% below the entry to ensure the downside is managed. If the price drops significantly below $2,200, re-evaluate for re-entry.
The next major support level below $2,200 is around $1,500, but it's unlikely Ethereum will drop this low, given current market dynamics.
Risk-to-reward
With a potential 200% upside to $6,600, this setup offers an exceptional opportunity for traders who position themselves correctly around Ethereum Fibonacci levels.Capital allocation
For a 10k account, using 2x leverage exposes you to a $20k position. A move to the $4,000 target gives you an 85% gain on the $20k, significantly boosting your overall account.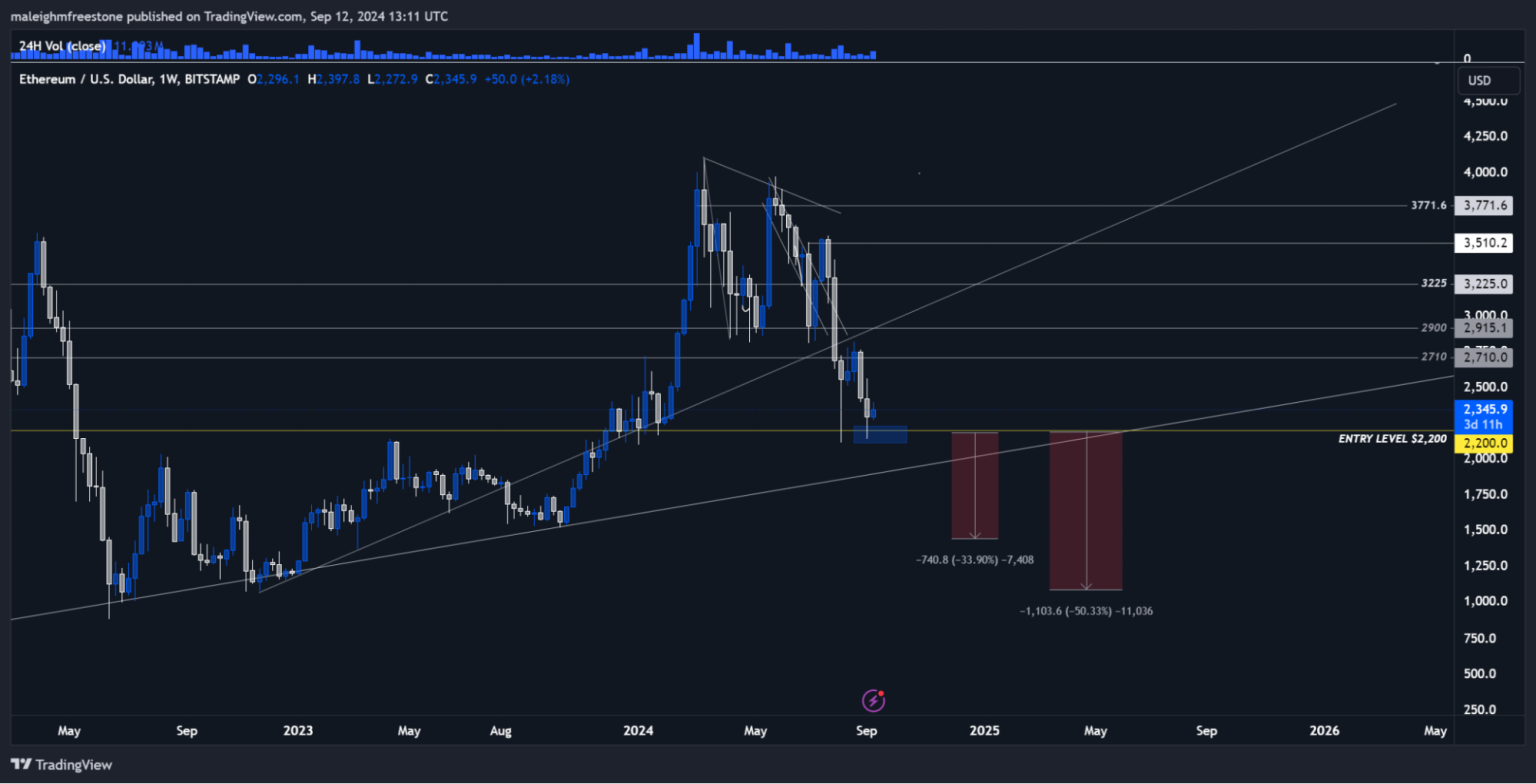
Summary
To summarise, this Ethereum trade setup is highly attractive due to the technical confluence at the $2,200 level, market mechanics supporting the move, and the broader fundamental story of Ethereum's institutional adoption.The key factors that build this case are:
- Fibonacci retracement to the 61.8% level.
- Historical support at $2,200.
- Liquidation clustering suggests limited downside risk.
- The target potential is $4,000, with an 85% gain in the medium term.
Cryptonary's take
Those who have been following know that in Market Direction reports, this ETH setup has become more and more attractive.Here is a written breakdown of the setup I (Mal) will be taking. It's a long-term play—I'm not looking for immediate gains, but we see this monster of an asset at undervalued levels, offering an attractive risk-to-reward setup. I hope you enjoy the video and explanation.
FAQs
Here are some FAQs related to the ETH technical analysis.1. What are the Fibonacci levels in Ethereum?
Fibonacci levels are key technical indicators used in trading to identify potential reversal points. For Ethereum, the 61.8% retracement level is particularly significant, aligning with the $2,200 price level and often acting as a reliable support or resistance zone.2. Why is the $2,200 level important for Ethereum?
The $2,200 level is a crucial price point for Ethereum due to its historical role as both support and resistance. It also aligns with the 61.8% Fibonacci retracement level, making it a strong candidate for bullish entry points.3. What is a liquidation heatmap, and how does it apply to Ethereum?
A liquidation heatmap shows areas where traders may be forced to close positions due to price movements. For Ethereum, clusters of liquidations near $2,200 indicate strong price activity around this level, reinforcing its importance in trading strategies.4. How should traders manage risk when trading Ethereum at $2,200?
Traders should use conservative leverage, such as 2x or 3x, and place stop losses 10-15% below the $2,200 entry level. This strategy helps manage downside risk while leaving room for price fluctuations.5. What is the long-term target for Ethereum based on the analysis?
The long-term target for Ethereum is $4,000, with the potential for an 85% gain from the $2,200 level. This setup is supported by strong technical and market factors, making it an attractive opportunity for traders.Recommended from Cryptonary


