Save 23% ($351) & Get a Free 1-1 Call with our Team ⏰ : 0d 2h 59m 44s
Market Updates
- Post-FED Meeting
- Earnings Season
- Bottom for Crypto or a Local Bottom?
- Cryptonary's Take
Disclaimer: This is not financial or investment advice. You are responsible for any capital-related decisions you make, and only you are accountable for the results.
Post-FED meeting:
On Wednesday (two days ago), the FOMC delivered a slightly hawkish Summary of Economic Projections. However, the markets rallied off the back of a more dovishly toned J Powell at the Press Conference. In the updated Summary of Economic Projections, the FED projected a slowing in growth for 2025, stickier inflation, and a slightly higher unemployment rate. The risk-weighted core PCE diffusion index shifted higher. This suggests that more members see the risks to inflation (remaining higher) as more pronounced than they see downside risks to growth. This meant 8 FED members shifted from 2 interest rate cuts in 2025 to just 1 cut or 0. This is undoubtedly hawkish, and this is why the markets initially sold off. However, Powell struck a more dovish tone in the Press Conference, as we can see from the examples below;- Powell didn't really acknowledge the above in his Press Conference.
- Powell downplayed a lot of concerns and just pushed the 'high level of uncertainty' narrative. He also mentioned that this caused some 'inertia' and hence the Dot Plot remained showing 2 cuts for 2025, but he spoke with confidence.
-
- Powell also gave off a reassuring tone, suggesting that the FED was in a good position to respond to any downside in growth (room to cut rates). This was also another indication that Powell is still thinking about 2 interest rate cuts (or potentially more) for 2025, and of course the market liked this as he could have gone the other way with it.
-
- When Powell was asked about tariffs potentially leading to more inflation risks, he resurrected the 'transitory' word. 'In the case of tariffs, this is a case where inflation risks can be looked through'. The markets obviously loved this. The reason is that if inflation does pick up slightly, Powell has now opened the door to blame it on tariffs, which he has now stated is likely transitory and, therefore, should be looked through. This also told the market that he still has a dovish/bias for cuts this year.
Earnings season:
Earnings season begins in mid-April, so we still have some time until we get there, but we're looking at Earnings to see if it can be a headwind to the current relief rally. In providing some context, and this was also noted by J Powell at Wednesday's Press Conference, we have seen the 'soft data' (surveys, etc) come in showing weakness, whereas the 'hard data' (jobs and inflation data) still come somewhat strong. However, we have begun to see consumer and business sentiment start to decline recently. This is likely due to the overall level of uncertainty having increased substantially, as we can see in the chart below. US Economic Policy Uncertainty: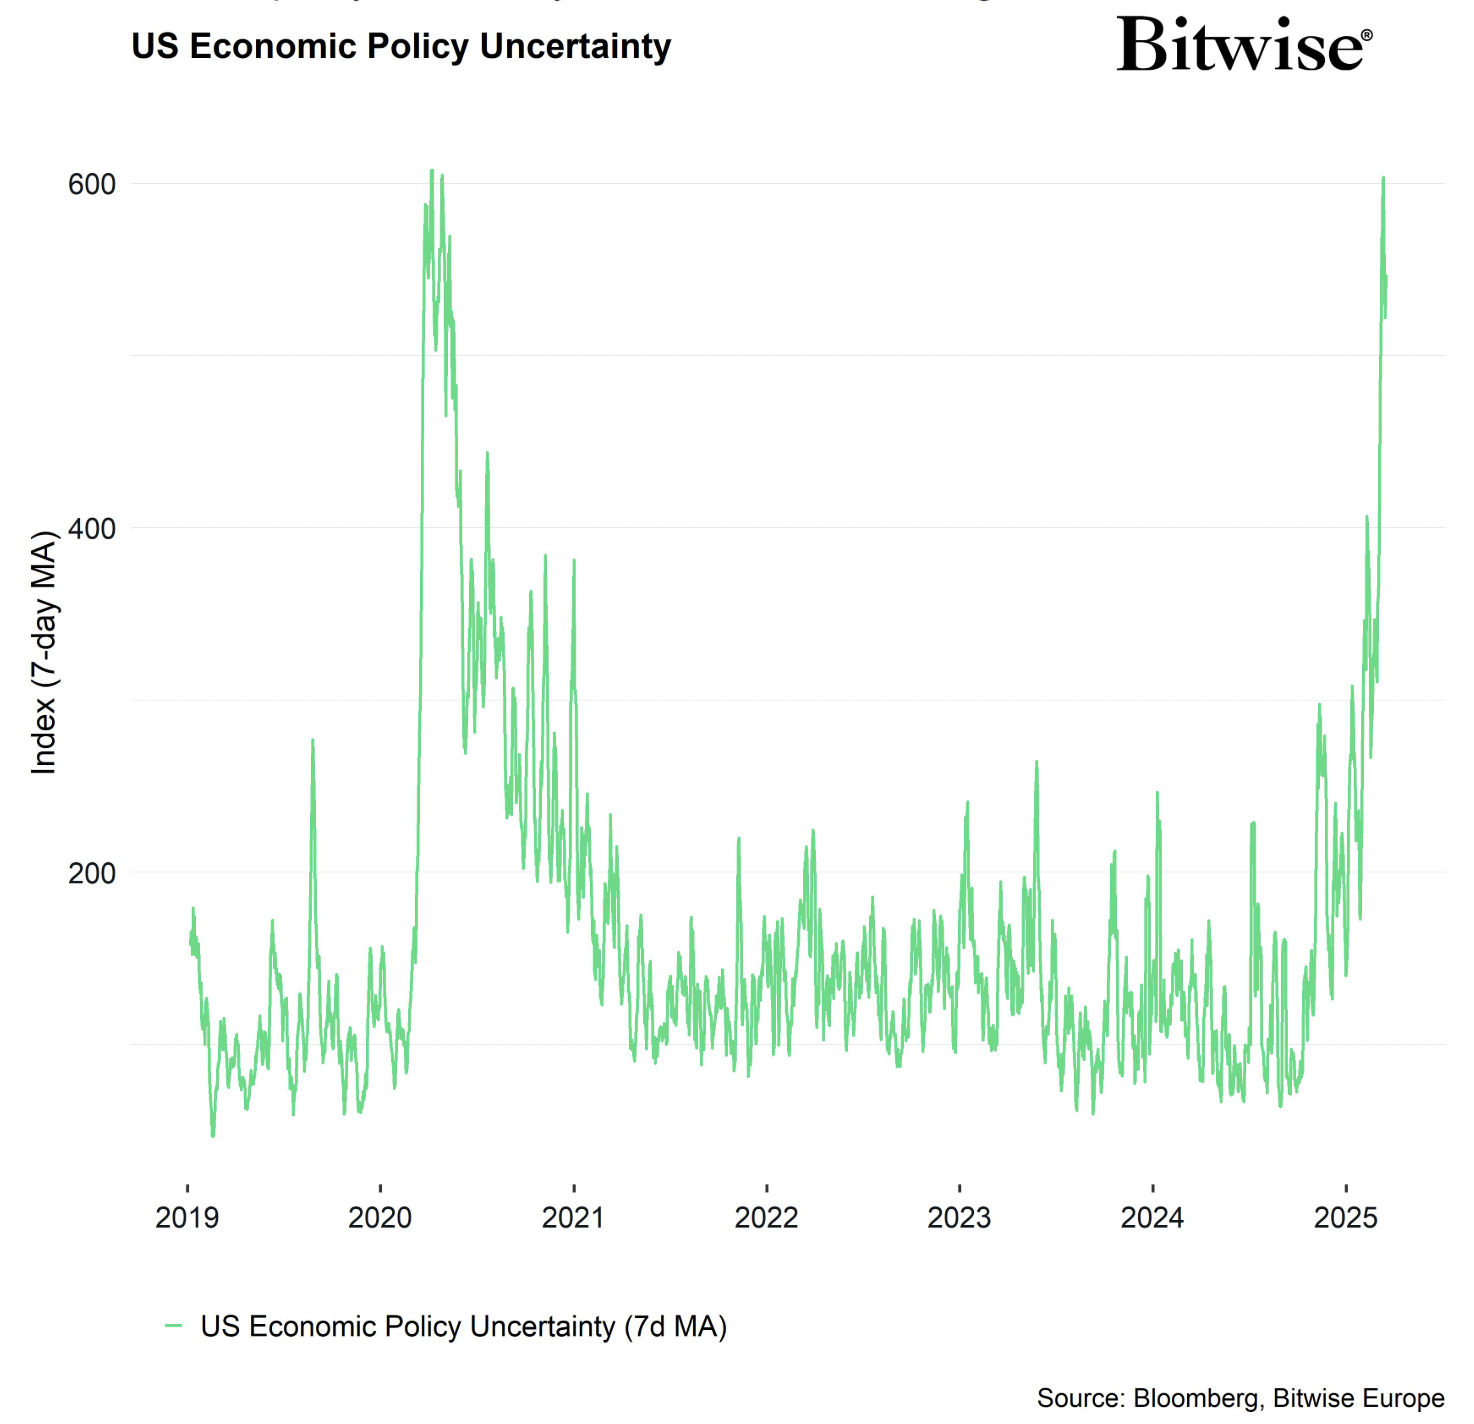 This uncertainty has also resulted in Earnings revisions continually coming down. It's therefore possible that even if this relief rally in markets can be sustained next week and in early April (but remember, reciprocal tariffs are announced on April 2nd), the market might be set up for a shock in Q1 Earnings season (in mid-April). The shock is that Earnings are guided much lower, and this might fuel a growth scare, which would likely result in risk assets (Crypto) going lower). US Earnings Revisions from Citi:
Bottom for crypto or a local bottom?
If we now look at this from a Crypto viewpoint, we can see in some of the simpler 'top-down' metrics that peak fear might be behind us. The Fear & Greed Index dropped to as low as 10 (the lowest since mid-2022) and has since recovered slightly. Now, in 2022, the Fear & Greed Index bottomed in mid-2022 rather than during the FTX collapse in November of that year. So, just because the Fear & Greed Index may have bottomed doesn't mean the price can't go lower, even if the Fear & Greed Index doesn't reach new lows. Fear & Greed Index: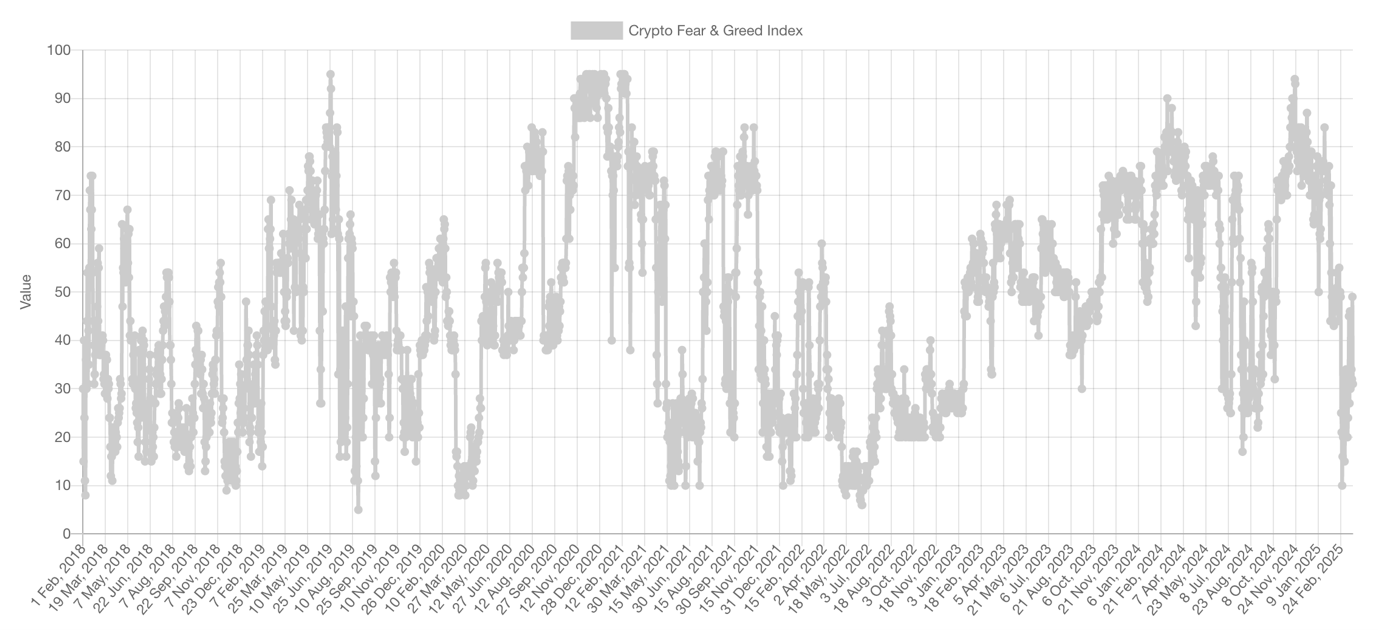 Another key metric we'll watch is the ETF Flows. In late February/early March, we saw significant ETF outflows. Those have now slowed, and we're now seeing small inflows. This may suggest that the ETF sellers are done in the short-term, and therefore those that wanted to sell have done so for now. We'll be watching this closely to see how this develops. Essentially, what we're looking for is no more meaningful outflow periods and for inflows to pick up. A risk-on signal for us will be when these ETF inflows more meaningfully pick up. BTC ETF Flows:
 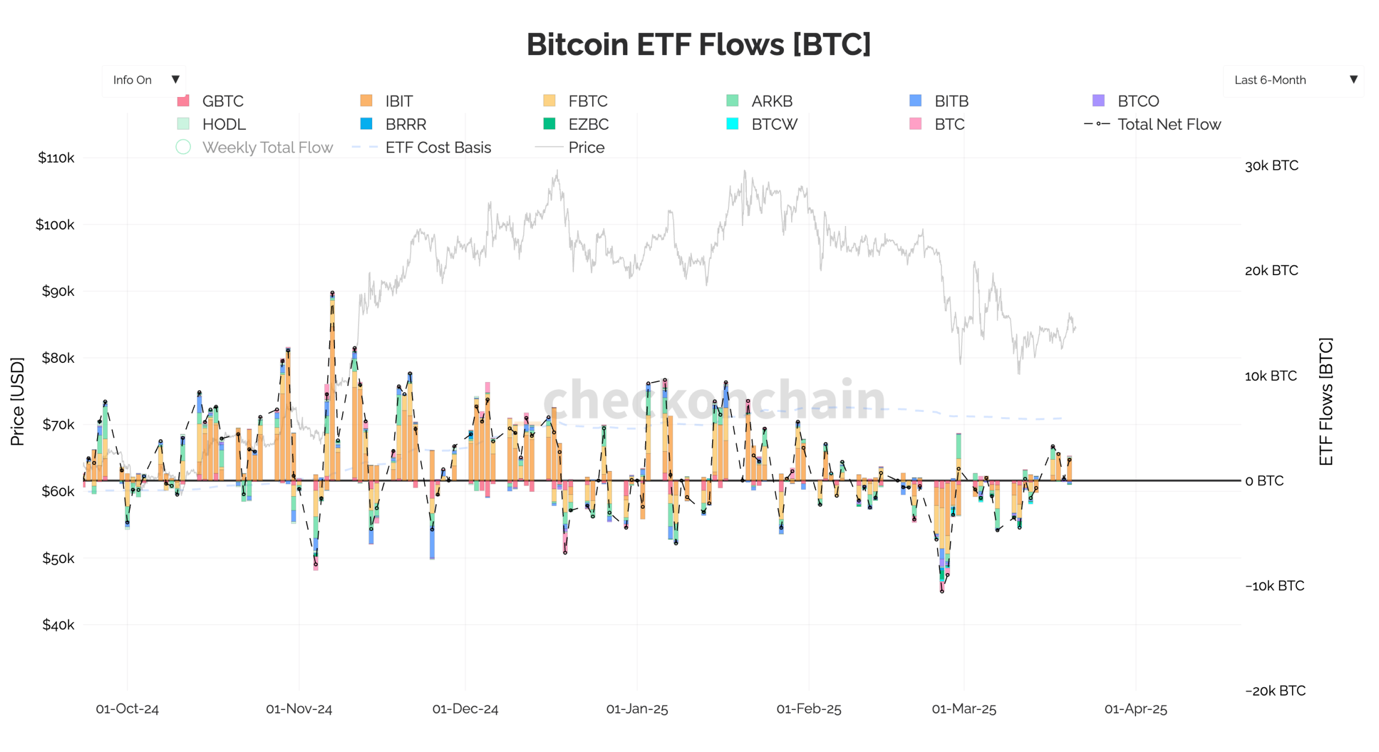 Just generally when we speak to other traders/other participants in Crypto, sentiment is extremely low, with some of the far end of the risk curve coins being decimated (price-wise). However, when we look at TOTAL3 (total Crypto market cap minus BTC and ETH's MCaps), we've seen a 38% drawdown, with the current bounce putting the drawdown at 30%. Now, this is substantial, but it's not the 60-90% drawdown that the market seems to feel has gone on. Yes, we've seen 70-90% drawdowns in memes, but these coins are at the furthest end of the risk curve. Ultimately, the TOTAL3 chart is holding quite a good structure, a far better structure than what sentiment might suggest. If TOTAL3 can hold the $704b horizontal support, that would maintain the longer-term bullish structure. TOTAL3 Weekly Timeframe:
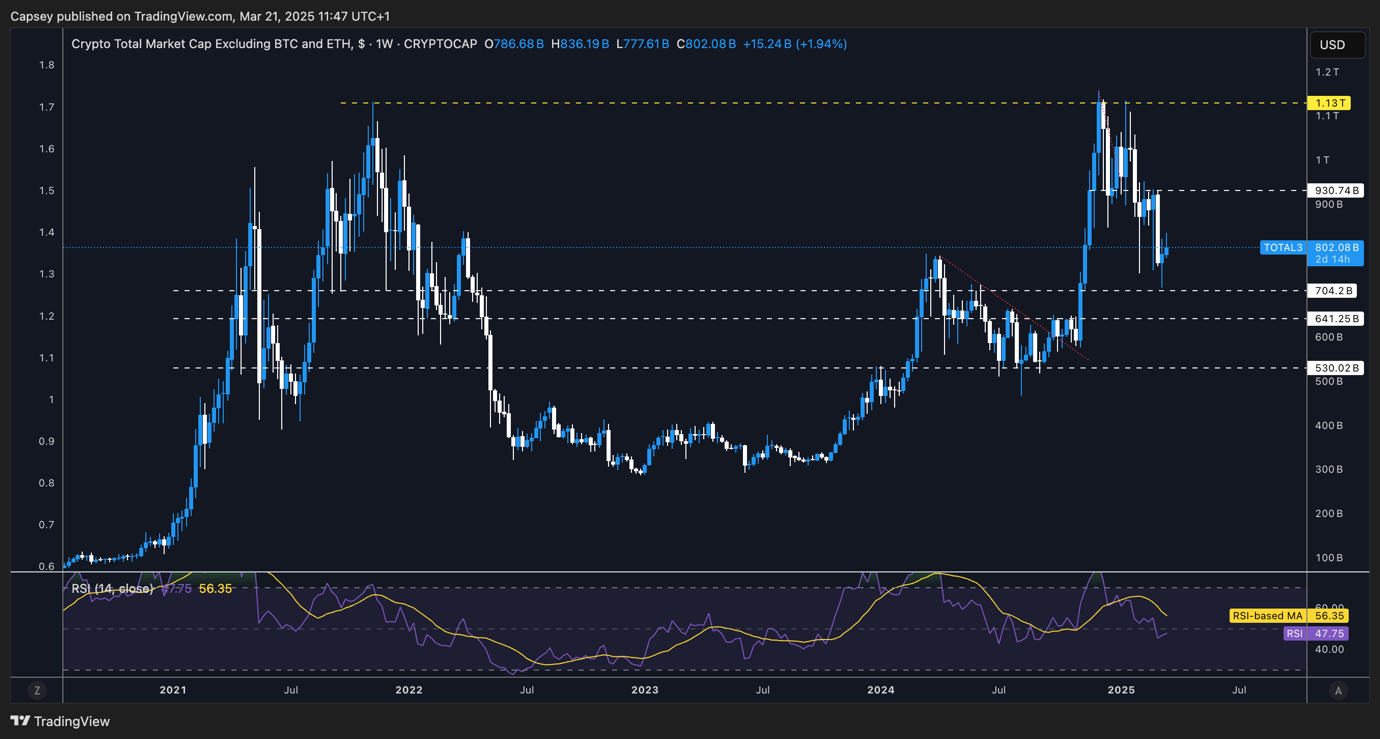
Cryptonary's take:
The market is currently seeing a relief rally, and even though peak fear might be behind us in the short and maybe even medium term, the outlook over Q2 and Q3 isn't favourable. Therefore, we remain of the view that risk assets will struggle in the upcoming months, and so we'd look to be sellers of rallies (assuming you haven't sold already), and we'd even look to Short these rallies should we be given attractive prices. This is the short and medium-term play. When we zoom out, we can see that we've had some real resetting on the sentiment charts, but the price charts (TOTAL3) hasn't had a meaningful reset, and it is holding a good structure. The TOTAL3 chart suggests more mid-term bull market rather than bear market. Ultimately, we still see big uncertainty and, therefore, more headwinds for risk assets (Crypto) in the short and medium term. We, therefore, remain in cash, but still with the thinking that we'll be looking to deploy that in Q2 or Q3 - probably Q3 at the absolute latest - as we don't see a recession as likely, and this just being a transitional period for the economy that'll take some time to adjust to. And in this process, you get the fear that sends risk assets lower. We're still of the view that this isn't anything more than this, but it might take more months to play out, and we're constantly assessing it. For BTC, our levels remain the same. We're looking to build a Short position between $86,300 and $91,000. We have had some of the Short orders already fill over the last few days. BTC 1D Chart: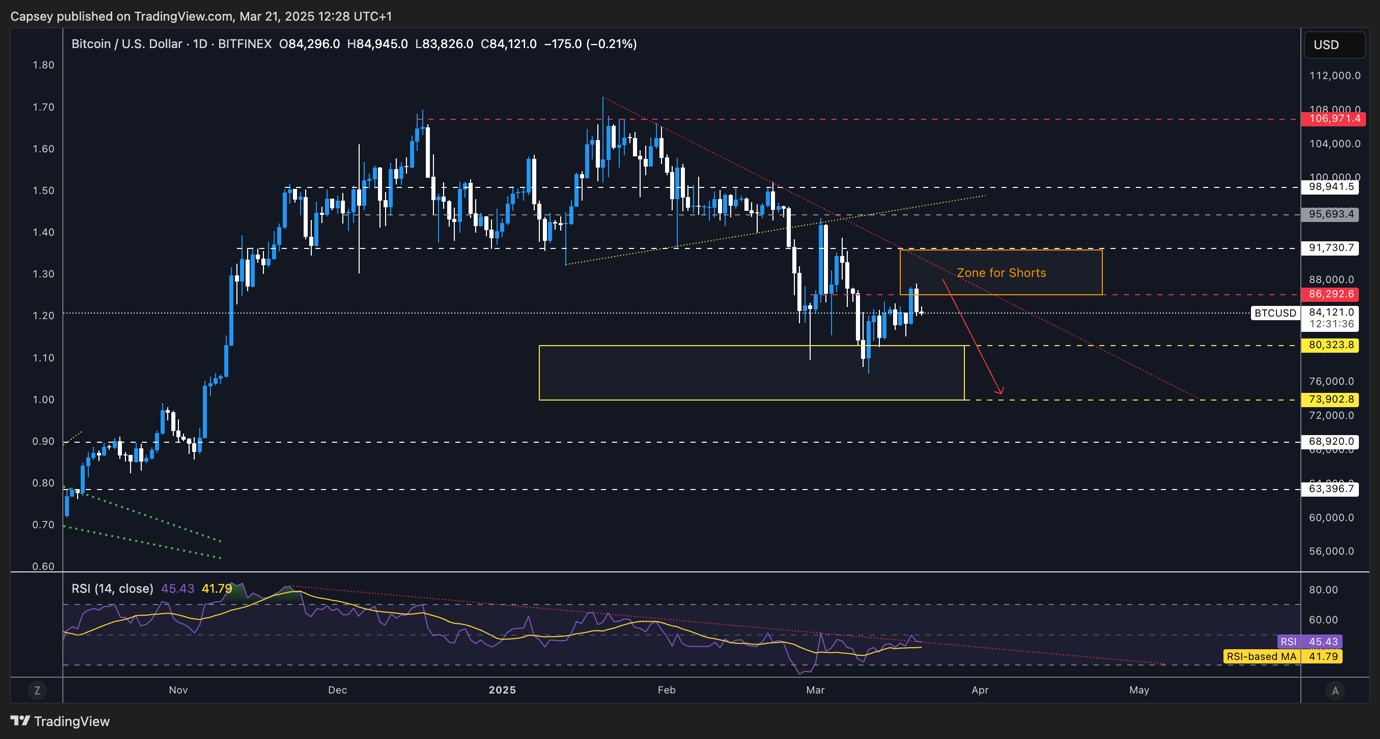
Recommended from Cryptonary

PRO
Market Updates
8 min read
Mar 23, 2026

PRO
Market Updates
9 min read
Mar 20, 2026
PRO
Market Updates
9 min read
Mar 16, 2026
