Save 23% ($351) & Get a Free 1-1 Call with our Team ⏰ : 0d 2h 59m 44s
Fed rate cuts: Impact on crypto, S&P500, and growth
Alongside this, Personal Spending and Personal Income both came in positively, with Personal Spending at 0.5% MoM, indicating that the consumer is still spending and at a relatively strong rate. If the consumer can keep up spending, growth can hold up. If we start to see companies laying workers off, this will see spending go down and growth slow, so, hence tracking the labour market is so pivotal as to whether the 'soft landing' will become reality.

Today's data
Today's data essentially came in at consensus. It showed that the FED's preferred inflation guage came in at 2.6% YoY, and at 0.2% MoM. This is in line with what the FED wants to see.The alternate view
An alternate view we're seeing is that the markets may struggle in the run up to the election for two key reasons:- Interest Rate cuts are usually bearish at the beginning.
- Uncertainty ahead of the election meaning businesses sit tight until after the election.
In response to this, the FED cuts Interest Rates to lower the cost of borrowing money (in order to make borrowing money cheaper, and therefore more attractive) to stimulate borrowing, and therefore growth again.
This is not what's happening this time. What's happening this time is that the Inflation rate is around the 2.5% mark, whilst FED Funds (the Interest Rate) is around 5.5%. So, the real rate (the Interest Rate minus the Inflation Rate) is 3.0%. A healthy economy is usually 1.0% restrictive.
Currently, we're 3.0% restrictive. So, the FED are planning to cut Interest Rates in order to bring down the level of restrictiveness. This should help to stimulate more growth whilst the economy (and hopefully also the labour market) are holding up.
This is bullish for risk assets. In the below chart, we can see what the performance of the S&P is over the 12 months following the first Interest Rate cut.
S&P500 return 12 months after first rate cut:

In answer to point 2. We have seen a shift recently from the markets focusing on Inflation to the Labour market. If the labour market significantly weakens, this would likely mean a recession, so the FED are due to begin cutting Interest Rates in an attempt to get ahead of this.
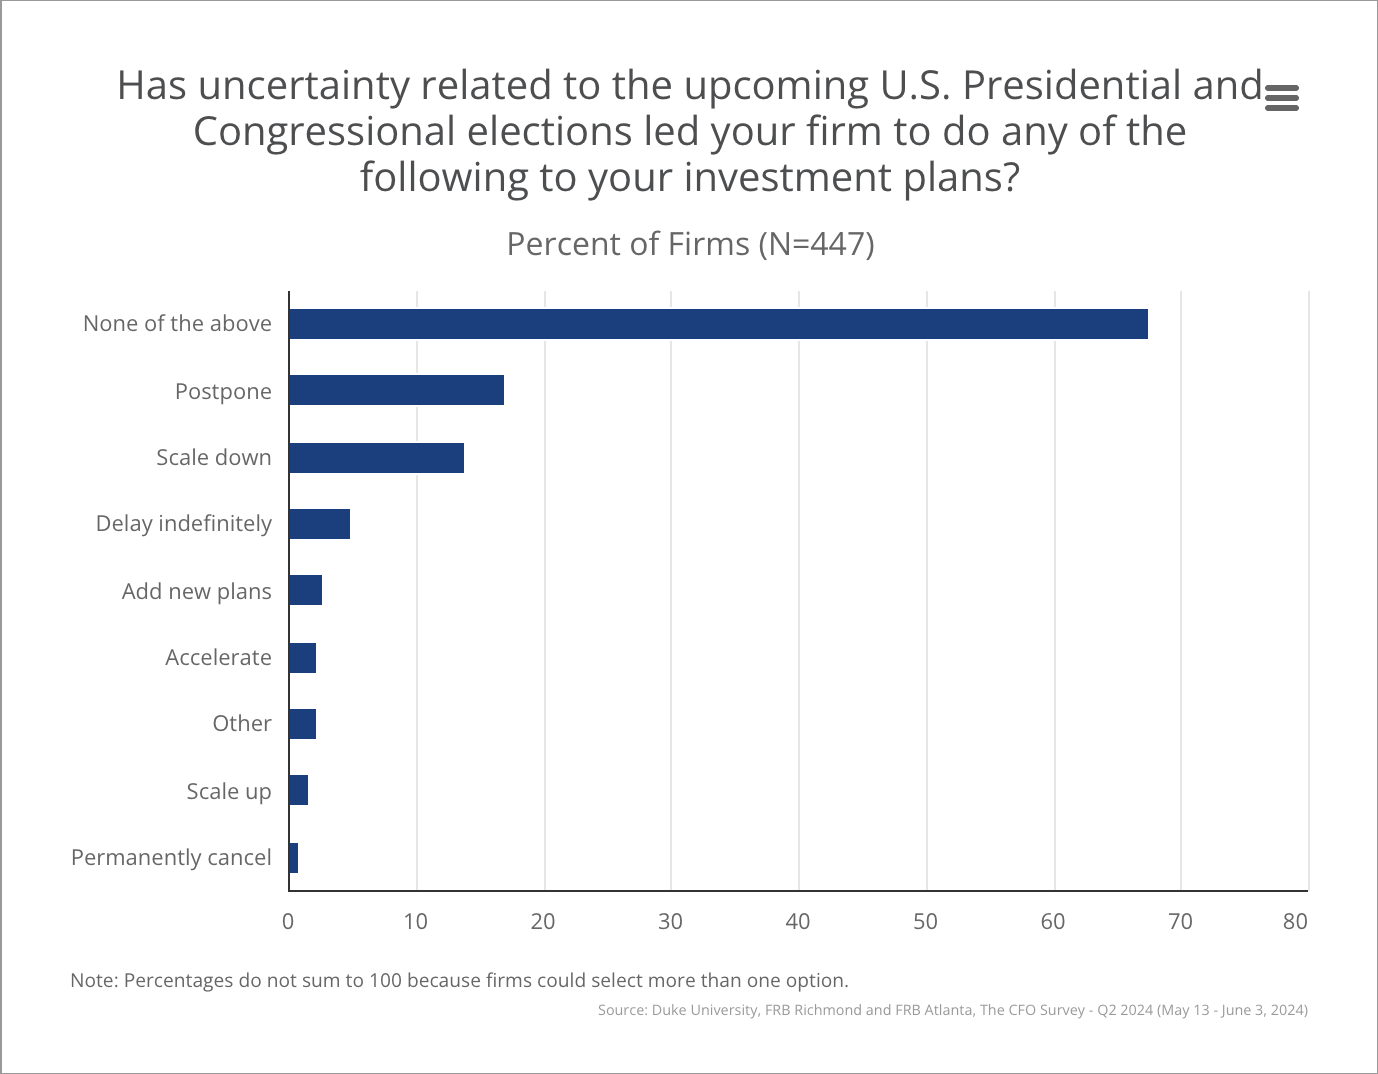
Whilst we expect the data to hold up over the coming months - growth to remain positive, and the labour market to remain ok, probably further weakening but not recessionary like weakening - growth may slow due to the political uncertainty ahead of the election. The Richmond FED Survey shows that a third of respondents looked to postpone, scale down or delay indefinitely business expansion plans due to the political uncertainty.
Disclaimer: This is not financial or investment advice. You are responsible for any capital-related decisions you make, and only you are accountable for the results.
This may result in markets and growth remaining range bound/continuing in just the slow grind higher between now and the election.
Cryptonary's take
It is certainly possible that the next month or two is tricky, particularly if there are further growth scares or more material weakening in the economy. However, when we assess the setup in front of us, we're seeing the following:- a series of interest rate cuts, but cuts to normalise/moderate policy (bullish for markets).
- global liquidity increasing with China also beginning to provide accommodative policy, enabled by the FED cutting rates (refer to image 1 below).
- consumer spending still strong, suggesting that the consumer is still holding up.
- on-chain data suggests we're mid cycle, perhaps something similar to mid/late 2019.
- we're currently 4 months post Bitcoin Halving, and historically it takes 6 months for prices to really begin running (refer to image 2 below- credit @therationalroot).
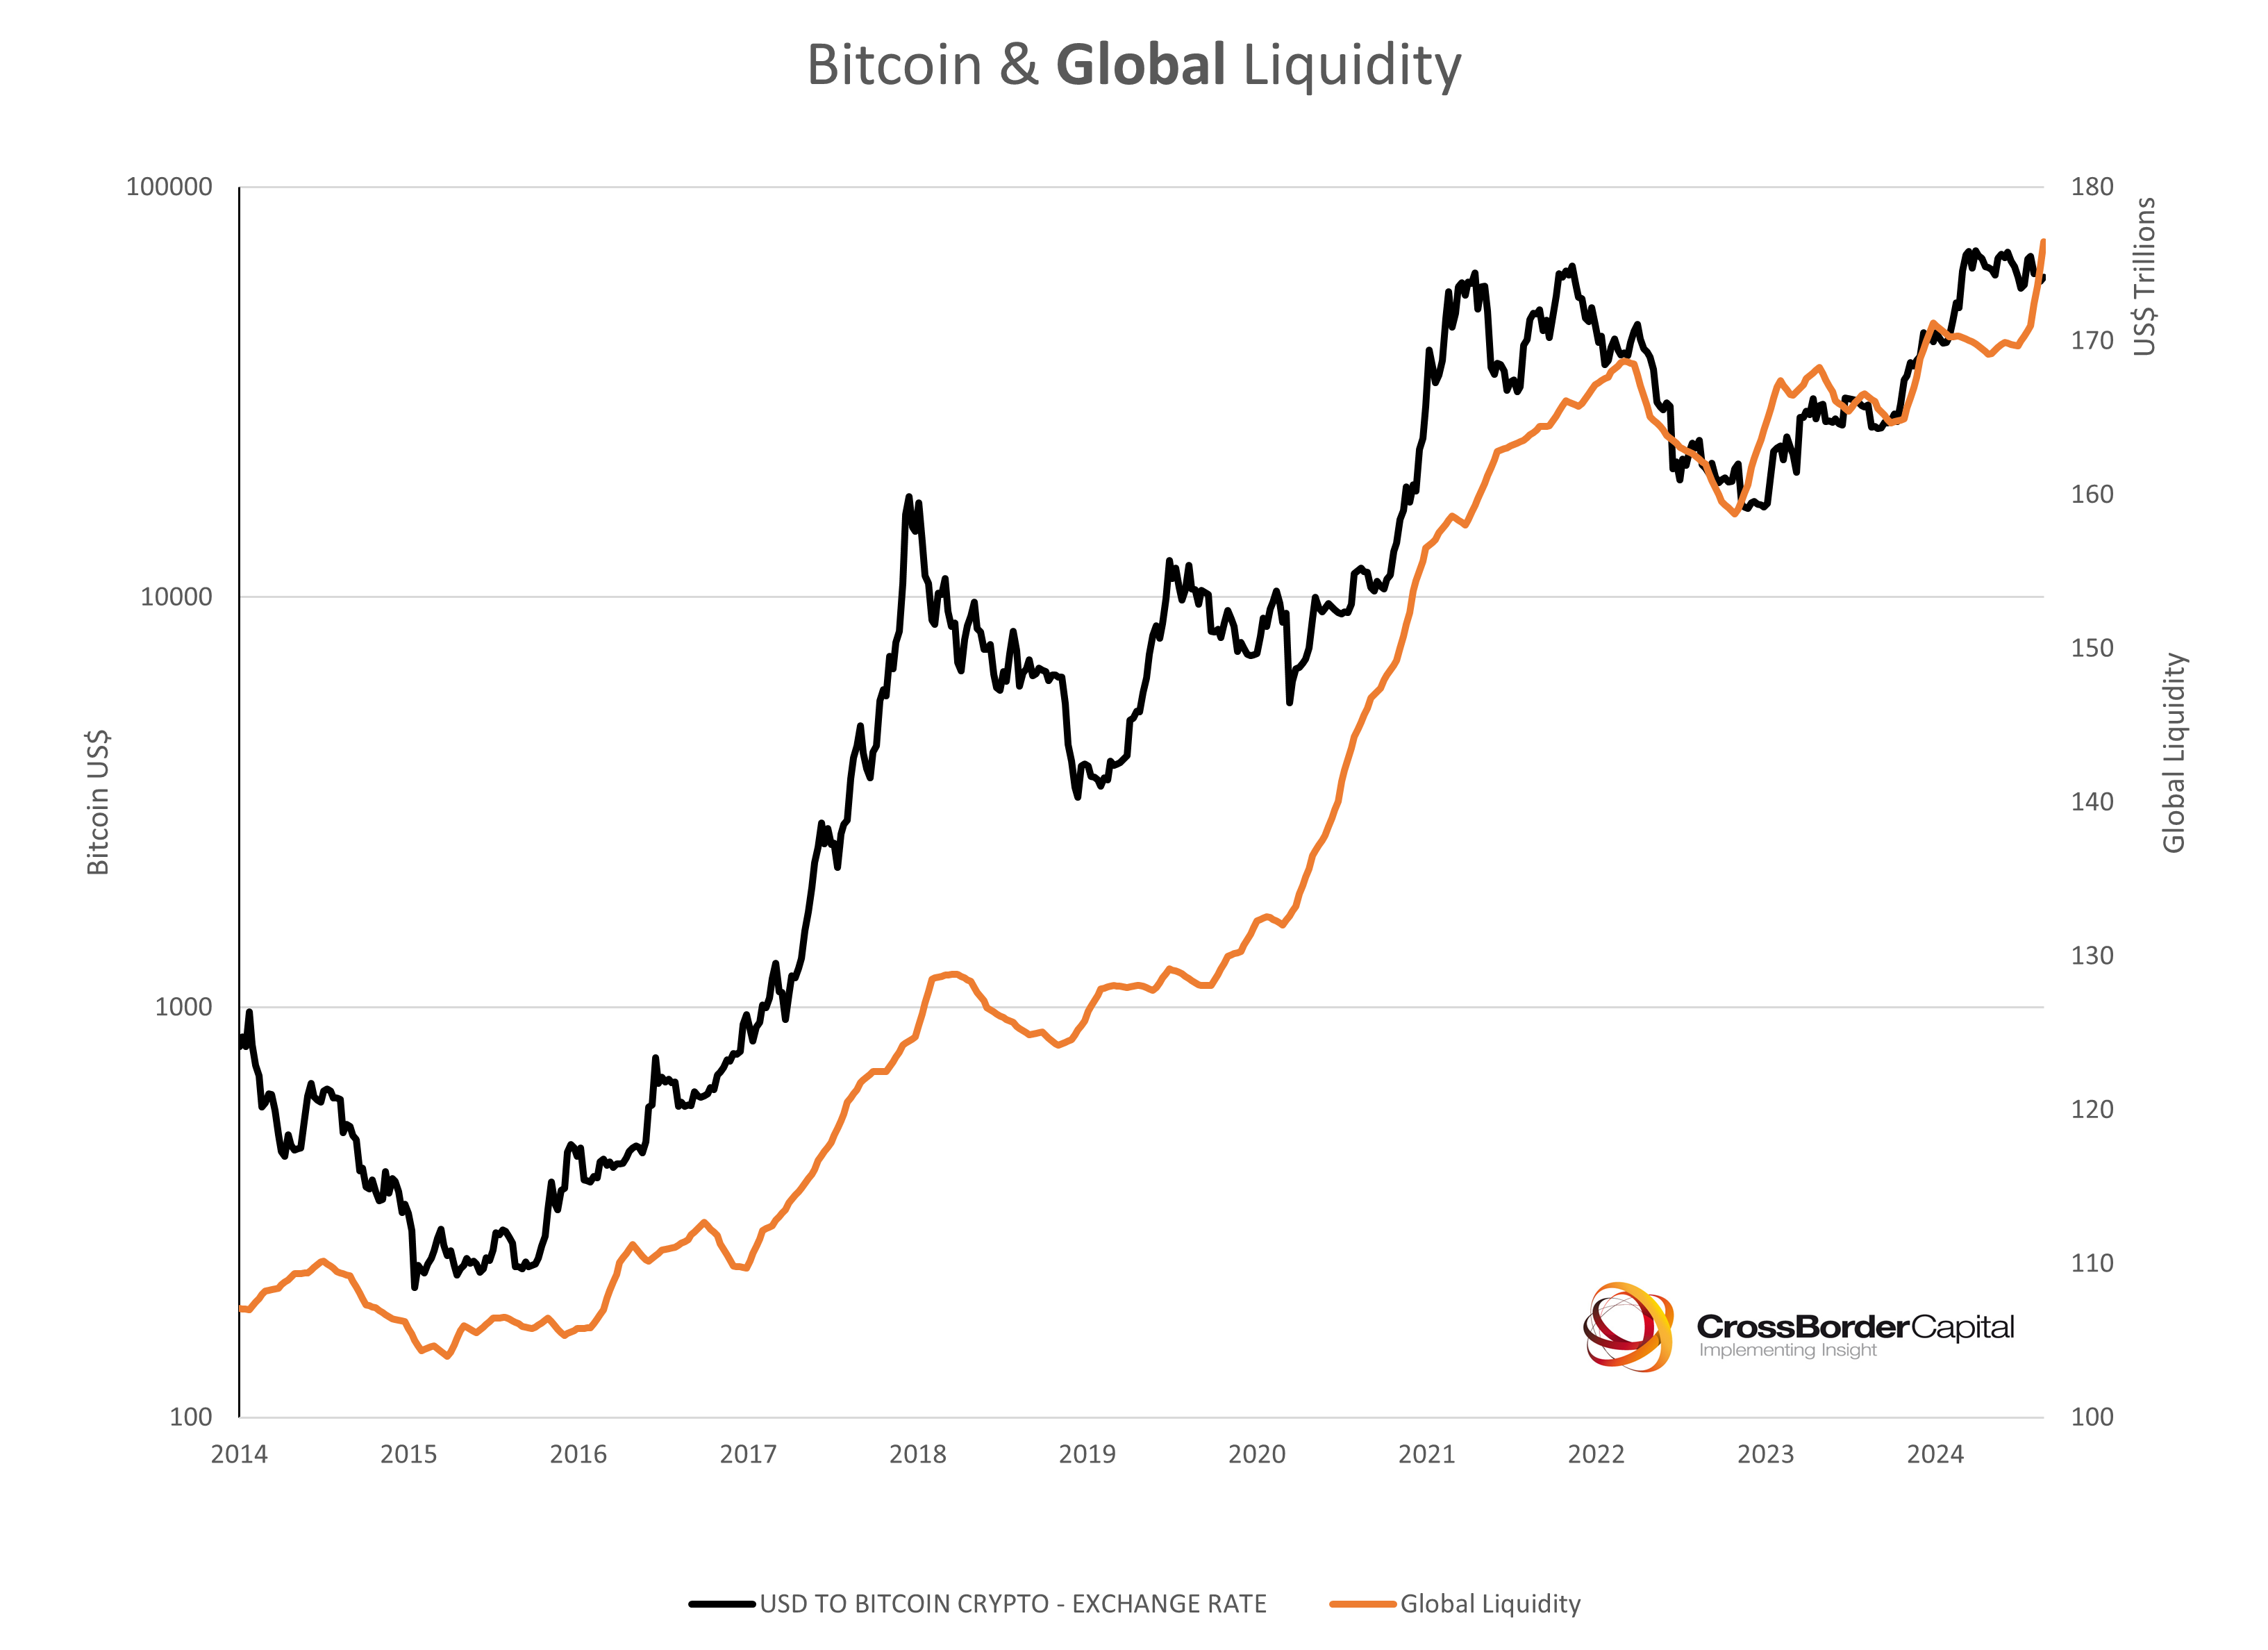 Image 2: Bitcoin price performance comparison from cycle bottom against timescale
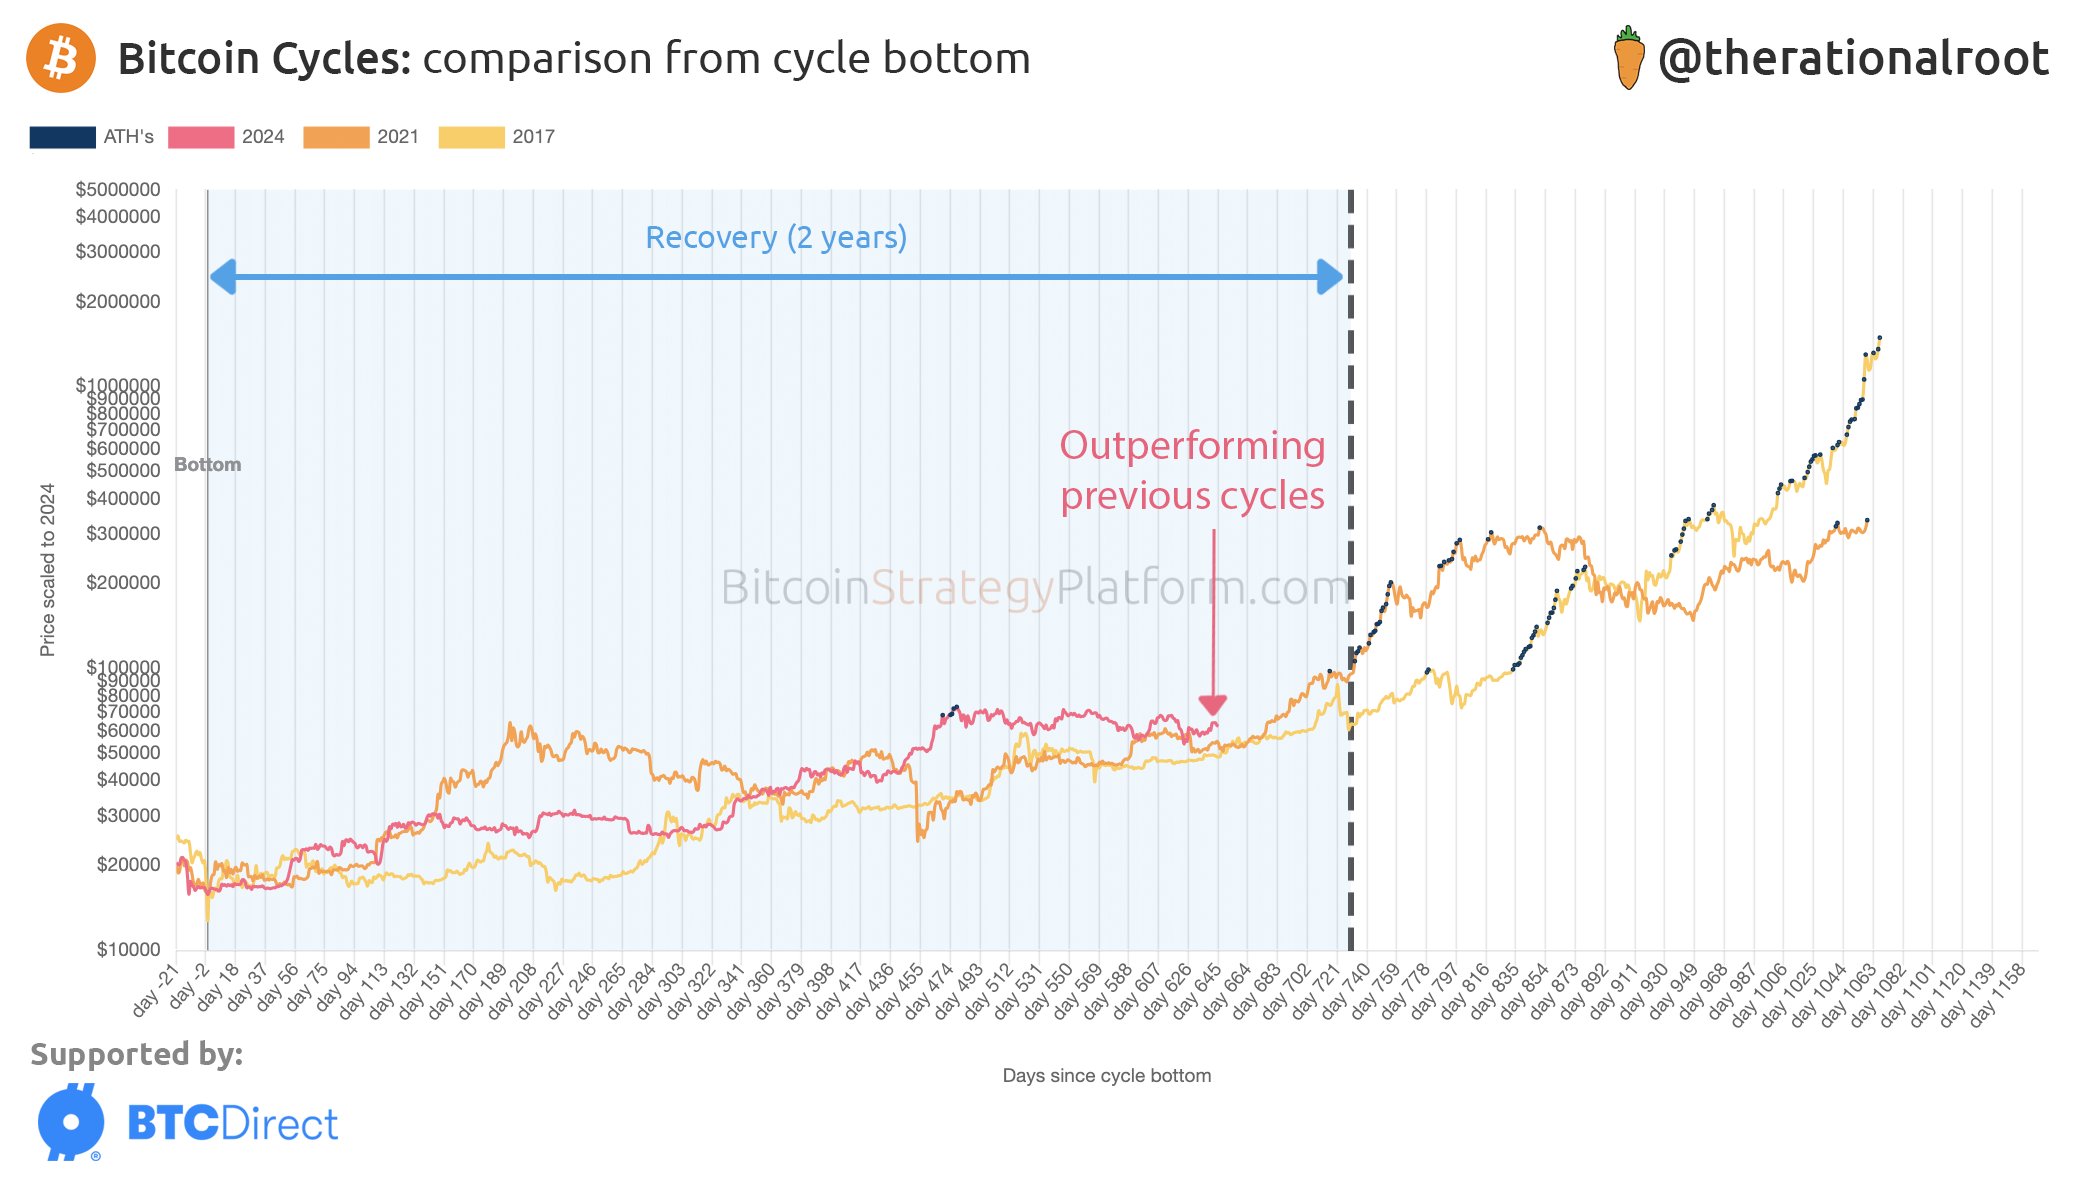
Ultimately, the market doesn't feel too great here in the immediate term but with there being many positive catalysts on the horizon, we still believe the best bet here is to be positioned.
We'd of course suggest not to be leveraged, but to be in Spot positions in a concentrated portfolio. For us, that still is the barbell strategy: BTC, ETH, SOL, WIF, and POPCAT. For now, it's still not the time to diversify in to more risk on plays.
Recommended from Cryptonary


