
In today’s market direction, we'll unpack the latest trends in Bitcoin, Ethereum, and Solana - revealing the hidden signals that could shape your trading strategy.
We’ve also added some educational parts to the market direction below to help explain the more complicated parts of the analysis.
This analysis should help you make sense of the noise on crypto Twitter and stay ahead of the curve.
Let's dive in!
Key questions
- Is Bitcoin's recent market reset a bearish sign or the setup for a healthy climb? Our Open-interest analysis reveals surprising insights.
- What do the twin bullish divergences in BTC's chart suggest about its short-term potential? The answer may shock you.
- Ethereum's on the move, but can it overcome a critical resistance level? We break down the key price points to watch.
- Are the upcoming ETH ETFs already priced in, or is there hidden upside potential? Our take might change your perspective.
- Solana's in a downtrend, but is a violent breakout on the horizon? Discover the crucial levels that could trigger a major move.
- Is there a "value territory" for SOL that smart money is eyeing? Our long-term analysis points to an unexpected price zone.
Disclaimer: This is not financial or investment advice. You are responsible for any capital-related decisions you make, and only you are accountable for the results. "One Glance" by Cryptonary sometimes uses the RR trading tool to help you quickly understand our analysis. These are not signals, and they are not financial advice.
BTC
- Bitcoin's Open Interest is down just under 30% from the highs, and so far, it hasn't bounced from the lows. This resetting suggests a healthier market that no longer has excesses.
- Bitcoin's Funding Rate has reset back to 0.01%, indicating that the reduction in Open Interest (leverage) has reset and rebalanced the market to a relatively even split between Longs and Shorts.
As prices go up, if Open Interest dramatically increases, more leverage is being piled on; this isn't healthy for markets to continue higher.
The more common result of this is that as price pulls back slightly, traders that are Long begin to panic and close out their position (once they see that they're in a bigger loss than they expected because they've used too much leverage). This then causes price to spiral lower, and hence, you then get these big leverage flushing out events.
However, for bull markets to continue, the market needs to be flushed out of the excess leverage, so these events are actually positive mid and long-term for the market. This is why we track this data.
Technical analysis
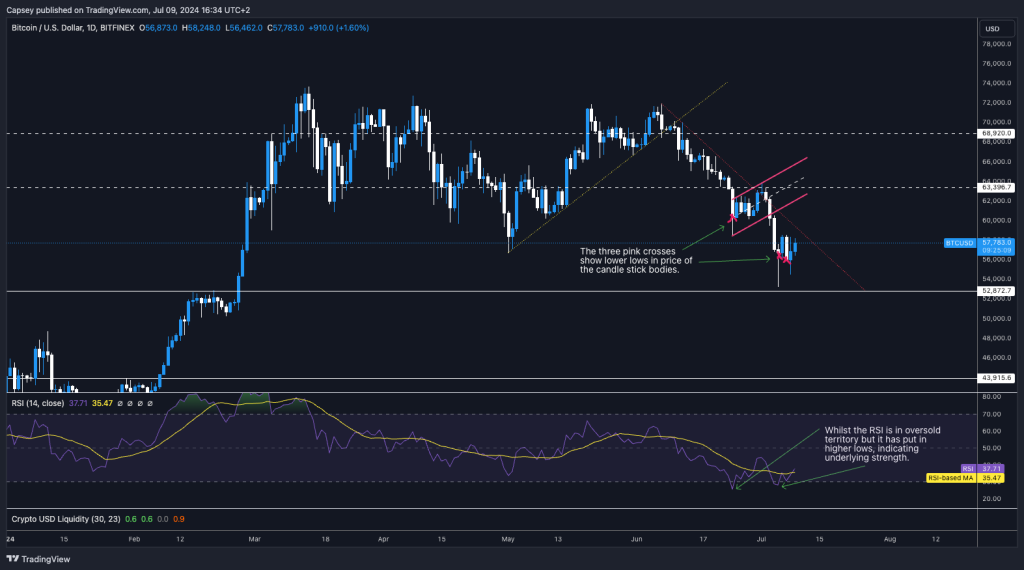
- Bitcoin found support at the horizontal level of $53k after price broke down from the bear flag.
- Price has now managed to hold a tighter range between $56,000 and $58,000, while 2 bullish divergences have formed in oversold territory. The last time this happened was August 2023, when it was at $26k. It took months to play out, but by November 1st, price was at $35k.
- To the upside, the $60,000 point is likely to act as a short-term resistance to price. Beyond this, $63,400 is the major horizontal resistance.
Cryptonary's take
We expect Bitcoin to remain range-bound but over a larger range for the coming months. In the short term, Bitcoin can bounce, potentially fuelled by the bullish divergences that have built up. This may help Bitcoin bounce, but we expect a potential bounce to be somewhat shallow, possibly stopping at the $60,000 or $63,400 resistance. We would be surprised to see Bitcoin climb back above $63,400 in the short term.ETH
- ETH's Open Interest is also down substantially from the highs in late May, and so far, we haven't seen it pile back on from the lows formed a few days ago.
- This means more than 25% of the leverage has been wiped out/reset, and the market has returned to a far healthier/less over-levered setup.
- The Funding Rate has also reset to 0.01%. This means Longs and Shorts are in even balance, and neither side is vulnerable to a squeeze. Again, a healthy resetting.
Technical analysis
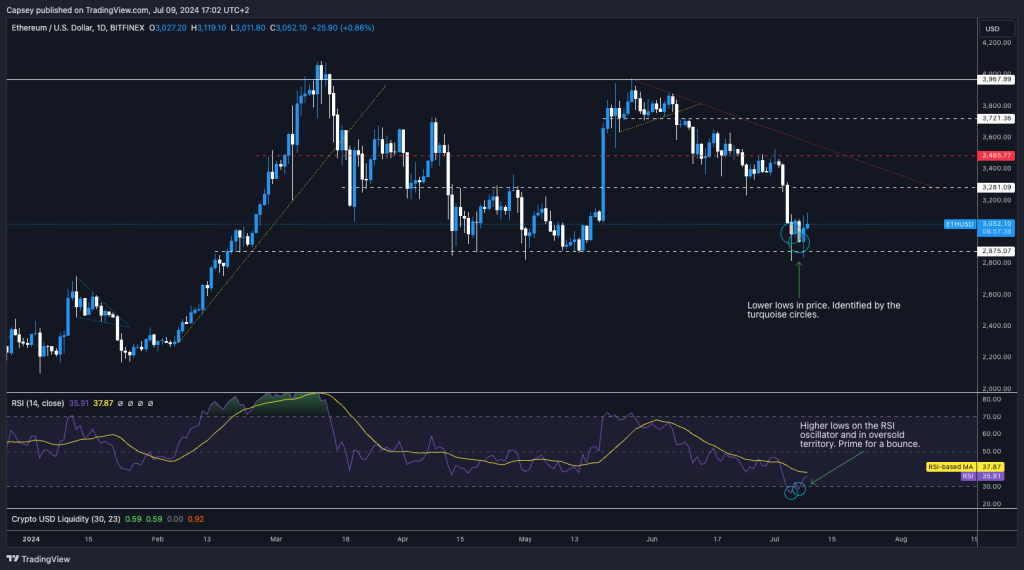
- ETH has found support at the major horizontal level of $2,875.
- Price has formed two bullish divergences and is in oversold territory. This is where price makes new lows (candle bodies), whilst the RSI oscillator makes higher lows. This should help fuel a relief bounce for price.
- To the upside, the prior horizontal support of $3,280 is likely to be new short-term resistance for price. Beyond that, the next resistance level is $3,485.
Cryptonary's take
Like Bitcoin, ETH is positioned well here.We have a resetting in leverage while price finds support at $2,875, forming a bullish divergence in oversold territory. Therefore, we see the right setup needed to help ETH bounce in the short term. However, we see the horizontal resistance of $3,280 as strong resistance that ETH may struggle to surpass, but again, just in the short term.
It's also likely that the ETH ETFs will be approved for trading next week or the following week. Currently, the sentiment and expectations on the ETH ETF performance are low, and that's likely priced into the market here. This does give room for ETH to outperform, particularly if we see some relatively big inflows in the first trading week.
SOL
- Like BTC and ETH, SOL's Open Interest (amount of leverage) is substantially lower than the highs in late March. Open Interest was $2.86b and is now at $1.79b. This is a meaningful resetting, and the excesses have been wiped out. This is now a healthier backdrop for SOL.
- The Funding Rate, however, is at 0.0027%, indicating that there is a desire for traders to be Short SOL. This is currently not at an unhealthy level, so Shorts are not currently vulnerable to a squeeze.
Technical analysis
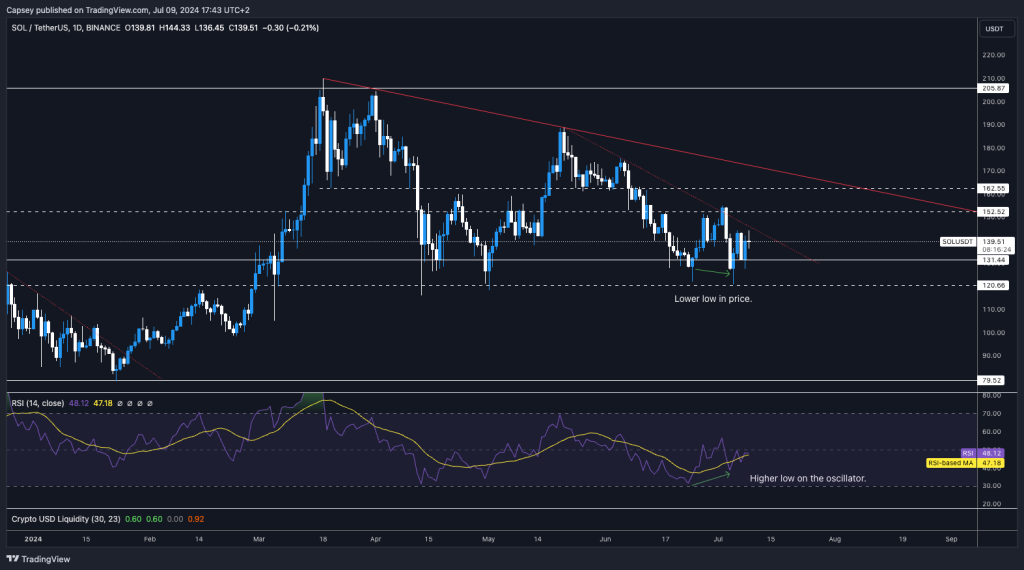
- SOL is in a longer-term downtrend, meaning upside momentum will be difficult unless it can reclaim some key levels.
- To the upside, the key resistance levels that SOL would need to climb back above are $152 and $162.
- A short-term breakout of the local downtrend line could help SOL reach and retest $152.
- On the downside, SOL has bounced several times from the major support zone between $120 and $131.
- $120 and below is value territory for SOL, and we'd look to add more aggressively at those levels for the long term.
- SOL has formed a bullish divergence but not in oversold territory, making the pattern much less reliable in terms of a bullish outcome/result. This is shown on the chart below.
Cryptonary's take
SOL is still in this larger range, and we expect a violent breakout in months to come. But this will come with a move above $162 and a break above the main downtrend line (thicker red line in the chart). Then, that'll push price onto that $180-$200 zone, which is the major breakout level. Beyond that, you're looking at targets between $300 and $400.However, in the short term, we may still see SOL come under pressure, even if the price breaks below $120. If this were to happen, we'd be strong buyers of SOL sub $120, where we'd look to hold Spot SOL for 6-12 months and sell it well north of $400. But in the meantime, we're patient and not over-trading but adding on and off when SOL reaches value territory.
