Save 23% ($351) & Get a Free 1-1 Call with our Team ⏰ : 0d 2h 59m 43s

Since our last monthly market update report, there have been several changes in the data that move the market and, unsurprisingly, the market.
In this monthly report, we'll analyse the macroeconomic forces at play to understand where crypto prices may be headed. We’ll cover everything from GDP growth to job openings to yield curve inversions.
Yes, it’s dense finance speak - but understanding these forces is crucial to navigating crypto's volatility and opportunity.
The focus of this report is to look at the major positive catalysts that would drive a bull run for crypto and the risks that could drag crypto down – both from the macro viewpoint.We’ll assess the likelihood of whether the positive catalysts or the risks play out, when they may play out and then how we should position in expectation of all this going forward. And more importantly, we guide you on how you should position your portfolio to win BIG!
Let’s dive in!
Key takeaways
- The Fed may delay the recession, providing just the right macro environment for the crypto rally to kick off in full swing.
- Treasury may continue making moves that will keep risk assets like crypto afloat despite quantitative tightening.
- Major catalysts are lining up for crypto: expect a surge in institutional investment inflows.
- Now is a great time to increase crypto exposure; don't miss the boat that lifts Bitcoin to new all-time highs.
- Expect Bitcoin to reach $145K by 2025.
Disclaimer: Not financial or investment advice. You are responsible for any capital-related decisions you make, and only you are accountable for the results. “One Glance” by Cryptonary sometimes uses the RR trading tool to help you quickly understand our analysis. They are not signals, and they are not financial advice.
Economic data coming stronger than expected
In our last report, we outlined how much of the economic data was beginning to show signs of weakness – this was and still is the case. Now, the weakness in some of the key data points is usually an indicator that precedes a recession. Yet, some of the data has now come in surprisingly strong.GDP growth rate
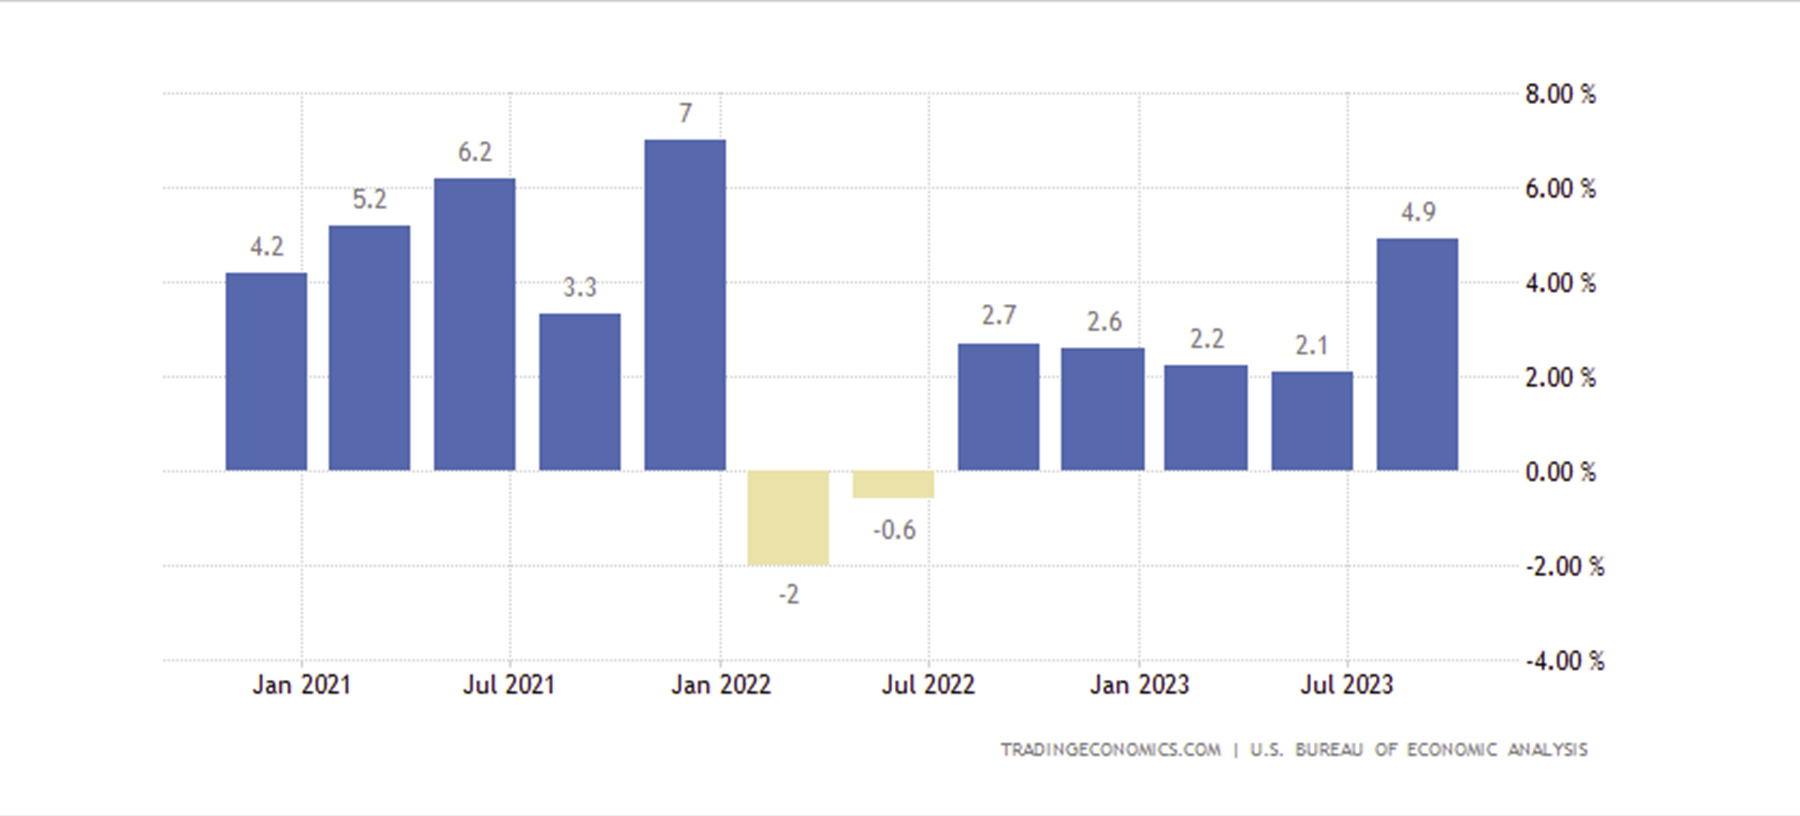
Firstly, the Q3 GDP growth rate was reported at 4.9%, far more than the 4.0% consensus and the 2.1% reported in Q2.U.S. GDP Q3
Retail sales and personal spending
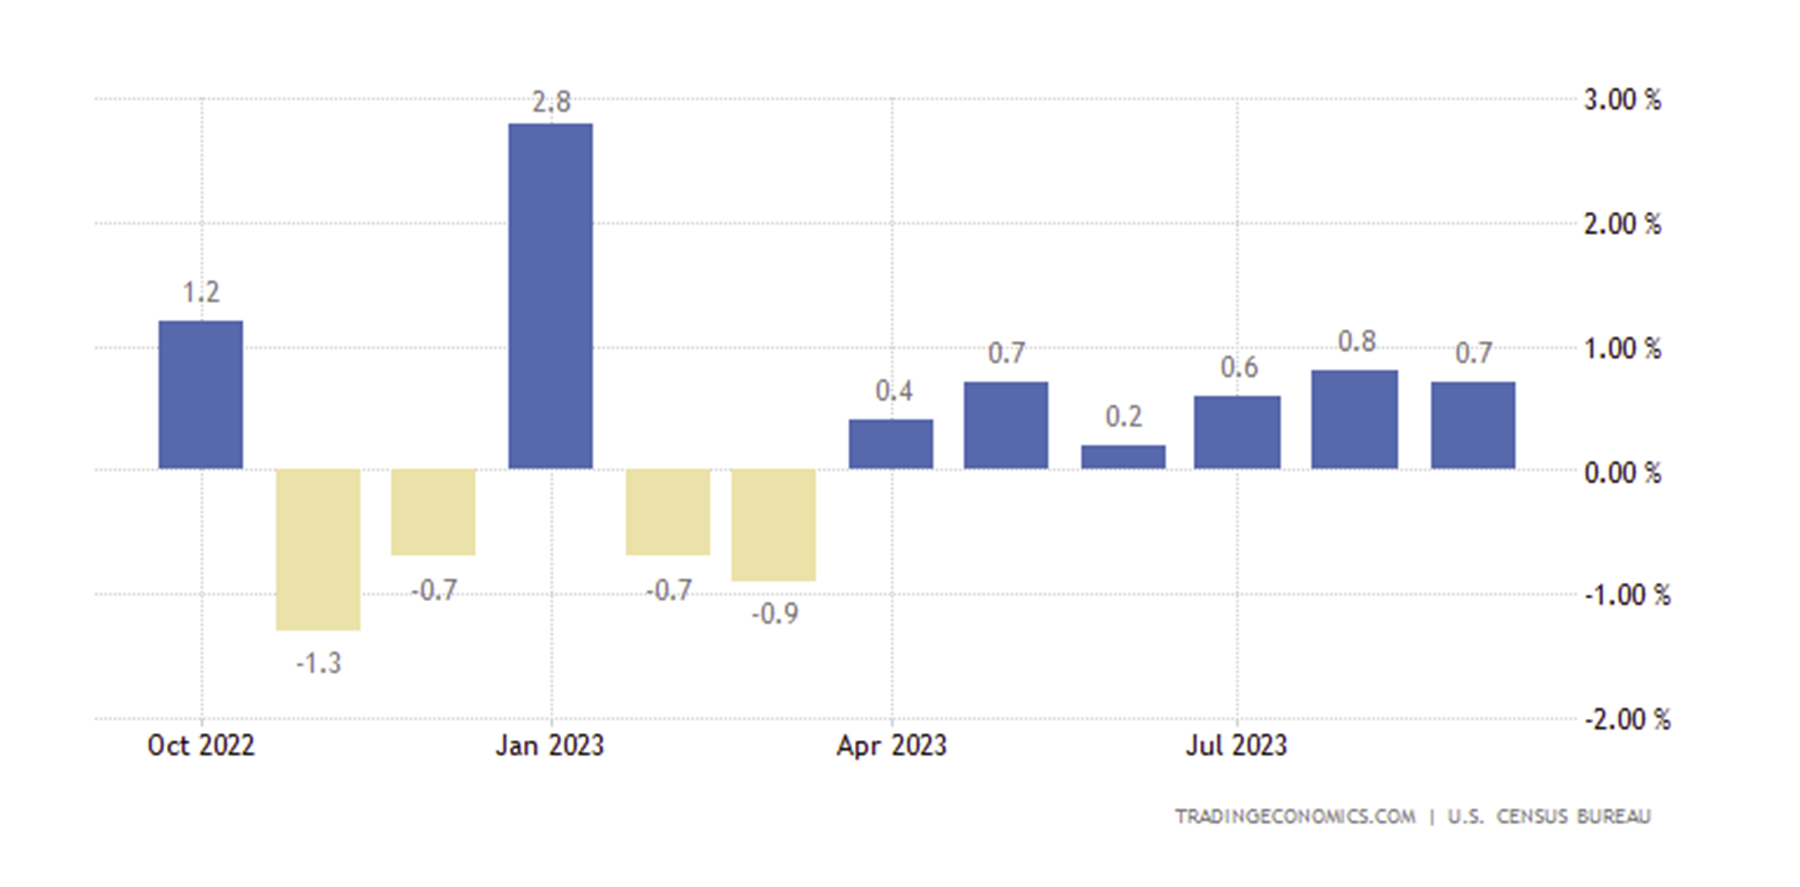
Additionally, retail sales and personal spending in the US have stayed high due to robust personal income.U.S. retail sales month-on-month
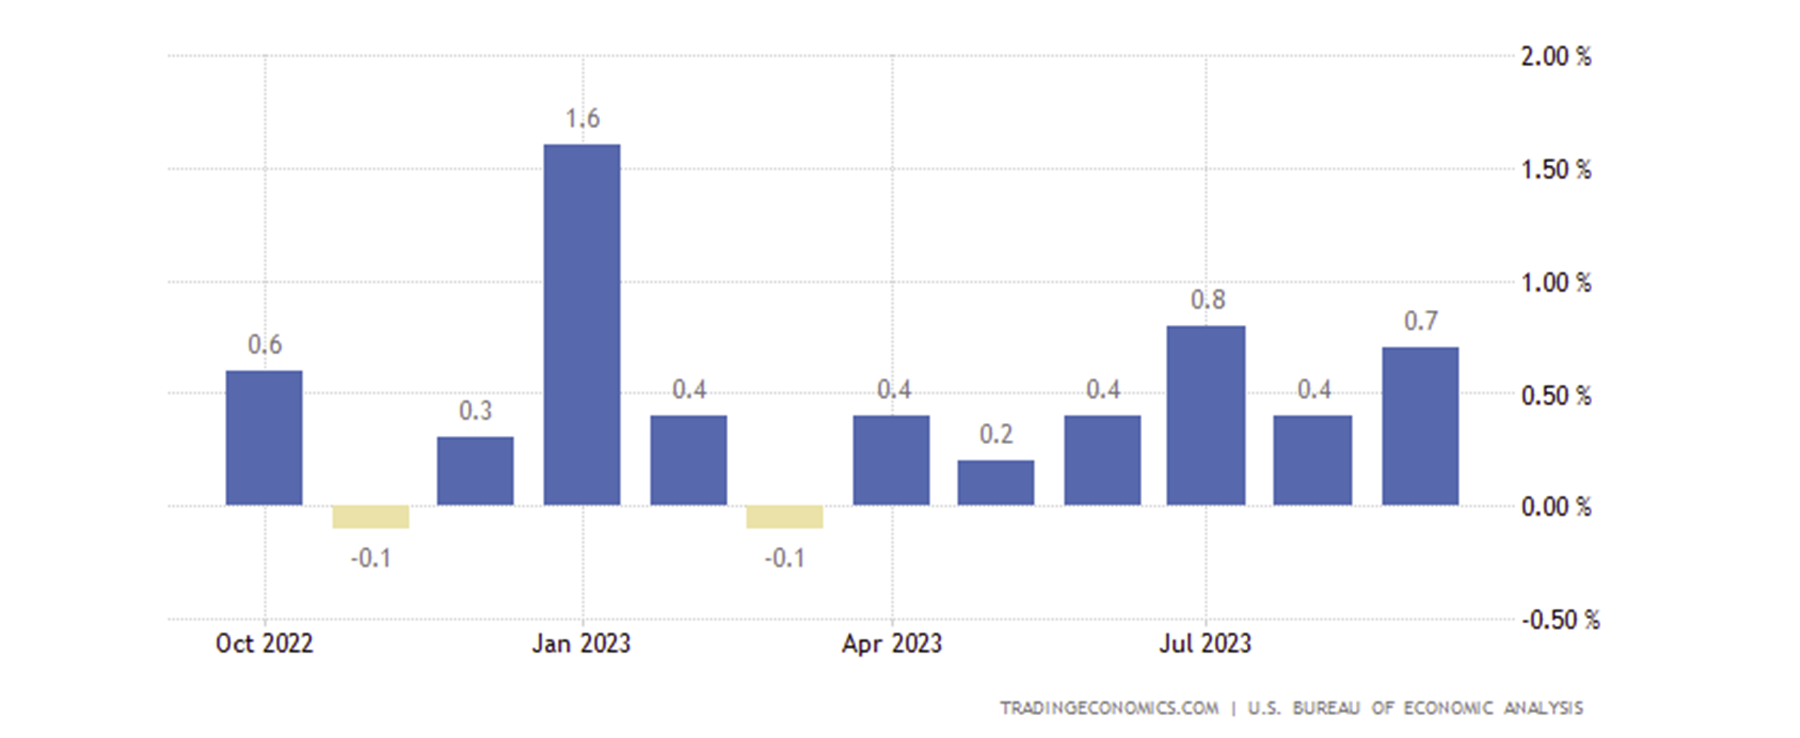
Personal spending in the U.S. month-on-month.
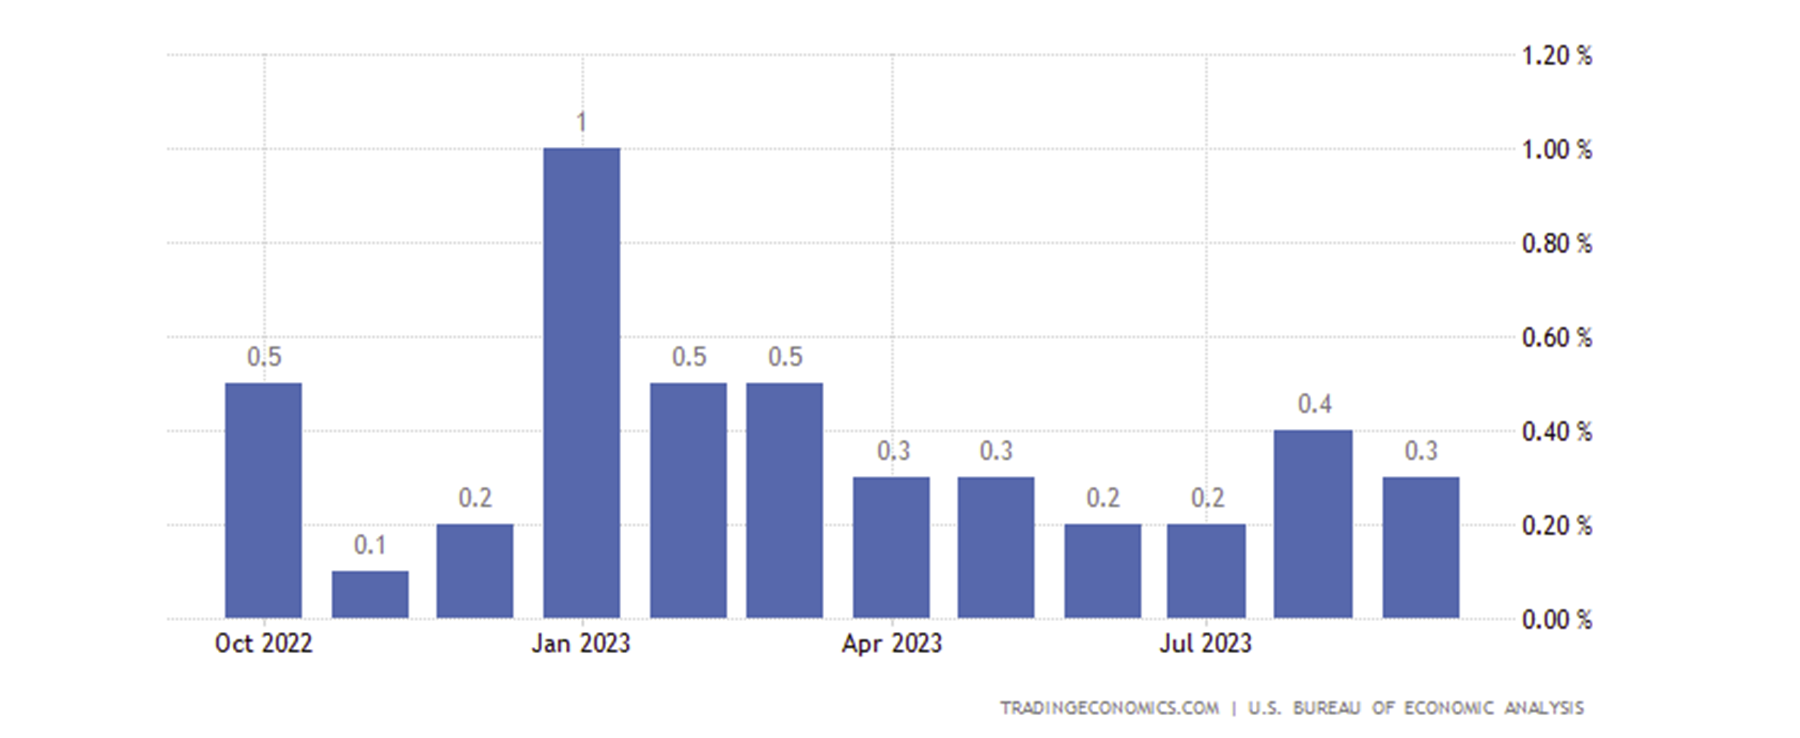
Personal income in the U.S. month-on-month
Despite growth surprising to the upside this quarter, inflation trending lower (although wages remain very sticky), and the labour market still hanging in there, there are some indications that a recession may come in the coming quarters – potentially Q2/Q3 2024.
The first of these indications is the forward guidance from companies during this earnings season. Many companies posted good earnings (but not greater than historical averages), and the revenues were not as strong as expected.
Alongside this, the companies’ forward guidance suggested that they expect a weaker consumer in the coming quarters. These saw analysts revising their expectations for upcoming quarters lower.
Is a weakening consumer showing up in the data? The quick answer is “to some degree”.
Job openings data
The first data point we can assess is the JOLT’s job openings. JOLTs, is the number of Job Openings in the U.S., i.e., are employers looking to take on more staff? A material decline in this data point usually precedes a recession.JOLT’s job openings - 25-year chart
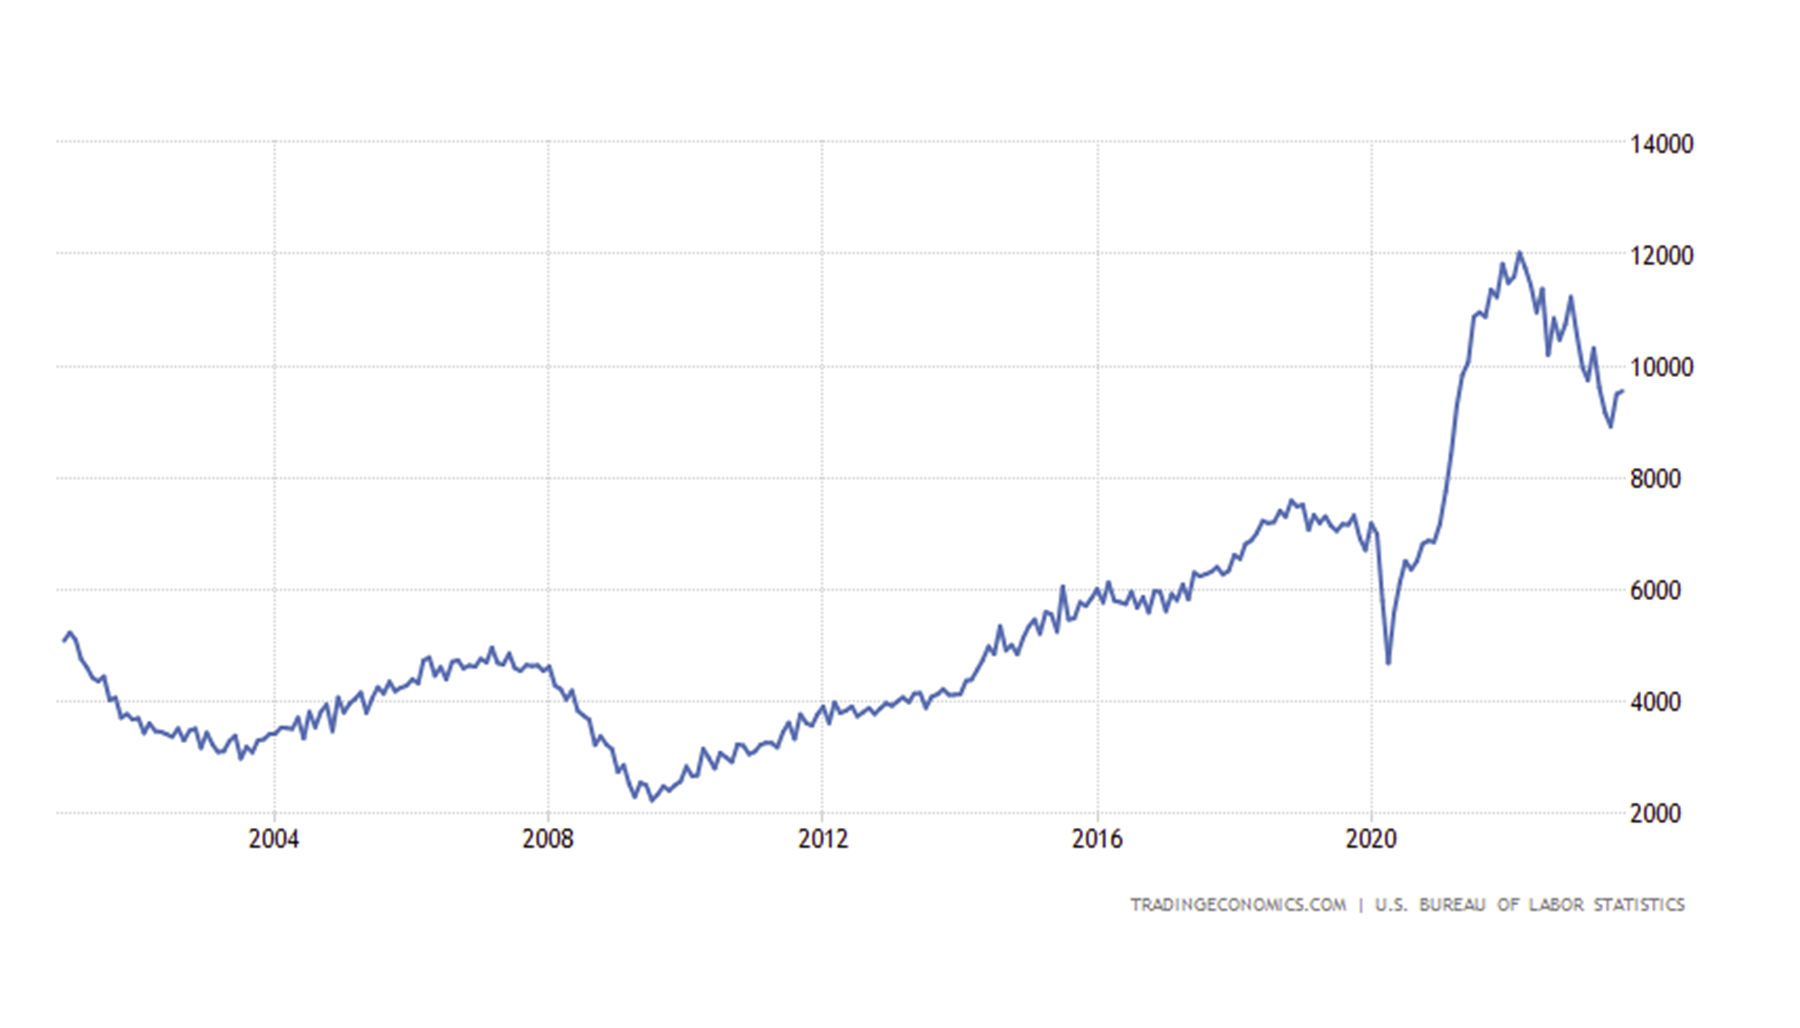
The chart above shows a decline in the number of job openings over the past year. However, the last two months’ data has shown job openings at 9.497M and 9.553M, coming in above expectations and, therefore, still holding up for now.
But this doesn’t take away from the more significant downtrend we’ve seen in this data point over the past 12 months. Note, in the above chart, the last two times this data point significantly declined was in 2008 and the inception of Covid (2020). Of course, the Fed stimulated the economy in 2020, so we avoided the recession that should have followed that weakening jobs data.
JOLT’s job openings – 1-year chart
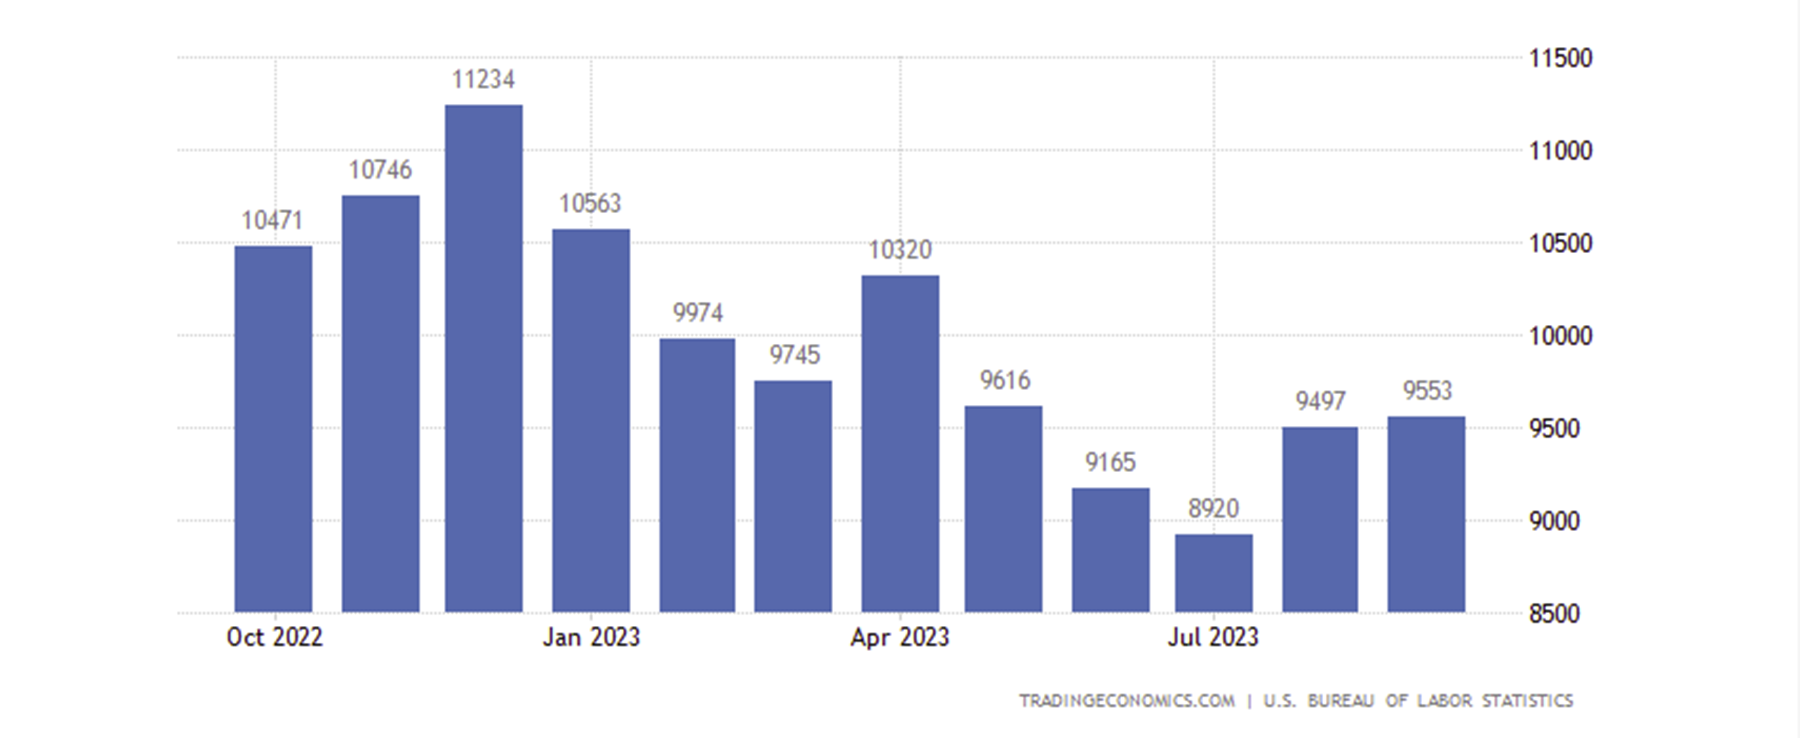
But back to the point. The data point from the job openings seems to be holding up for now (based on the last two months’ upside surprise prints). However, when this data point begins to put in back-to-back meaningful downside surprises, the markets will likely react negatively.
The reason is that the weakening job data essentially suggests that employers are pulling back from hiring. Less hiring is then usually followed by increased layoffs, which results in less consumer spending. This, in turn, means that corporate revenues will take a hit, resulting in corporates needing to lay off more staff to maintain margins, etc. And now, you you get the point.
Non-farm payrolls and unemployment rate
Another data point is non-farm payrolls (the number of jobs added in the US). The most recent reading was for 150k jobs added in October (well below estimates), with the prior months’ data being consistently revised lower. We also saw the unemployment rate in the U.S. ticked up to 3.9% - trending higher.U.S. non-farm payrolls

U.S. unemployment rate
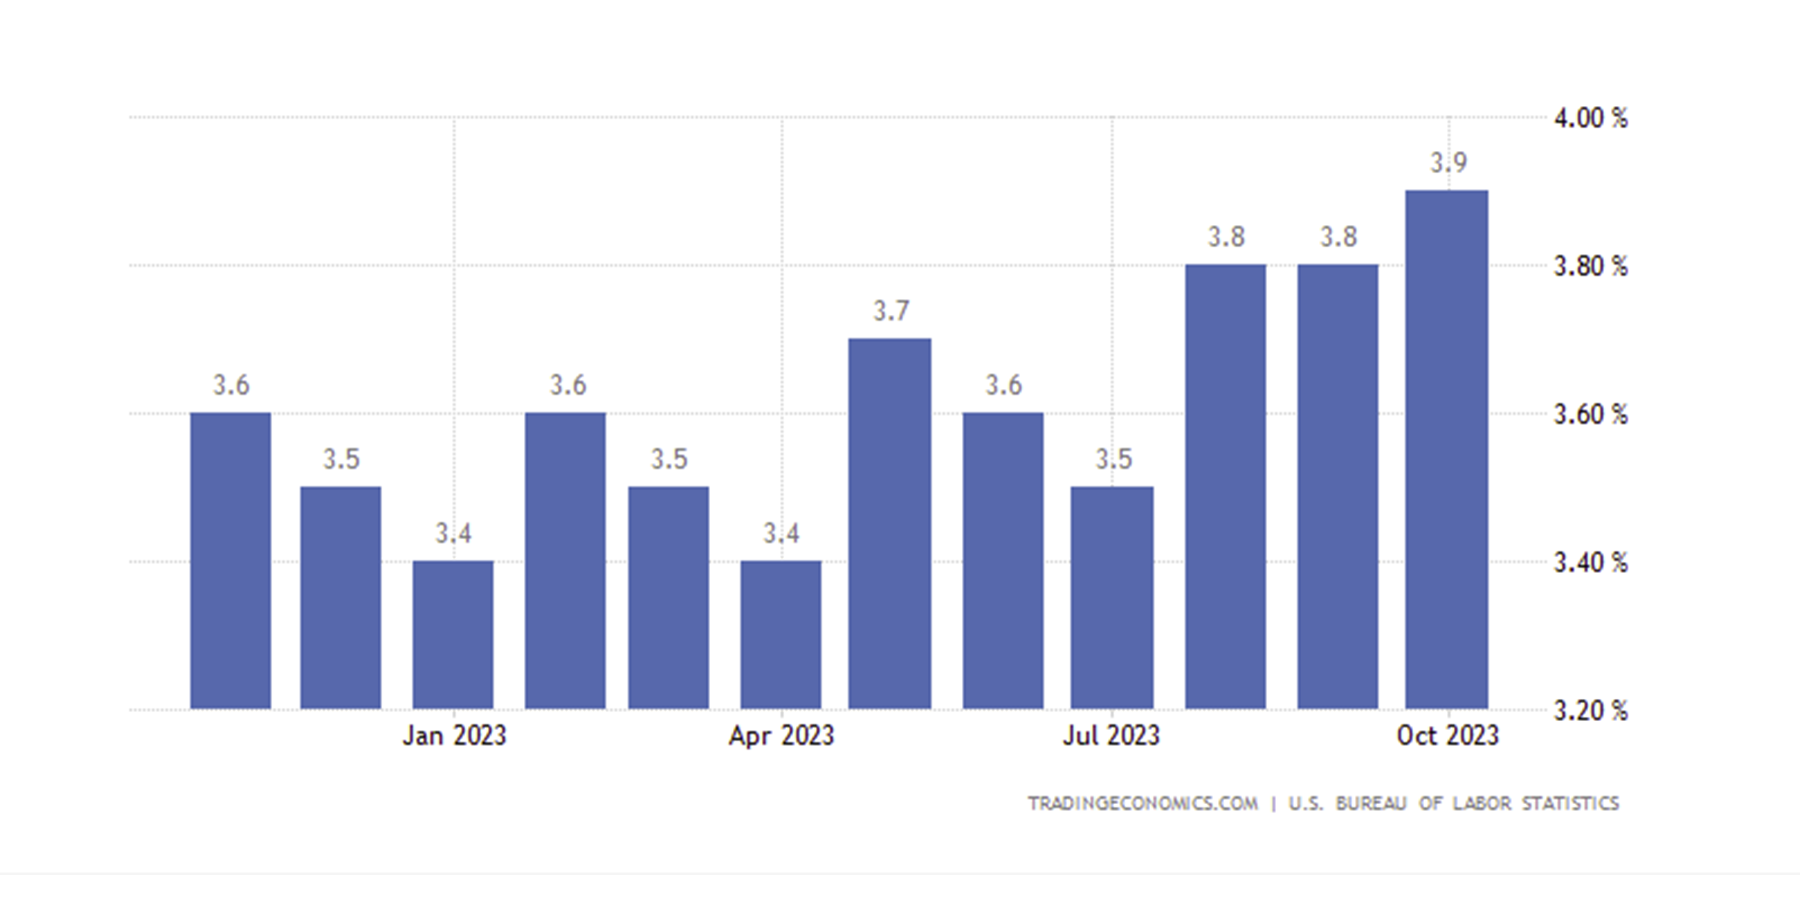
Bringing it all home, the data tells us that job creation is slowing while the unemployment rate is creeping up.
Granted, the data is not falling off a cliff, but it is certainly declining and suggesting that a slowdown in the U.S. economy is coming. Now, here’s the thing. In prior downturns in the U.S. economy, jobs data usually starts with a slow decline before suddenly taking larger dips. So, it’s possible that we are currently seeing those initial declines before a falling off the cliff comes in the coming quarter or two.
The inverted yield curve
The last forward-looking recession indicator we’ll cover is the inverted yield curve. An inverted yield curve shows that long-term rates are less than short-term interest rates. It reflects the expectation of bond investors for a decline in long-term interest rates due to pricing in a recession.The common theory is that the Yield curve inverts, i.e., short-term interest rates go up and long-term interest rates go down, and then investors expect a recession to occur as the yield curve inverts. However, the recession usually comes when the yield curve dis-inverts, i.e., when long-term rates go back above the short-term interest rates.
Note the grey in the chart below. We usually measure the U.S. 10Y bond yield against the U.S. 2Y bond yield.
The current yield curve looks as follows: below is the 10-2-year treasury yield spread.
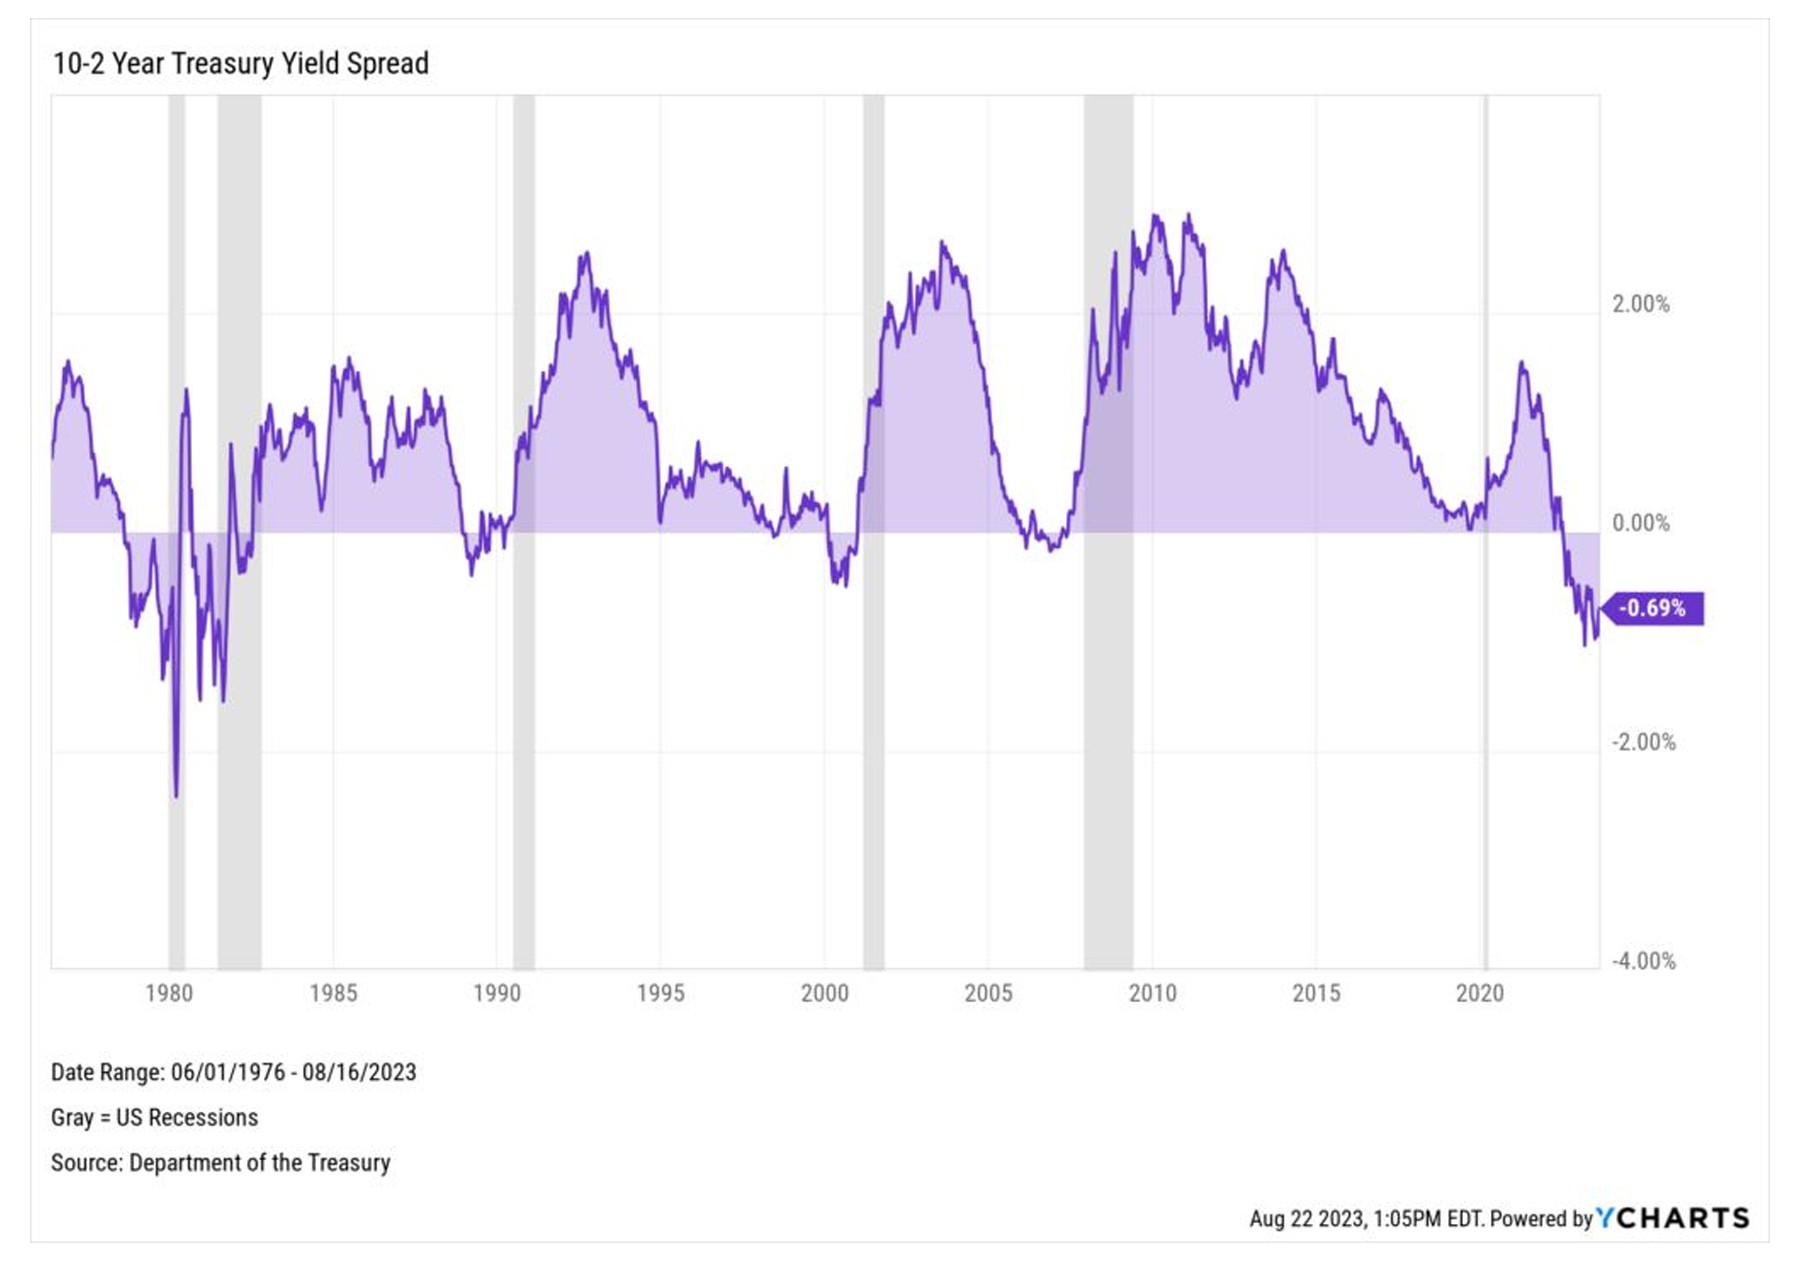
Let’s look at the above in a 3-year timeframe.
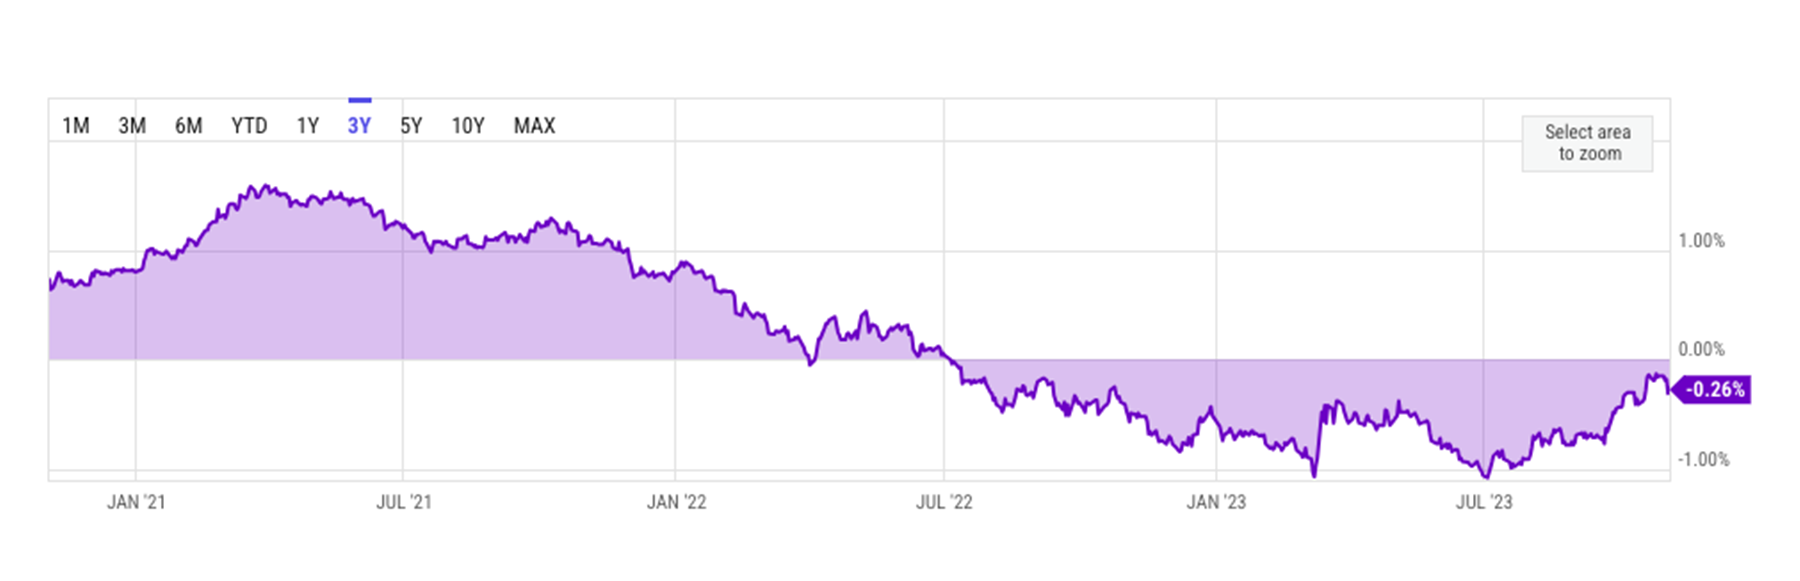
In the above, we can see how the yield curve is inverted and was moving back up, flattening/uninverting – the yield of the U.S. 10Y coming back to parity with the yield of the U.S. 2Y.
However, the way the curve has been moving to uninvert is not positive as it’s been due to long-term rates going up (U.S. 10Y yield going higher) rather than short-term rates going lower (U.S. 2Y yield going lower). The effect of this is that the cost of capital increases, negatively impacting businesses and consumers. Hence, we have mortgage rates at 8%. So, seeing the yield curve uninvert is a big recessionary indicator. Therefore, the Fed would likely not want the yield curve to uninvert but to stay inverted for the time being. This is essentially pushing a recession down the road or trying to push it out due to the next U.S. Presidential election in November 2024.
Janet Yellen and the treasury
Last Wednesday (01/11/23), the U.S. Treasury released its Quarterly Refunding Announcement. The treasury increased its planned sales for longer-term securities by slightly less than most major dealers expected in its quarterly debt-issuance plan, helping to spur a rally in those treasuries. Treasury also upped coupon auction size to $348B in Q1 vs. $338B in Q4. This was below their own guidance of $396 - $460B.Recently, U.S. 10Y and U.S. 30Y Bond auctions have been weak. Yellen puts this weakness down to increased issuance, but it’s somewhat just as likely due to a worsening fiscal deficit in the U.S,. with traders beginning to price this in.
Pushing out the recession?
However, less issuance and Powell's not addressing a rate hike in December’s meeting spurred the bond market to get a massive bid. This is particularly true for the U.S. 10Y Bond – the massive bid sent yields lower by 40 or so basis points. The U.S. 2Y Bond fell by approximately 25 basis points.However, the result was that the spread between the U.S. 10Y and the U.S. 2Y went from -16 basis points to -27 basis points. It was essentially inverting the yield curve further and undoing some of the uninverting that had been done.
We saw from our first graph above that recessions usually come when the yield curve goes from inverted to uninverted – the U.S. 10Y yield goes north of the U.S. 2Y yield. This is potentially an attempt by the Treasury/Yellen to push a recession further out and beyond the next presidential election in November 2024.
What makes all these macro data meaningful for crypto?
In short, the market pricing in a recession would likely bring the value of risk assets down significantly. But, if the Fed and Treasury are potentially pushing the recession well into the second half of 2024, risk assets could still perform well in the coming quarters.Note: Crypto has been trading with a closer correlation to safe-haven assets such as gold more recently. Whereas in the past few years, crypto had previously traded with a high correlation to risk assets.
Before we move on to the bullish catalysts for crypto, let’s look at the overall liquidity conditions for the markets to figure out if this can be supportive of higher prices for risk assets.
The Fed has been doing quantitative tightening, reducing the size of its balance sheet. You might remember that they built this up by buying up assets during COVID-19 to inject liquidity into the markets. But so far, this tightening hasn’t pulled risk assets lower.
Let’s find out why and if this is likely to continue.
Market liquidity conditions
Quantitative tightening so far
Since the Fed began quantitative tightening in June 2022, they have reduced their balance sheet from $9 trillion to approximately $7.8 trillion today. Market participants expected that this kind of drawdown in the Fed balance sheet would hurt the valuation of risk assets.Fed balance sheet
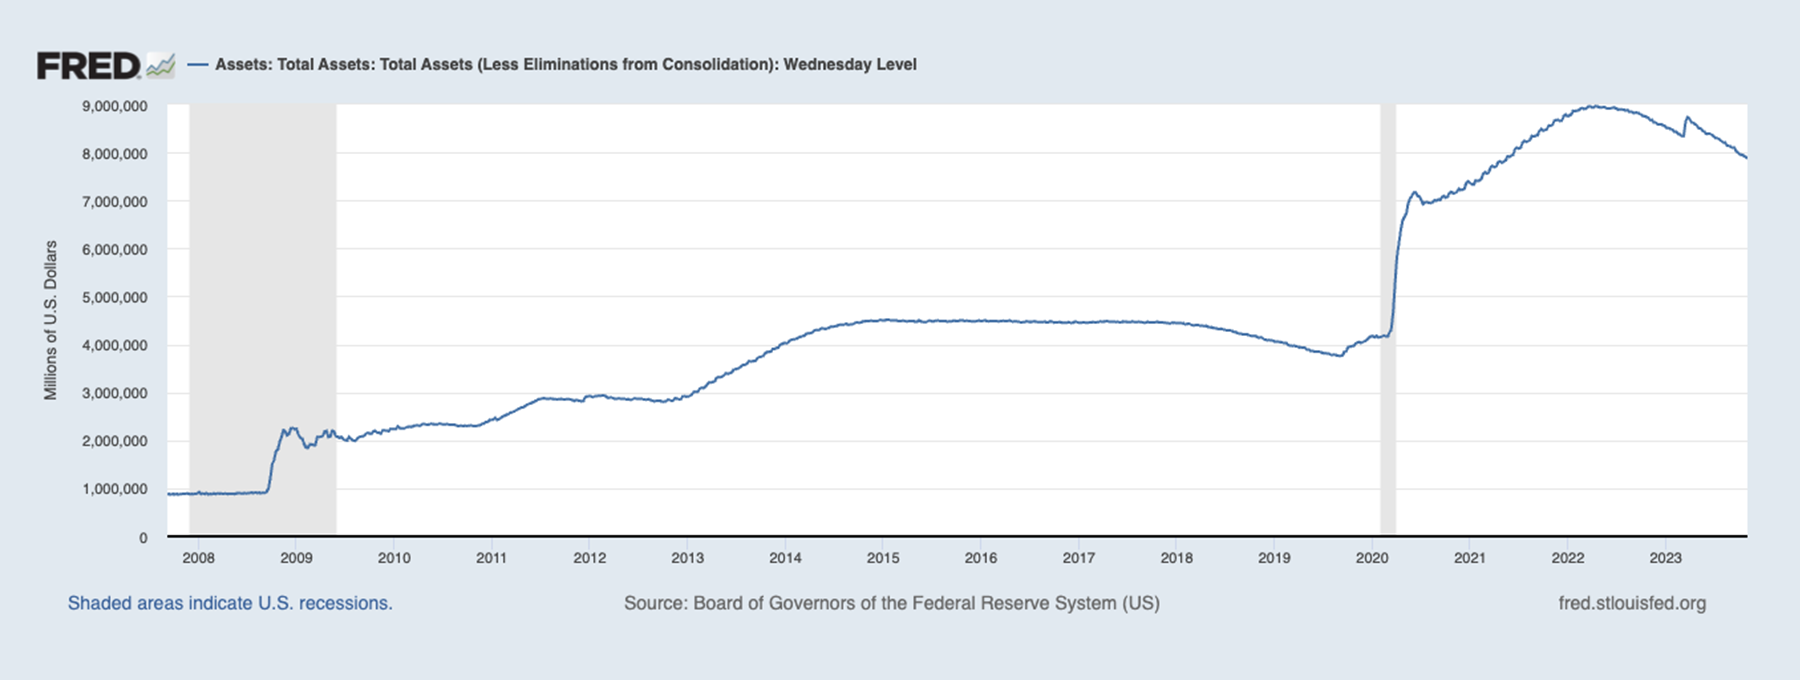
This drawdown has mostly been done by the Fed, allowing assets on their balance sheet to mature rather than directly selling them into the market. This was the softer approach because selling them would have taken liquidity out of the system.
Treasury general account and reverse repo
Additionally, the Treasury General Account (TGA) and the Reverse Repo facility have drawn down. This essentially offsets QT and has helped to keep net liquidity conditions POSITIVE. The Fed has reduced its balance sheet by $1.2 trillion, while the Reverse Repo and the TGA have drawn down by $1.4 trillion. This is a positive net liquidity total of $200 billion, and this is perhaps why risk assets have continued to perform well despite the liquidity fears of the Fed running QT.Going into 2024, the TGA is likely to build back up, while the Reverse Repo takes the hit (draws down) as money market funds move money out of the Reverse Repo and into bonds, allowing to offset the effects of further QT.
Liquidity conditions going forward
Liquidity conditions will tighten once the Reverse Repo and the TGA have both drawn down, and that’ll be the first time QT will negatively affect liquidity conditions. However, we don’t expect this to be a problem for at least the next year. TLDR, this is a thumbs up for risk assets.Why macro data + liquidity conditions are meaningful for crypto
Despite economic data indicating that a recession is likely in the coming quarters, the Treasury are likely to help keep net liquidity conditions positive for the coming quarters. This may help to keep asset prices afloat, and therefore potentially pushing a recession well into the back half of next year.Overall, this should be favourable to risk assets, like crypto, in the coming quarters.
Now, let’s dive into crypto.
3 catalysts that will drive the next bull run in crypto
The market climbs the wall of worry. Crypto prices often seem to take three steps forward, two steps backwards, and one step sideways – it can be somewhat unpredictable, but the general direction is northbound. Now, we’ve distilled the current state of the crypto market and here are 3 reasons why #WAGMI between now and 2025.LFG!!!
Spot Bitcoin ETF approvals
The biggest news over the past month has been the hype and the seeming significant progression of the SEC approving a/several Spot Bitcoin ETFs. Blackrock’s filing remains the most exciting for the crypto industry – CEO Larry Fink labels Bitcoin as a “flight to safety”.There is already a Spot Bitcoin ETF in Canada, and some people have pointed out that it didn’t essentially “open the floodgates” to institutional capital pouring in. However, an important point to note is that, Purpose, the asset manager for the Spot Bitcoin ETF in Canada, has $14 billion worth of assets under management. In contrast, Blackrock has north of $9 trillion worth of assets under management.
Alongside this, there are many other filings from other companies that want to have their Spot Bitcoin ETF approved. A week ago, the SEC said it has 8 to 10 applications “on its desk” awaiting approval.
When the rumours emerged that Blackrock’s Spot Bitcoin ETF application had been listed on the DTCC website, Bitcoin instantly got a massive bid. It recovered the large move down that price made following the false CoinTelegraph announcement of a Spot Bitcoin ETF being approved.
What we saw here was that many participants seemed under-exposed, and we feel the TradeFi guys recognised this. Again, bids came in, and activity from TradeFi picked up significantly.
On 23/10/23, following the news we’ve outlined above, public funds saw a $43m inflow into Bitcoin funds, 11% of the total inflow for the year-to-date period. At the same time, the Bitcoin CME Futures saw massive increases in volumes and open interest.
BTC CME futures volume
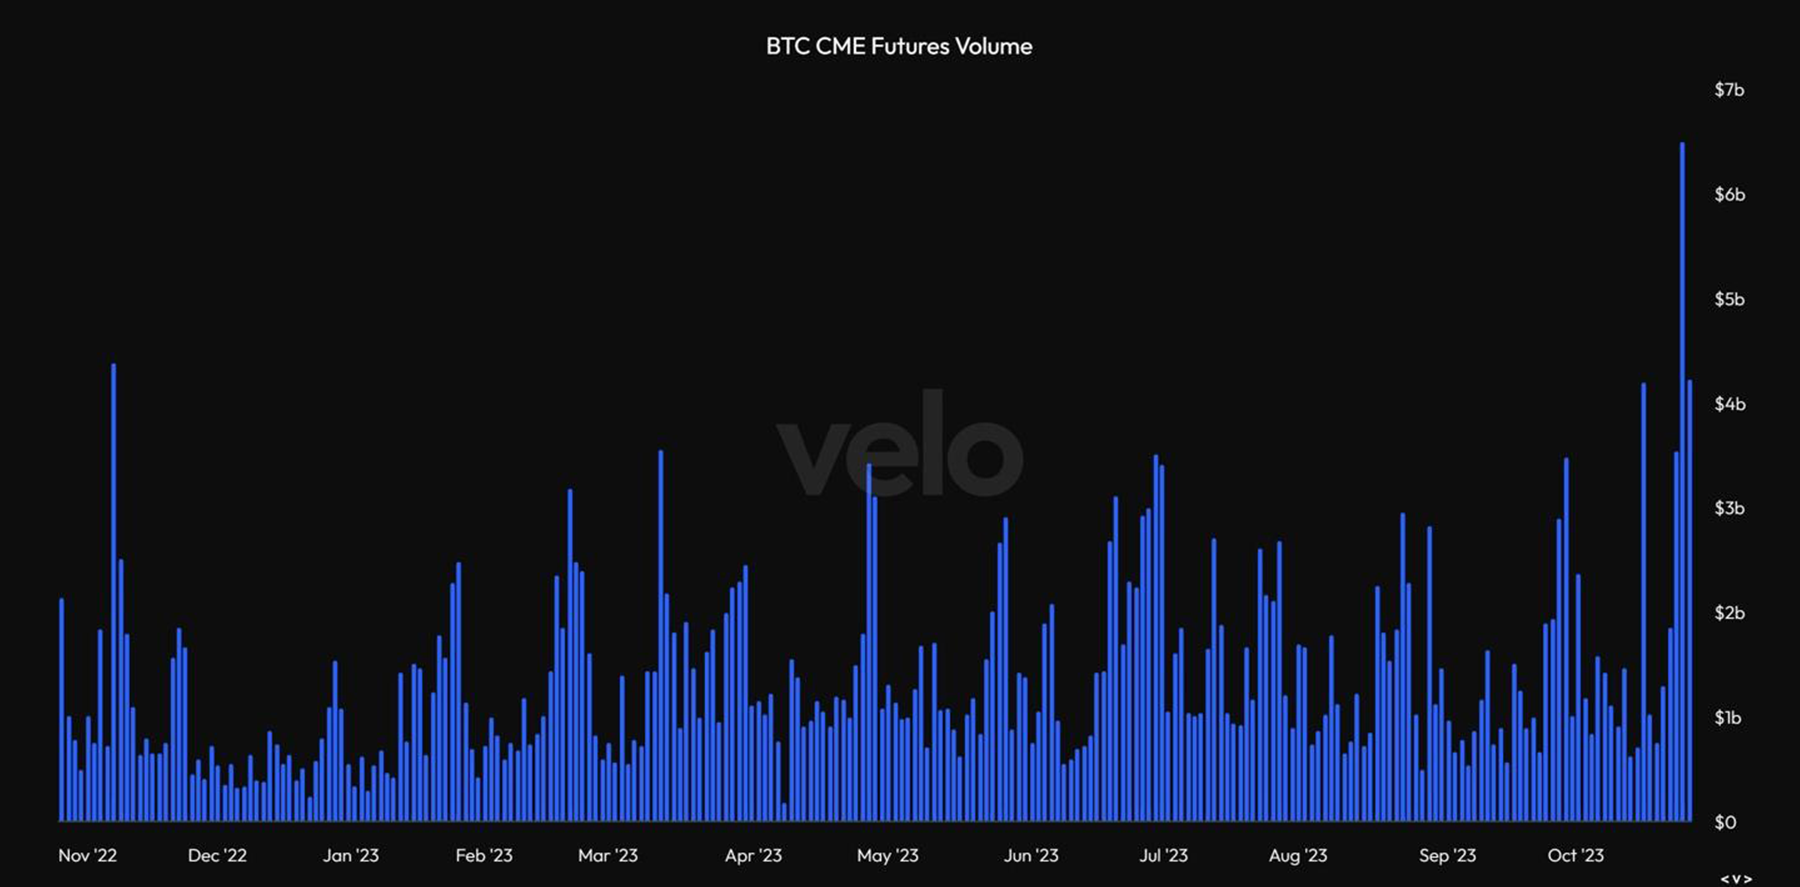
The options market is a market favoured by TradeFi participants. This also saw a large increase in open interest/volumes.
Total BTC options open interest
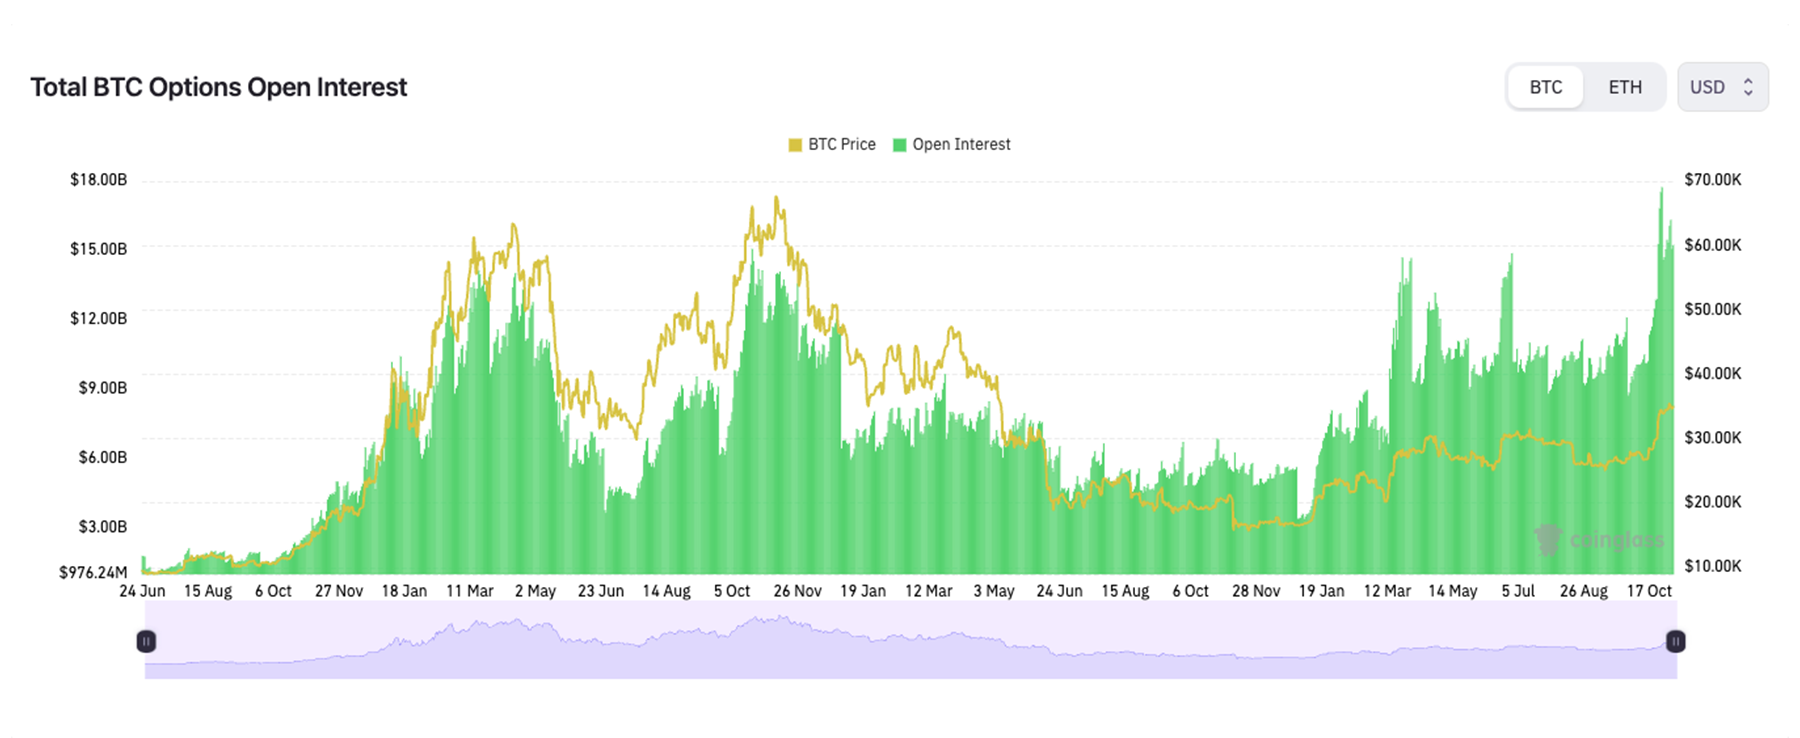
Options volume
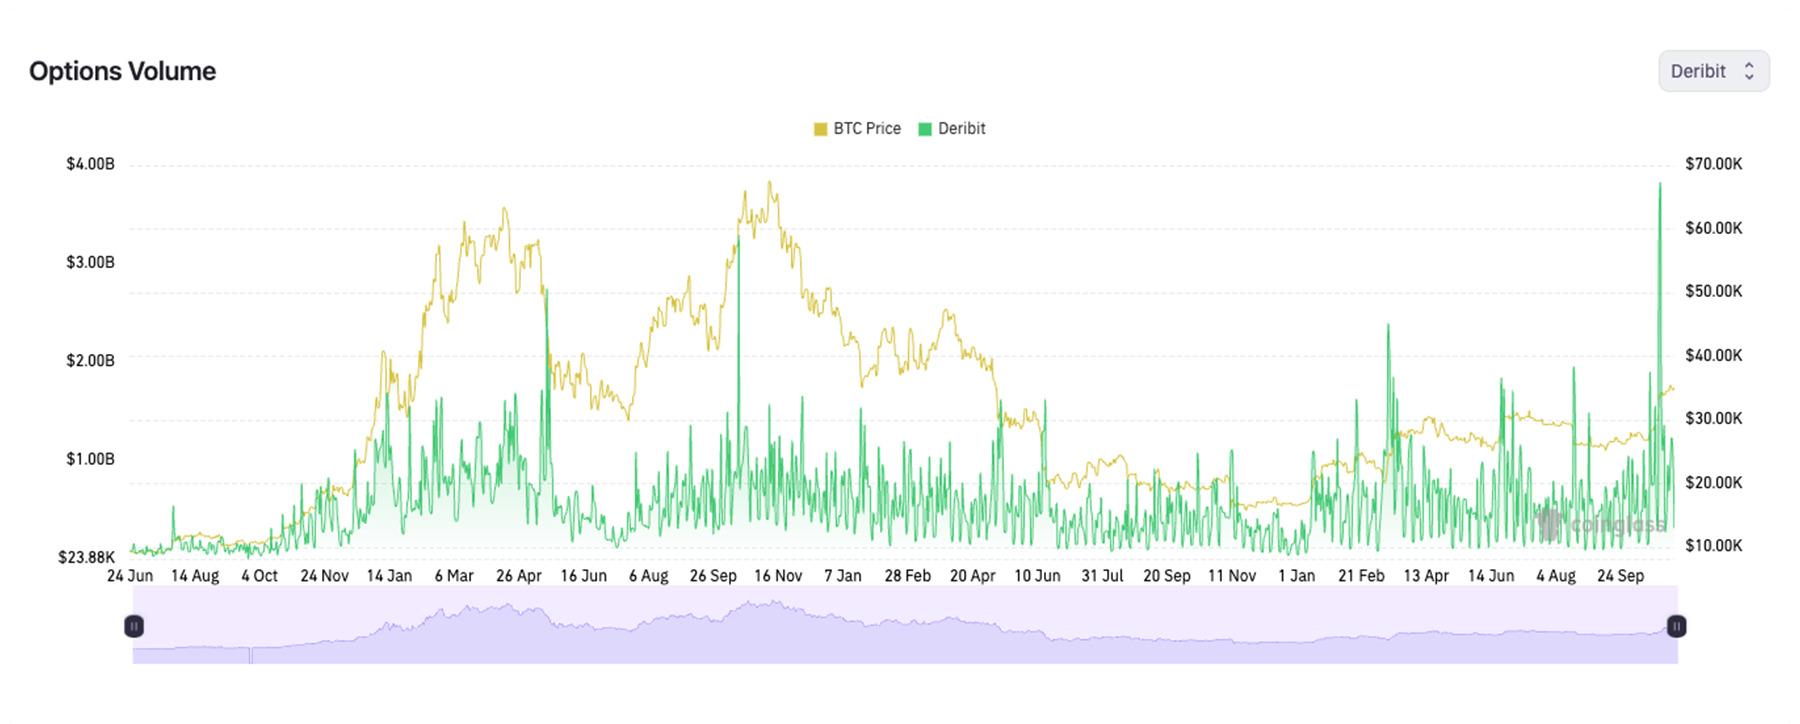
The above shows that TradeFi is front-running a possible approval of a Spot Bitcoin ETF. The deadline for the SEC to approve several ETF applications is January 10th 2024. However, we expect several applications to be approved before then. This is one of the major bullish catalysts that could take the market more meaningfully higher, which is a risk if you’re currently under-exposed to crypto.
Bitcoin halving coming up
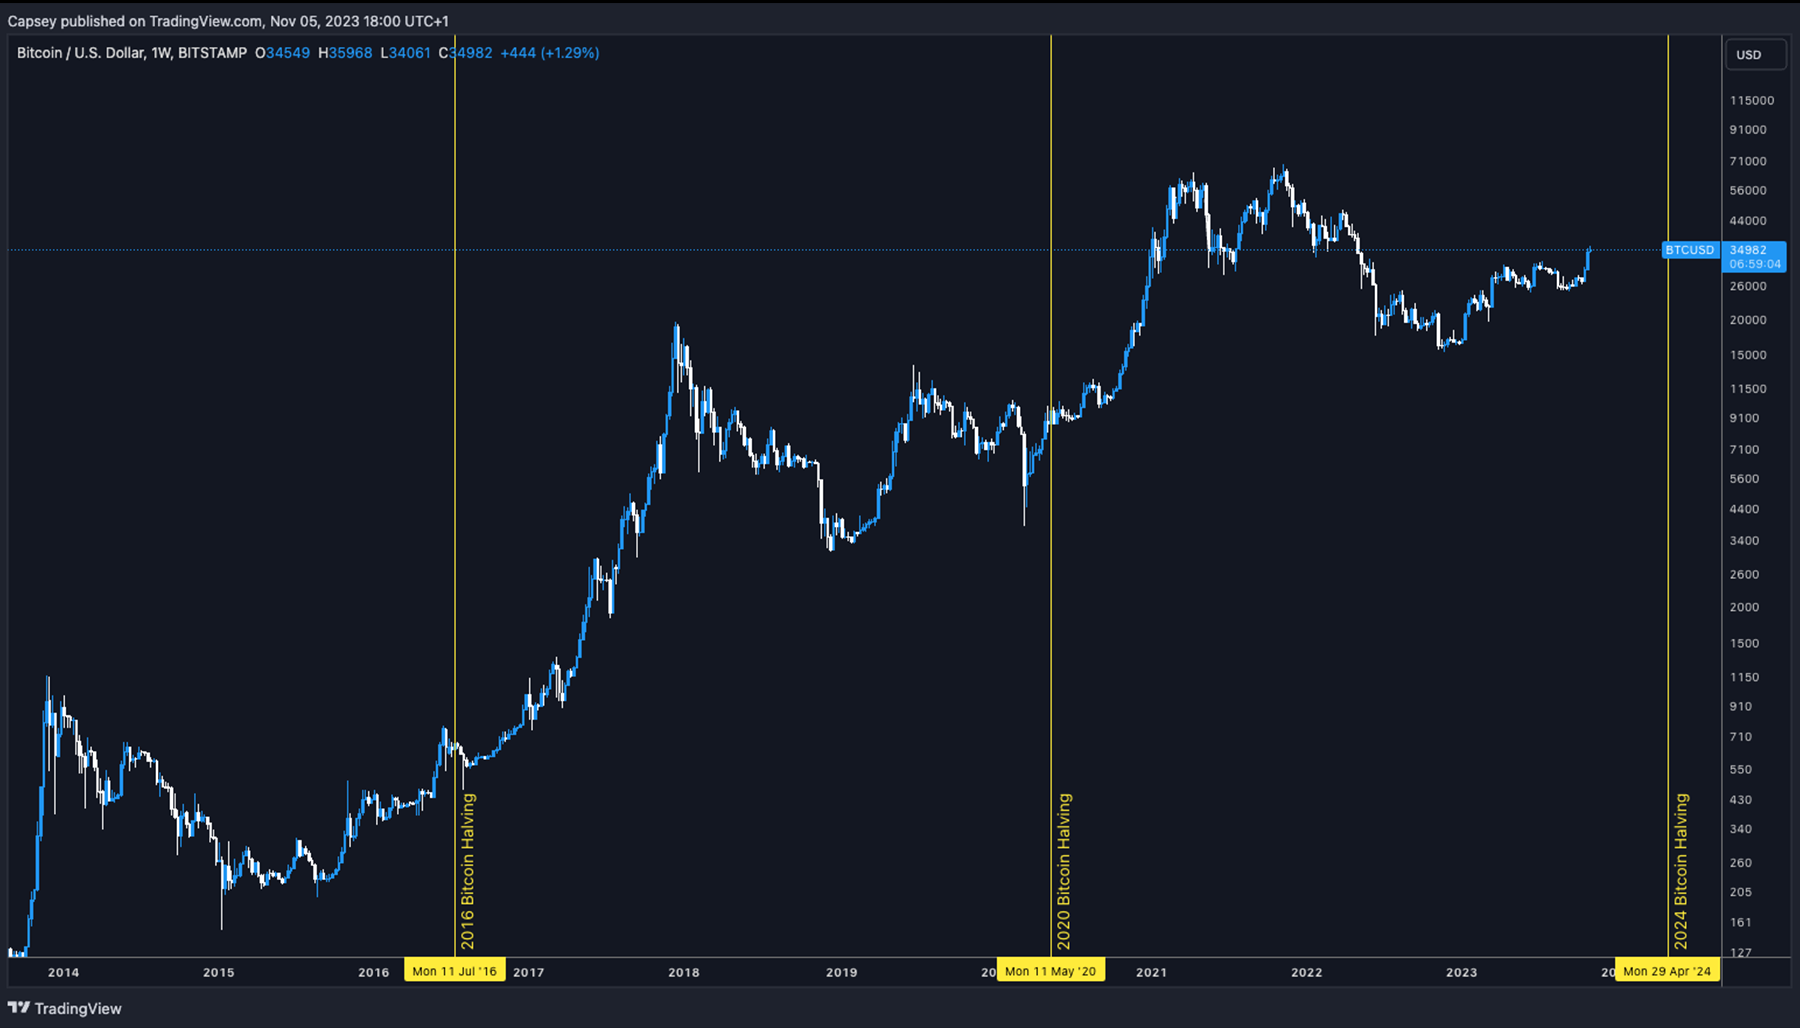
The second major bullish catalyst is the Bitcoin halving – expected for April 2024.This is where the reward paid to miners is halved. Also, the amount of hash power needed to compete for the Bitcoin reward increases – assuming that that miner wants to maintain its market share of the Bitcoin reward paid out each block.
Historically, the six months before a Bitcoin halving has been a great long-term buying opportunity. The below chart shows the Bitcoin price on a weekly timeframe against the prior Bitcoin halvings.
Note: The scale is logarithmic.
Bitcoin price plotted with prior Bitcoin halvings
Bitcoin is still significantly undervalued
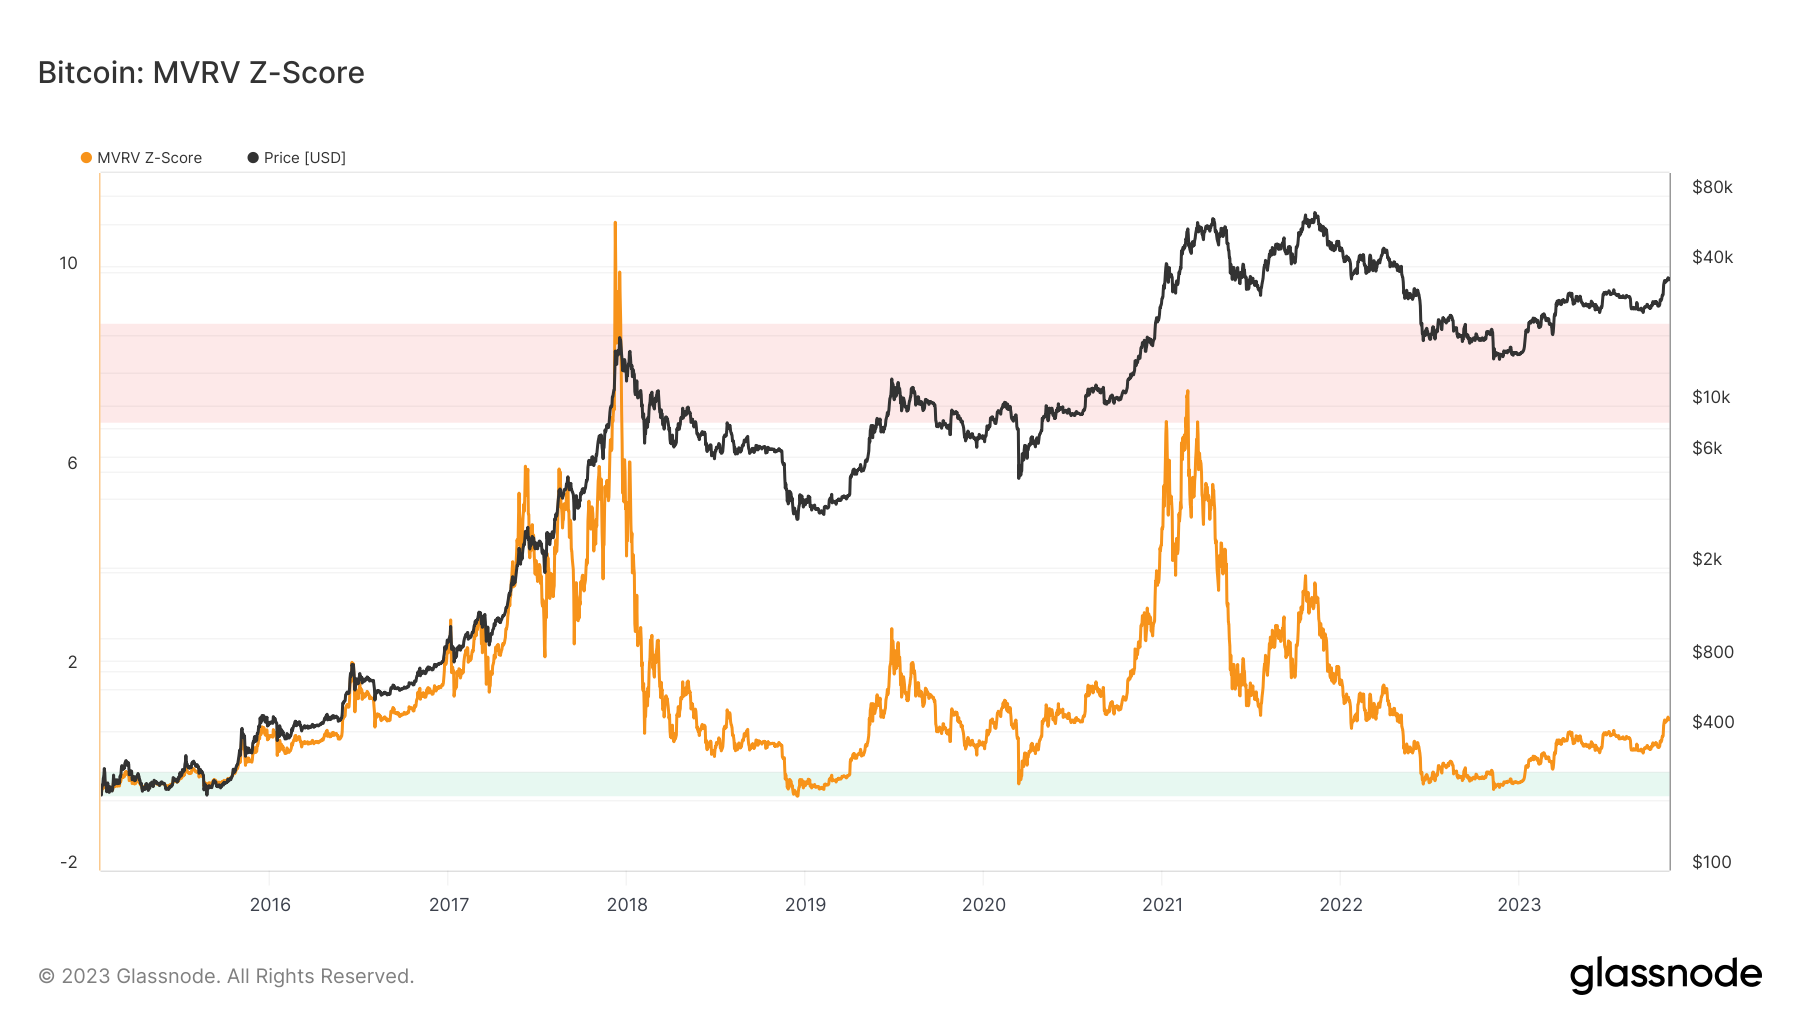
Despite Bitcoin’s price increasing 29% since mid-October (driven mostly by ETF excitement), several key on-chain metrics show that Bitcoin is still undervalued, even though it is no longer in deep value territory.The first of these is the MVRV Z-Score. This evaluates whether Bitcoin is overvalued or undervalued relative to its “fair value”. As suggested above, it’s no longer in deep value territory, but it shows Bitcoin is still significantly undervalued.
MVRV Z-Score
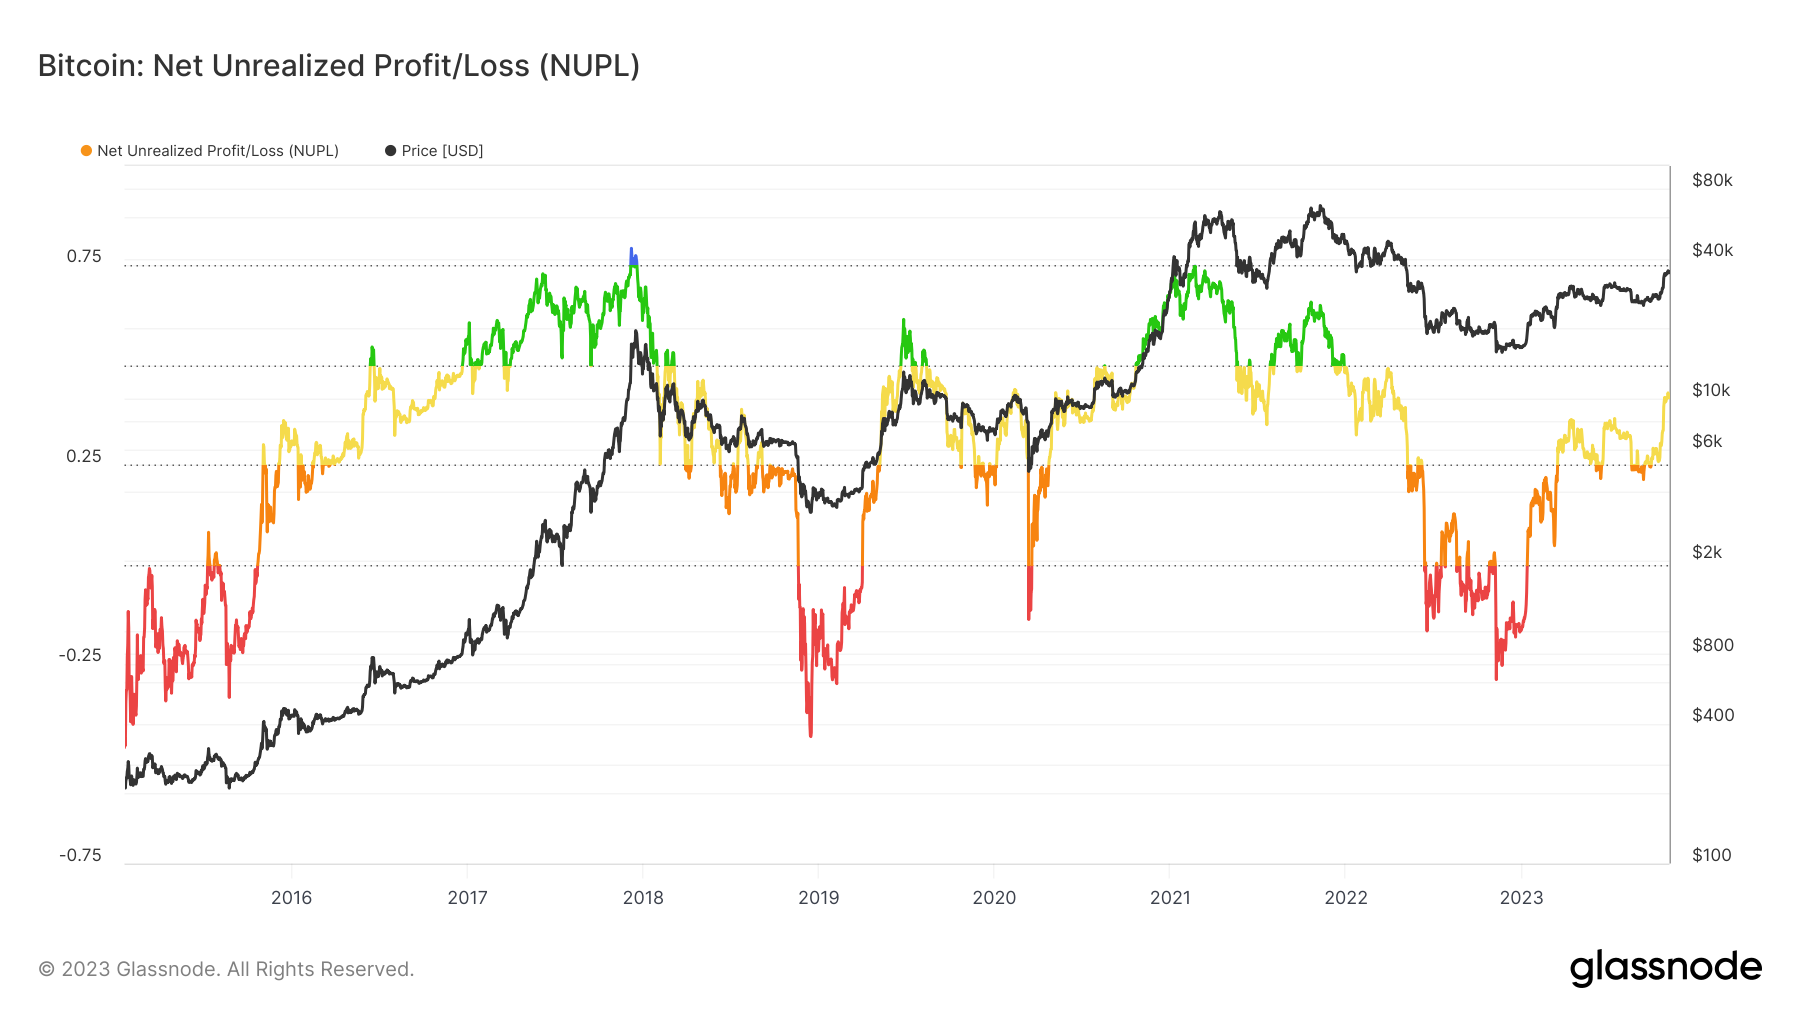
The second of these metrics is the Net Unrealised Profit/Loss. This chart shows generally how much of the market is currently in an unrealised profit or loss. The below suggests that many market participants are no longer in deep losses, and the market has recovered.
Net unrealised profit/loss
Cryptonary’s take
From assessing the economic data and the liquidity environment, the economy and asset prices may continue to hold up for the coming months and quarters.Therefore, we shouldn’t expect any drastic collapse in major markets like the S&P or the Nasdaq, and this should be supportive of risk assets performing well in the coming months and quarters.
If we overlay this with a Spot Bitcoin ETF likely to be approved by January 10th, 2024, along with the next Bitcoin halving in April 2024, it would be unwise to be under-allocated to crypto despite the market moving meaningfully higher over the past few weeks.
The above on-chain metrics are both pointing higher, but they suggest that any meaningful declines in price should be Dollar-Cost Averaged into.
How we’d position into crypto from here onwards
We recommend increasing exposure to at least 70% to 75% by the end of January 2024 and continuing DCA’ing with USD between now and the halving in April 24. We like to keep 25% to 30% in USD on the sides so that if there is any major pullback in the markets and the crypto space sees a 20% or greater decline in prices. This 25%-30% decline would be used to buy up that panic in markets.With the feeling that the recession is going to be pushed into the second half of 2024, and with Spot Bitcoin ETFs likely to be approved by 10/01/24, along with the next Bitcoin halving on April 24, we feel there aren’t many downside tailwinds for crypto prices in the coming months.
Looking ahead, we mostly also see major bullish catalysts for crypto. We therefore suggest becoming 70%-75% exposed to crypto and leaving the remaining 25%-30% for buying up any panic in markets that may come in the future.
In our opinion, we see several bullish catalysts with little downside risk for the markets. Therefore, we feel you should buy up crypto at current prices and at any other meaningful pullbacks.
2025 price targets
We expect the bull run top to come in 2025, where we see:- Bitcoin (BTC) is valued between $110,000 to $145,000 (currently $35,100).
- Ethereum (ETH) is valued between $7,500 to $9,000 (currently $1,870). In the next two to three weeks, we will publish a deep dive report on why ETH is set to hit a new all-time high during the next bull run. Stay tuned.
- Solana (SOL) is valued between $250 to $300 (currently $41). In the next two to three weeks, we will publish a deep dive report on why SOL is set to hit a new all-time high during the next bull run. Stay tuned.
We are always publishing unsponsored, ads-free, unbiased reports about the most exciting opportunities in Web3.
Check out the research section to access alpha reports to position your portfolio for the biggest wins.
Are you a trader? Check out our trading floor to gain market direction for your trading setups.
Recommended from Cryptonary


