Log in

Market Updates

Market Update: BTC Surges, Altcoins Ready to Run

Updated: Jul 29, 2025
Published: Jul 16, 2025
0
Share:

Bitcoin’s breakout to $123k, powered by ETF inflows and a massive short squeeze, is setting the tone for a potential alt season. While macro risks linger, the setup across majors and alts looks extremely bullish going into year-end.

Post Feature Image

Disclaimer: This is not financial or investment advice. You are responsible for any capital-related decisions you make, and only you are accountable for the results.


TLDR:

  • Rate cuts less likely after softer inflation data.,
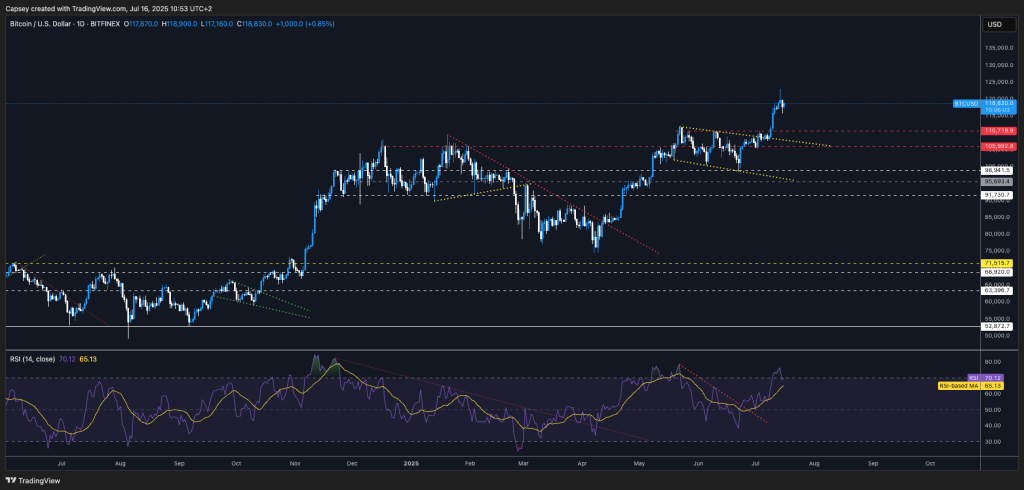
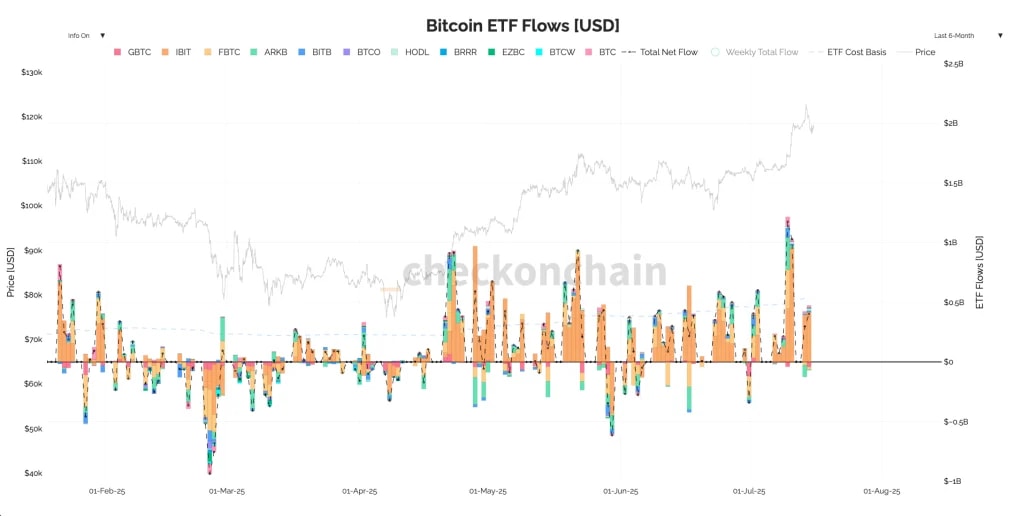
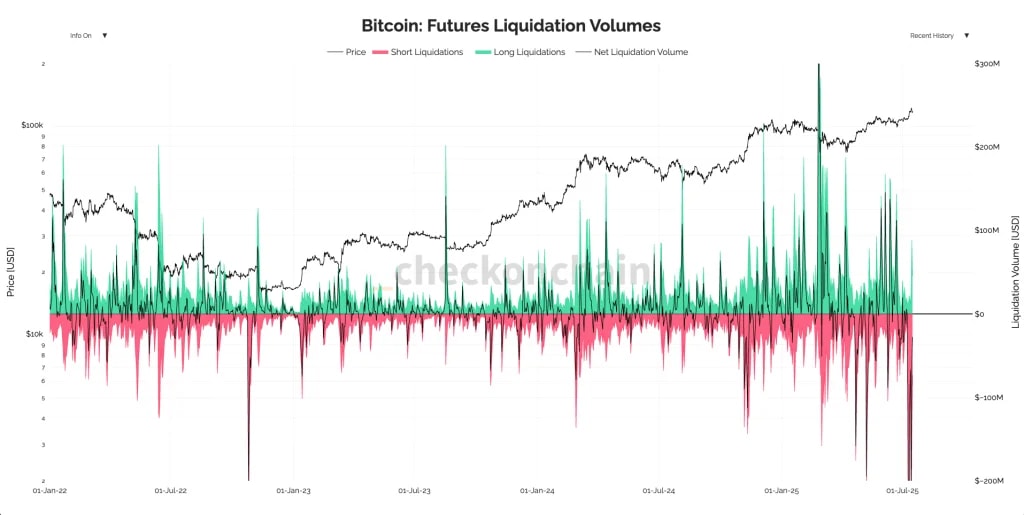
  • BTC hits $123k, boosted by ETF inflows and short squeeze.,
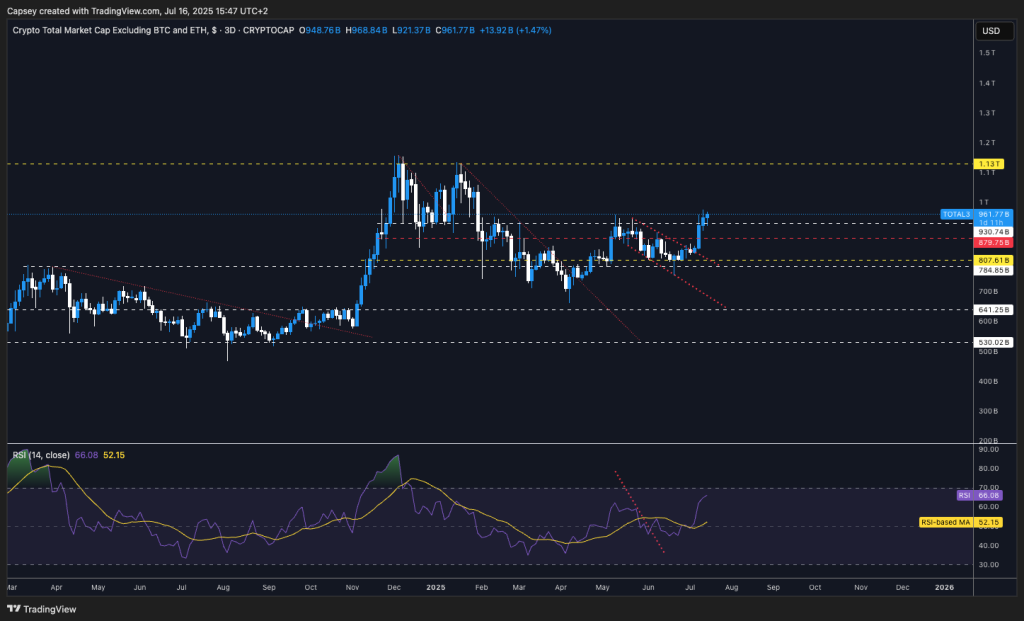
  • Altcoins gaining momentum, early signs of alt season.,
  • Cryptonary bullish, eyes $150k+ BTC by year-end.,
Topics covered:
  • Data This Week and its Effect on Rate Cuts.,
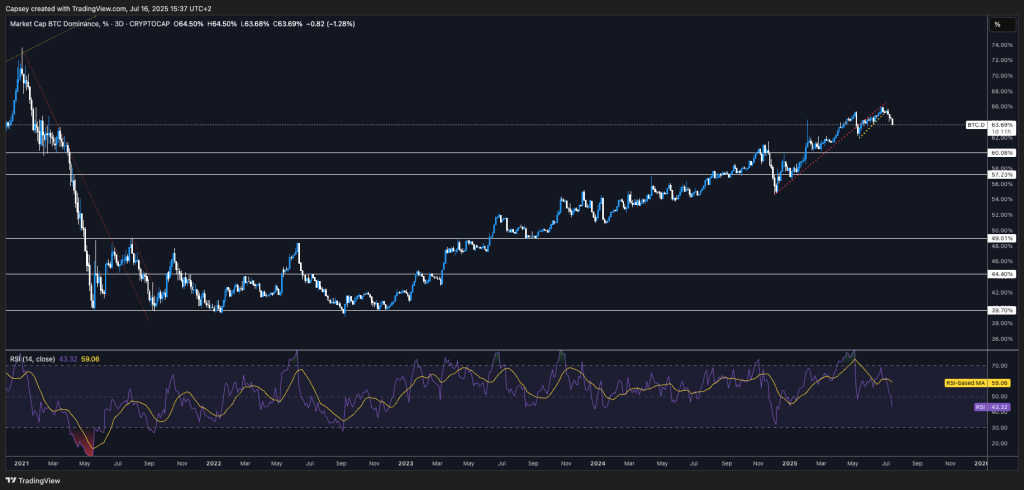
  • BTC's Breakout.,
  • Cryptonary's Take.,
Data This Week and its Effect on Rate Cuts: The key macro data this week was Tuesday's inflation data. We saw Core Inflation MoM come in at 0.2% which was slightly softer than the expectations due to Services coming in softer, and offsetting an acceleration in Core Goods. This is the first sign that we're beginning to see the effects of tariffs creeping into the inflation data.

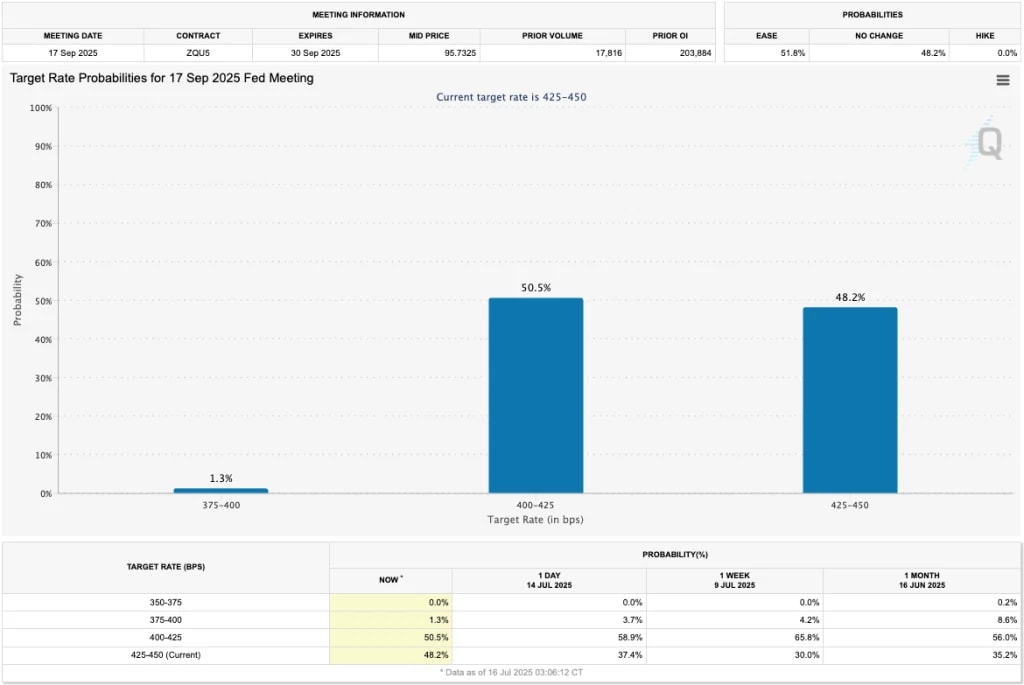
The result of this was an increase in Bond Yields, particularly at the front end of the curve. In plain English, this is the market reducing the odds of Interest Rate cuts in the near term. And in the last day, we've seen the odds of an Interest Rate cut at the July Meeting fall from 6.2% to now 2.6% - granted a cut in July was very unlikely anyway. However, the September Meeting was pricing a 65.8% chance of a rate cut at the September Meeting, and now following Tuesday's Inflation data, the market is now pricing just 50.8% (a coin flip) for a cut at the September Meeting.
Target Rate Probabilities for 17th September FED Meeting:
aligncenter wp-image-310169 size-large
BTC's Breakout: In this section we'll assess the health of the breakout from BTC, potential price targets, and how the rest of the market is setup following this move.
Starting with BTC. From the technical perspective, BTC broke out of the main horizontal resistance at $110,700, having built support on the top border of the down trending wedge. This saw price catapult into the $120k-$125k zone that we had earmarked as the next target (hitting $123,100). The RSI is now in overbought territory, and there is a CME gap between $114,300 and $115,700 that may act as support should BTC pull back. Although, BTC has begun consolidating between $116k-$121k over the last few days, which is positive.
BTC 1D Timeframe:
aligncenter wp-image-310170 size-large
Let's now look at the fundamentals of the breakout.
There are positive and negative aspects of it. The positive is that we've seen substantial inflow into the BTC ETF's which helped BTC initially breakout of $110k-$112k resistance zone.
BTC ETF Flows (USD):
aligncenter wp-image-310172 size-large
Following the price breakout supported by the ETF bid, price continued higher due to a meaningful Short-squeeze. We can see this on the below chart that this Bitcoin price breakout was aided by one of the largest 'Short Liquidation' events on record.
BTC: Futures Liquidation Volumes - Massive Short Liquidations:
aligncenter wp-image-310173 size-large
One potential cause for concern is that this price breakout wasn't supported by strong volumes, which is a slight negative aspect, and it throws some doubt over whether this price breakout is a healthy breakout. However, this may be due to the fact it's the summer, which is a typical low volume period, so we must take this into account as well.
What we'd like to see is for the volumes to begin picking up in the coming days, especially if there is a price pull back and that gets those that are sidelined, off the sides, and into the market.
BTC Futures Volume (USD):
aligncenter wp-image-310174 size-large
Another chart we're monitoring as a potential concern, but still in the early stages, is the Long-Term Holder Binary Spending. We're beginning to see Long-Term Holder spending uptick, however, we're not yet seeing it get into the levels that would suggest an abundant amount of selling and therefore a potential top in price. For that, we'd be looking for the below chart to go into orange (moderate spending) or pink (heavy spending) territory.
Long-Term Holder Binary Spending Indicator:
aligncenter wp-image-310175 size-large
ven though volumes are low, and the BTC breakout was significantly aided by a large Short-squeeze, we have a price breakout to new all-time highs backed by strong ETF inflows. It's possible we see price consolidate in the short-term, but beyond that, what do the valuation models suggest for potential upside targets from here?
One of the more key metrics for this is the MVRV Pricing Bands. We can see in this chart that price is just above its +0.5 standard deviation line of the MVRV. In recent years, BTC has also got extremely close to +1.0 standard deviation (pink line), which is currently at $138k.
MVRV Pricing Bands:
aligncenter wp-image-310176 size-large
In summarising the above, we can take away that the BTC price breakout to $123k was driven by strong ETF flows, and then a large Short-squeeze. Volumes have been lacking which is a bit of a warning sign that the rally might not be healthy/sustainable, but we do have to take note that we're in summer, which is typically a low volume environment.
It's likely that BTC consolidates between $112k and $123k (probably more like $115k to $123k) in the immediate term before it moves higher again in the medium term. However, this would likely open the door for a more constructive environment for the rest of the space (alt season). We're now beginning to see that in several core metrics:
  • ETH/BTC,
  • BTC.D,
  • TOTAL3,
ETH/BTC has put in its first higher low on the Weekly chart, having bottomed at a similar level to its absolute bottom in 2019. It's very possible we see a continued uptrend in ETH/BTC here. ETH breaking out likely leads the other majors, and this is a sign that alt rotation is in play. The question is now whether this lasts just a few months or several quarters. We'll continue to monitor this as it develops.

ETH/BTC Weekly Timeframe:
aligncenter wp-image-310177 size-large
Another key indicator of "alt season" is to see a meaningful breakdown in Bitcoin dominance, which we're now beginning to see. In the below chart, we can see that BTC.D on the 3D timeframe has lost its main uptrend line, and now it is breaking down. This is a positive indication that we're potentially at the early stages of an "alt season".
BTC.D 3D Timeframe:
aligncenter wp-image-310178 size-large
TOTAL3 was a chart we were watching closely over recent months. A breakout to the upside of TOTAL3 would suggest that the MCap outside of BTC and ETH was increasing - "alt season". We're now seeing this.
TOTAL3 held the horizontal supports of $784b to $807b, and price has since broken out of the downtrend line, and reclaimed the major horizontal resistance of $930b. This is a fantastic move. We'd now be looking for price to consolidate above $930b, turn that resistance into new support, before pushing higher onto $1.13t.
Overall, this is a super bullish setup for the general market.
TOTAL3 3D Timeframe:
aligncenter wp-image-310179 size-large
Cryptonary's Take:
This is what we've been waiting for. Bitcoin has broken out to new all-time highs and the altcoin market looks ready to make a meaningful breakout higher of its own. With Bitcoin consolidating at new all-time highs, this usually leads to the rest of the space following much higher in a catch-up trade. And when we assess this from a metrics and charts perspective, we can see that this looks likely to happen again. This is positive for lower cap coins that are now in an environment in which they can outperform. This is relevant to memecoins, and Cryptonary's Pick - $AURA.
Our base case is for BTC to consolidate in the short-term, whilst the rest of the market can start moving higher. We would then expect BTC to breakout of its highs and push on to the $130k-$140k zone in the medium term - on-chain models has a tighter range of $135k-$138k.

The risks to the rally are mostly macro, with the most major one being inflation, particularly if it comes in hotter over the coming months should the effects of tariffs show up more meaningfully in the data. Whilst we'll continue to monitor this, our analysis suggests remaining bullish and constructive on the market.

We maintain our call for BTC to be north of $150k by year-end.

Get started for free

Create your free account or log in to read the full article.

By signing up, you agree to our Terms & Conditions
Recommended from Cryptonary
This Week's Setup: 24th of November
PRO
Market Updates
This Week's Setup: 24th of NovemberMarkets rarely move in straight lines, and this week is no exception. With sentiment shifting and vo...
10 min read
Nov 24, 2025
Important Market Update: Is Bull Cycle Over?
Market Updates
Important Market Update: Is Bull Cy...The crypto market hasn’t felt this tense in years. Confidence has cracked, liquidity is draining, an...
11 min read
Nov 21, 2025
This Week's Setup: This Isn't 2022 - Here's Why We're Accumulating
PRO
Market Updates
This Week's Setup: This Isn't 2022 ...Markets just entered the kind of inflection zone that rarely lasts long. Oversold signals are buildi...
11 min read
Nov 17, 2025