Save 35% ($551) & Get a Free 1-1 Call with our Team ⏰ : 0d 2h 59m 44s

Disclaimer: This is not financial or investment advice. You are responsible for any capital-related decisions you make, and only you are accountable for the results.
Market context
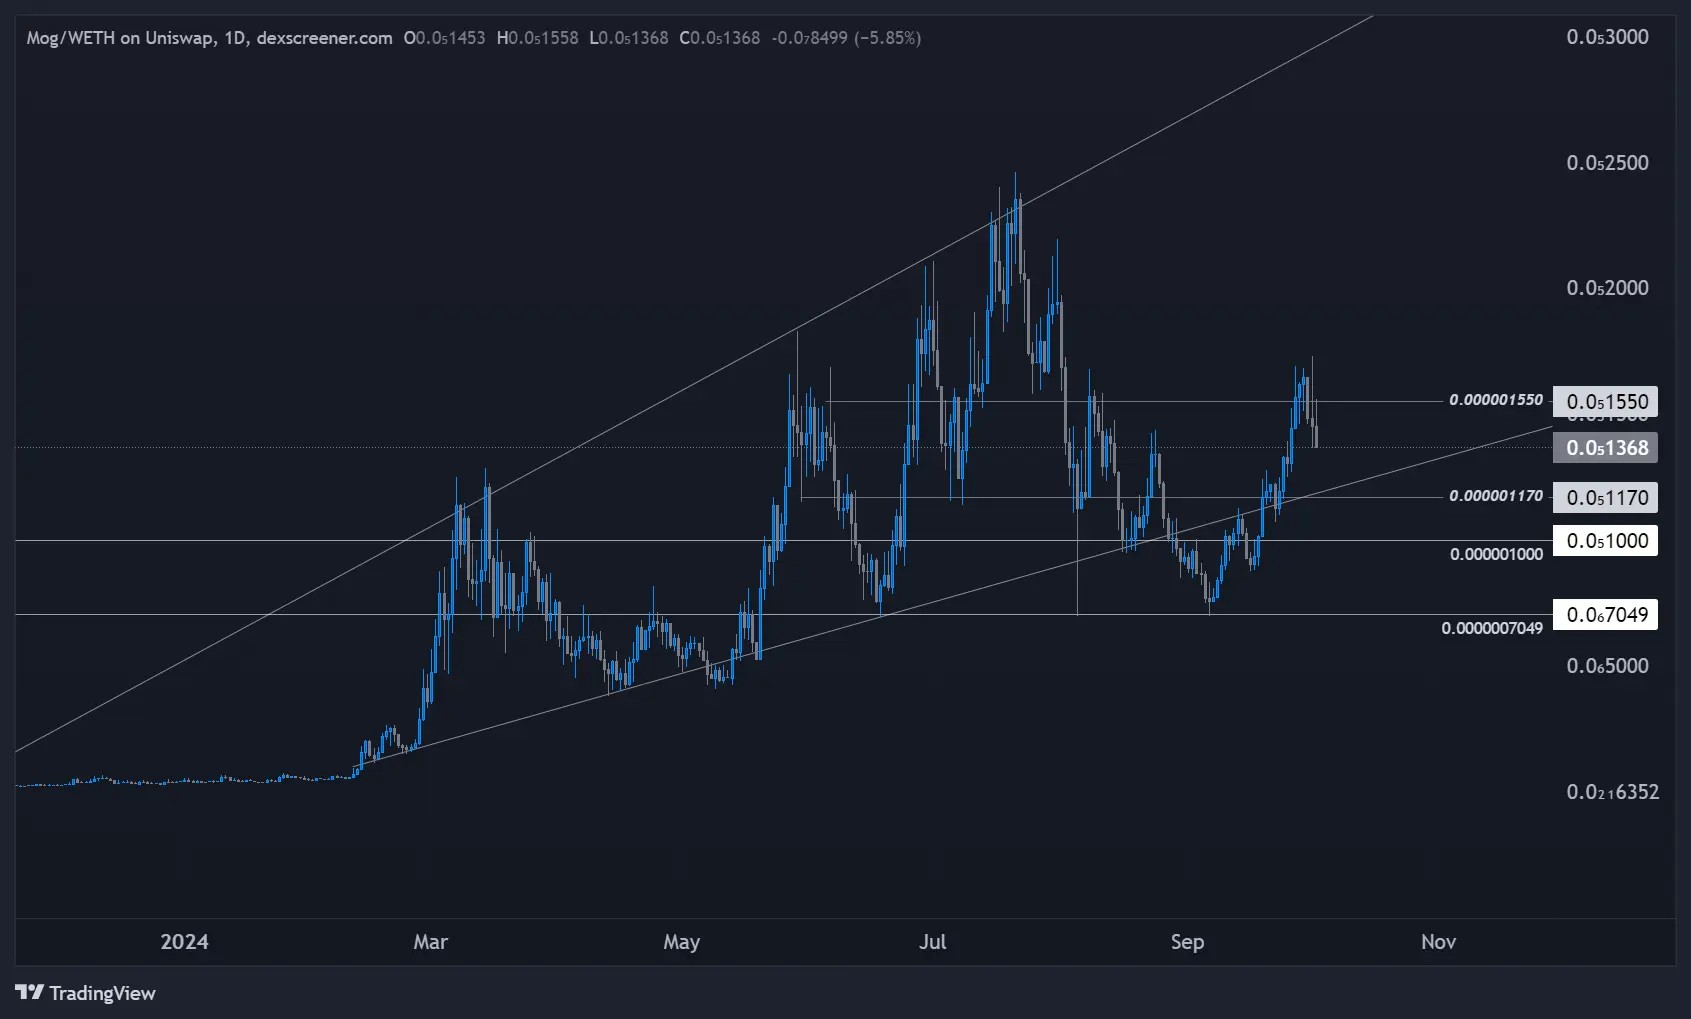
On the daily time frame, Mog has previously accumulated between 0.0000007049 and 0.000001. After a solid reaction out of this range, the asset showed positive movement, with a price increase of 115% from that accumulation zone.However, with the current geopolitical tensions and broader market sell-offs, caution is necessary, and with this being a short-term bearish catalyst, we naturally allow for further downside in price action.
Market cap and holders
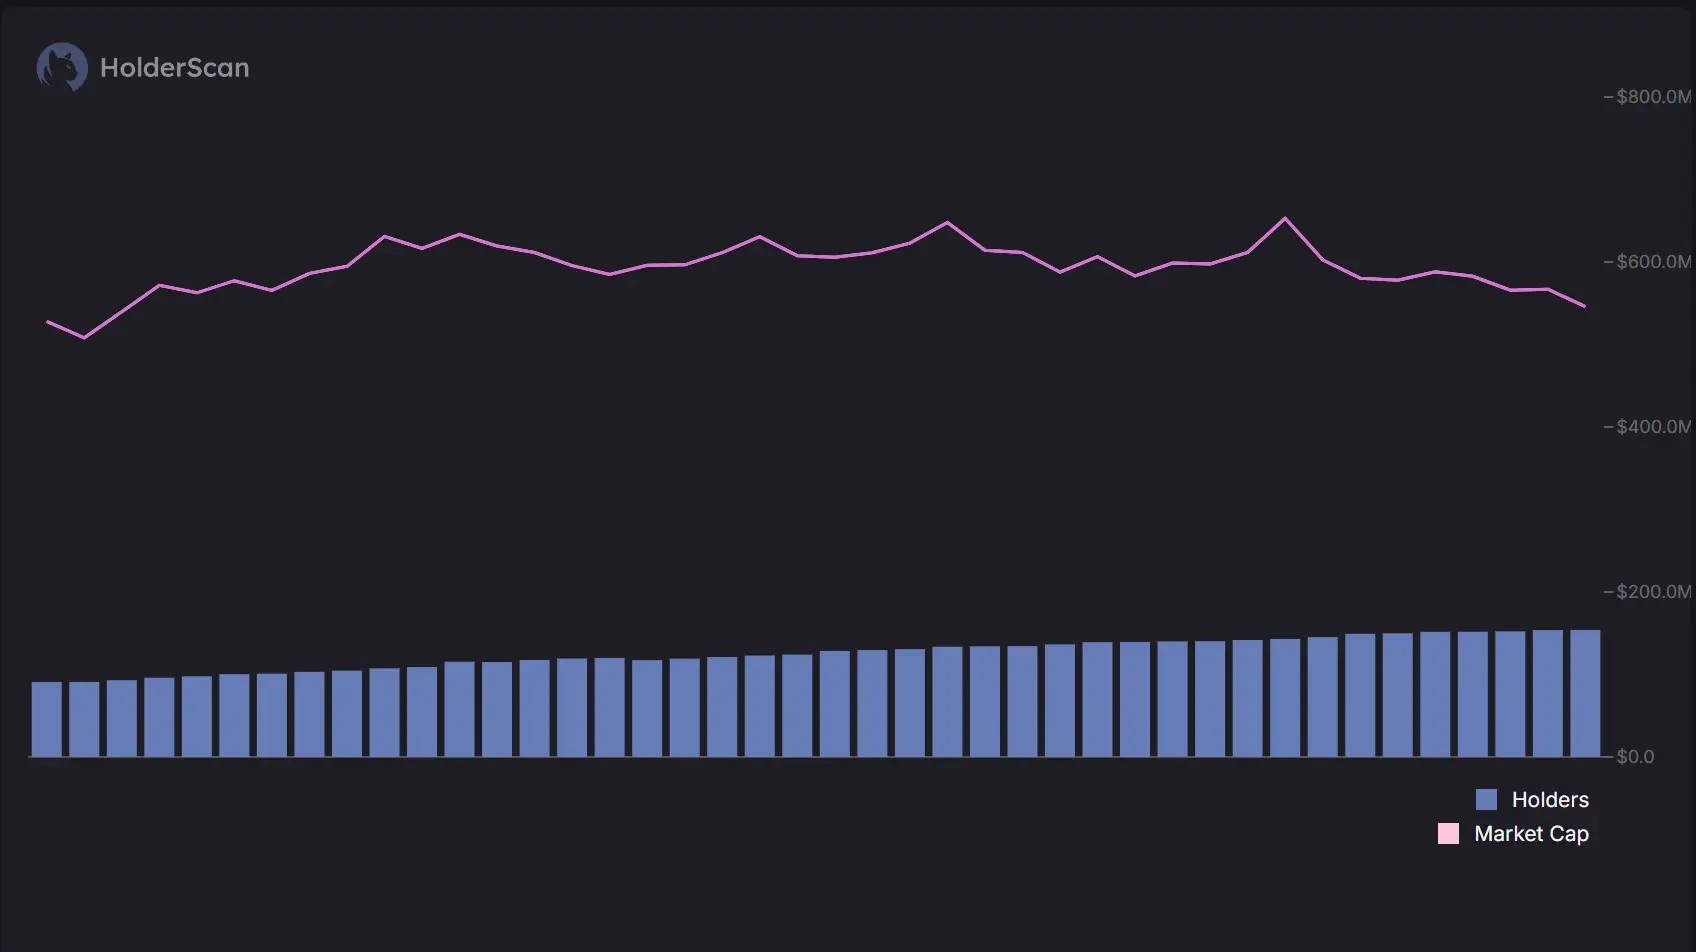
Market Cap has been steadily decreasing over the past 7 days.- Despite the drop in market cap, the number of Holders has remained stable, signalling consistent holder confidence or low trading activity.
- This suggests that while Mog has experienced a decrease in value, the holder base remains strong. This could indicate that investors are choosing to hold through the volatility rather than exit their positions. The steady holder count, despite a declining market cap, reflects potential consolidation between the two areas of the price we have identified as near-term key levels as we wait for broader market conditions to improve.
Playbook
Key levels:- 0.000001550: Resistance
- 0.000001170: Is our support aligning with the current trend line on the daily chart?
Strategy
- Given the 115% move from the key support at 0.0000007049, it's important to allow price action to pull back, especially with broader market conditions.
- The decline in the market cap also signals a need for caution, with the patience required to see how Mog responds to support levels around 0.000001170.
- Despite the current volatility, the higher time frames still reflect a bullish structure, which is a positive sign for the asset. Accumulation around 0.000001170 may present the best opportunity for positioning for those with conviction and who are looking to hold or who are holding this asset.
Cryptonary's take
While Mog continues to look strong on the higher time frames, allowing for a retracement down to 0.000001170 would be the safest move before positioning. The recent 115% run needs to be digested, especially as the Market Cap has shown a decrease over the last 7 days.However, the steady number of holders shows potential confidence in the asset. Cryptonary has no financial interest in Mog, and this analysis is purely for educational purposes. Meme coins remain high-risk assets, and investors are advised to conduct thorough research before engaging with assets like Mog.
MOG price prediction today: Is a breakout above $0.011 possible?
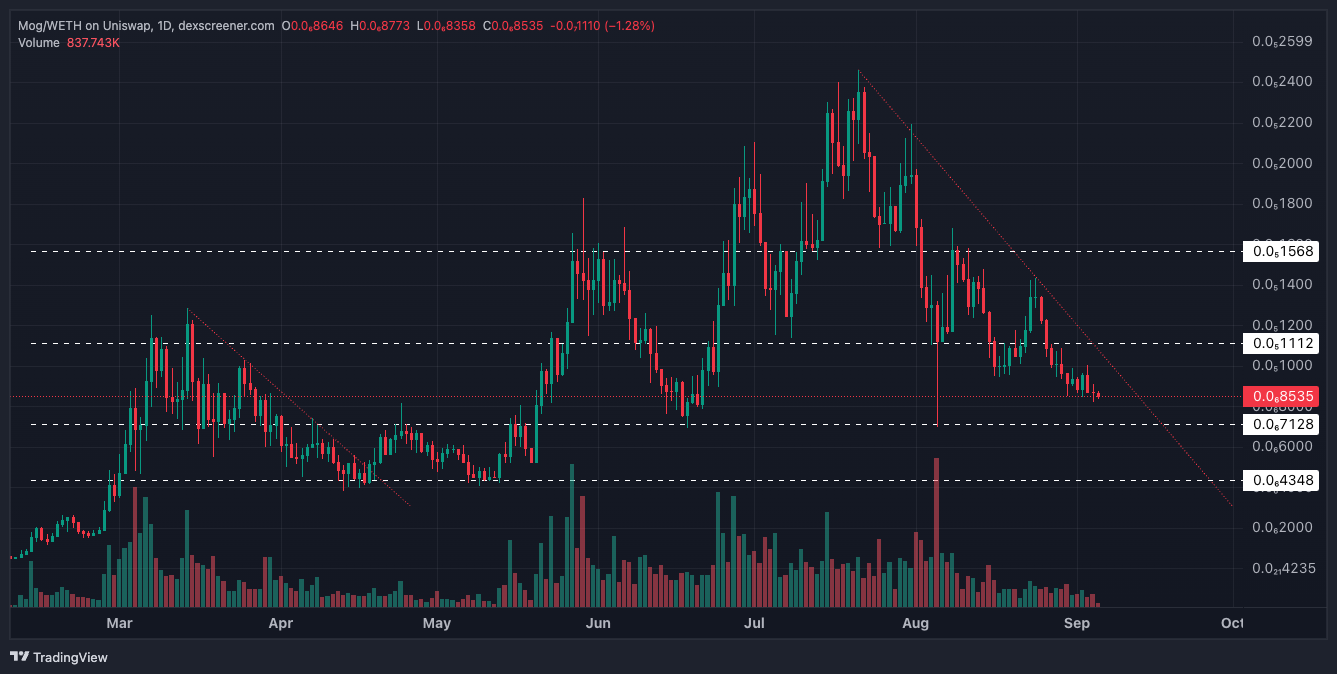
Sep, 5, 2024- MOG is currently in a 6 week downtrend, having peaked at triple today's price back in late July.
- Alongside this, MOG is seeing downtrending volumes. In order for the price to go materially higher, you'd need to see volumes pick up much more substantially.
- If price continues trending lower, and we expect that it will, it'll likely head to the support at $0.0071. It's pivotal in the short-term that MOG holds that level.
- To the upside, the level of price to comfortably clear above that would convince us that there is more substantial upside to have is the horizontal resistance of $0.011.
- A breakout of the downtrend line, backed by increased volumes is what we'd look for for price to then see a more substantial move higher.
Cryptonary's take
MOG is approaching a more attractive area when it comes to valuation, which would be the $0.0071 area. However, a breakout of the downtrend line would likely only be possible if more volume comes back into the coin, and for now, the volume is downtrending, so we'd expect the price to do the same in the immediate term. If/when the price hits $0.0071, we can reassess again then, but for now, we wouldn't be interested in building a position just yet; we'd be waiting on lower prices before we consider that.MOG price prediction: Is 0.0000001 the next DCA level?
Aug, 28,2024MOG: This meme has a unique personality
In the current cycle, meme tokens like MOG exhibit distinct personality traits that mirror each other closely. These assets, while traded similarly, have their own unique characteristics, much like different avatars.By understanding these traits, you can position yourself more confidently in the market. Recognizing how these assets behave during bullish surges and significant retracements allows for more informed and composed decision-making.
MOG’s historical context
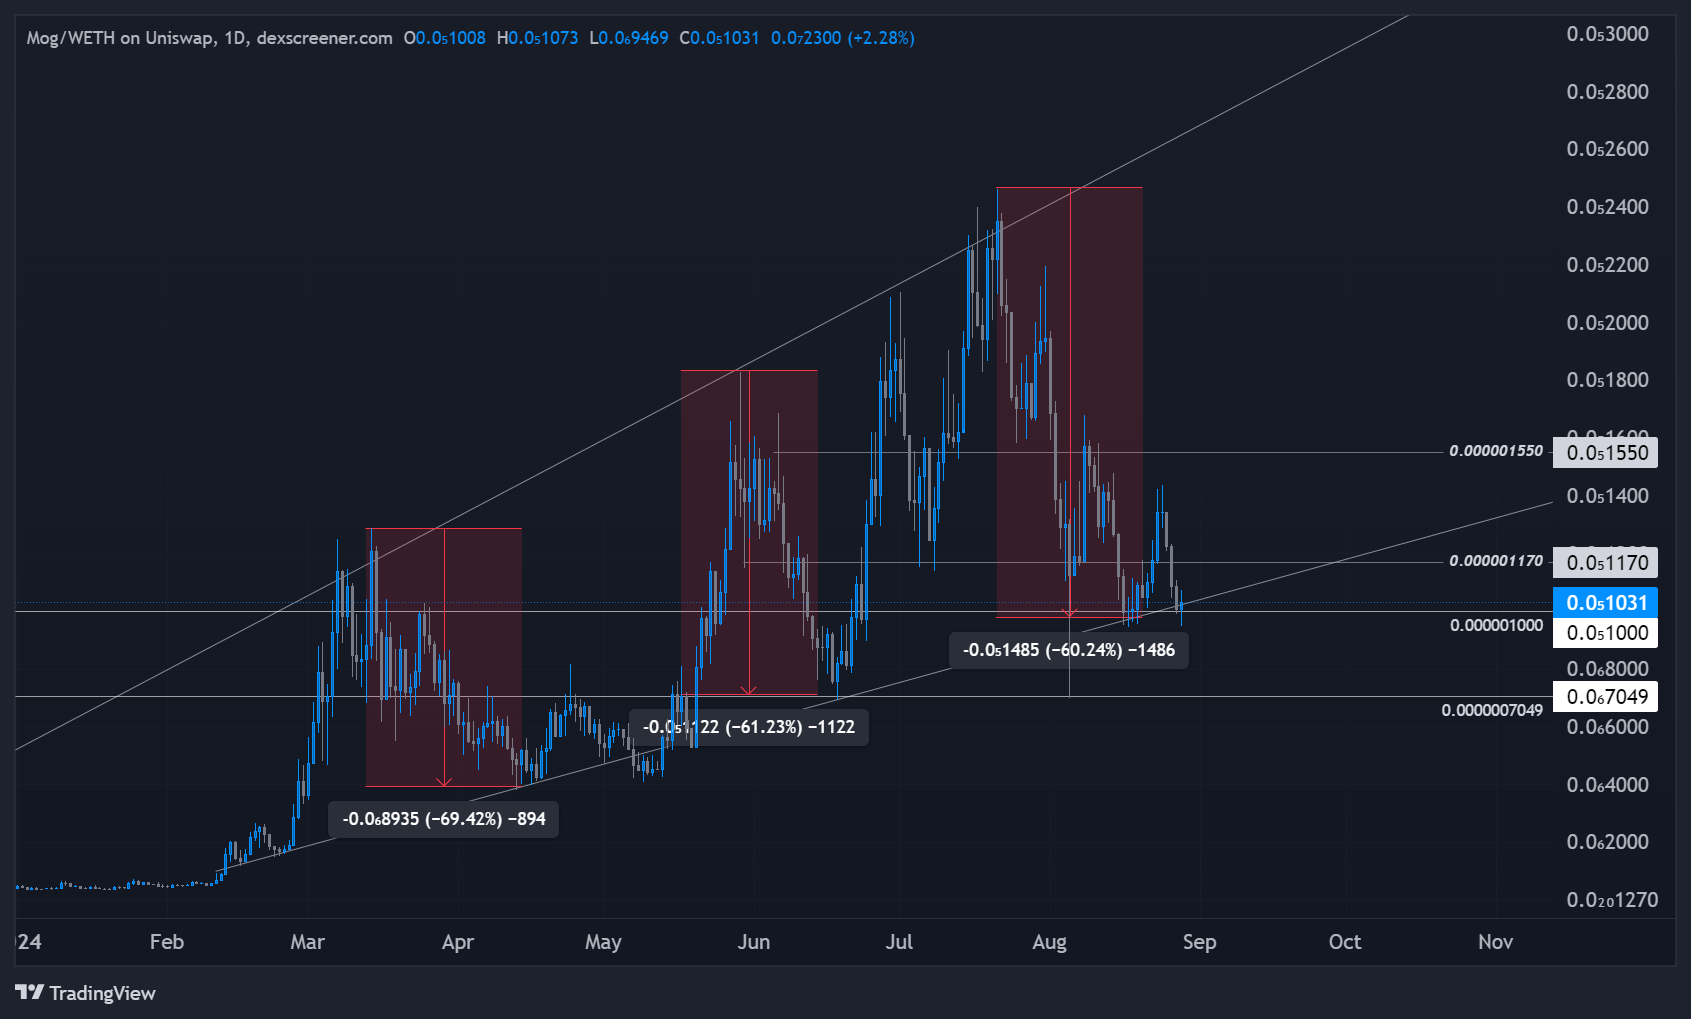
Let's delve into MOG's historical performance. MOG has displayed a pattern of sharp upward swings followed by notable retracements:- March 16th: MOG set a swing high, followed by a 70% retracement.
- May 30th: Another swing high was reached, leading to a 60% retracement.
- July 22nd: The most recent swing high resulted in a retracement of about 60%.

Areas to look to DCA
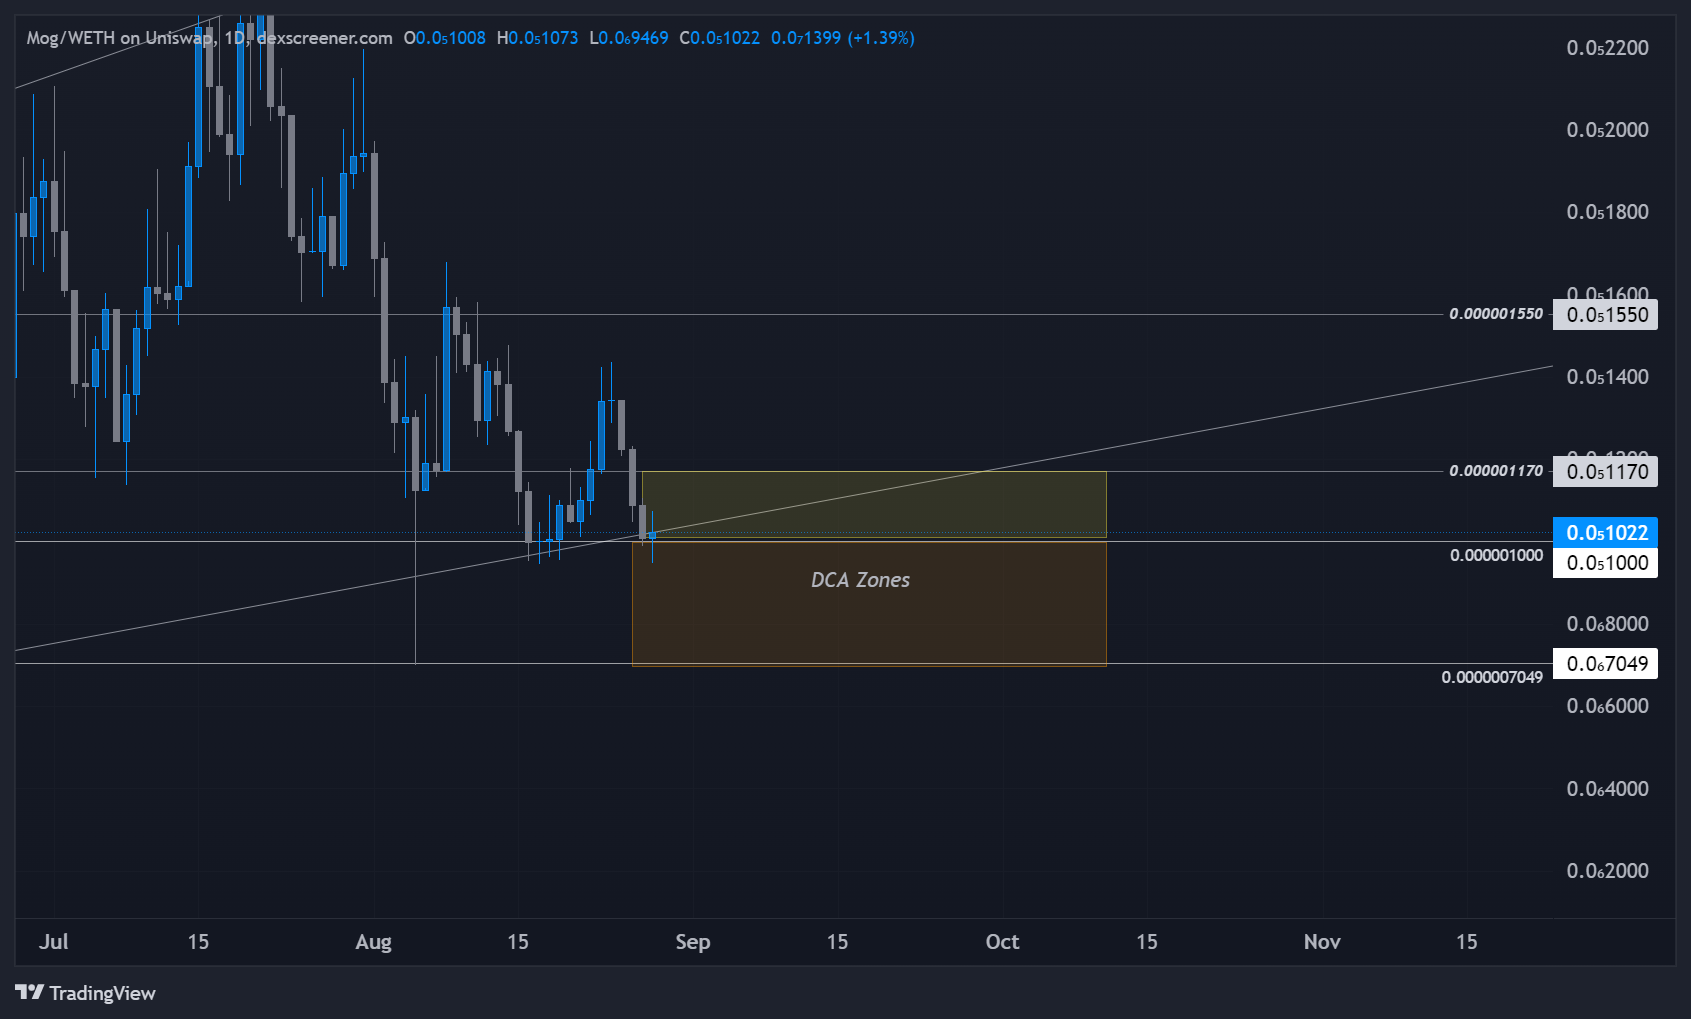
Given the healthy 60% retracement from the July 22nd high, we're currently trading between two key price points: 0.0000001 and 0.000001170. These levels offer potential opportunities for Dollar-Cost Averaging (DCA). If the price revisits the wick low of 0.0000007049, this would still align with MOG's characteristic retracements and could present an even more attractive DCA opportunity.The playbook
HypothesisMOG is likely to continue respecting its historical patterns of higher highs and higher lows, maintaining its strong bullish structure. The "crocodile's mouth" pattern we've discussed before is evident, indicating a robust trend. We expect potential upside from the current levels, with the possibility of strong surges similar to those seen after previous retracements.
Risk management
The strategy here involves DCA around the current price point of 0.0000001. If the price moves higher and reclaims 0.000001170, we can consider deploying more capital because this may mean structure has flipped and things change and price may move higher so this could be the last best chance at these generous prices.
Conversely, if the price drops to the wick low of 0.0000007049, we view this as a buying opportunity within a still-bullish structure. This approach allows for gradual accumulation while managing risk, ensuring that we're well-positioned whether the market moves up or revisits lower levels.
Cryptonary take
MOG has shown a clear pattern of sharp moves followed by significant pullbacks, and understanding these rhythms is key. By sticking to the levels we've outlined and using DCA smartly, we're setting ourselves up to ride the next wave, whether it's up or down. The market's going to do what it does. Our job is to stay on top of these patterns and capitalize when the time is right. Keep an eye on those key price points, and don't hesitate to adjust if the market gives us a new opportunity.Mog (MOG) price prediction today: Will it surge to new highs?
Aug, 9, 2024Is it set to surge? Explore key accumulation zones and bullish signals in this in-depth analysis.
Please note: The video above is set to start at the 15 minutes, featuring an in-depth technical analysis of Mog (MOG).
Moog has been displaying a very bullish chart, particularly on the weekly timeframe, which makes it a strong candidate for accumulation. The asset has recovered well from significant sell-offs and has formed a series of higher lows, indicating a strong demand base. We've identified key accumulation zones between 0.00001550 and 0.00001170.
These levels have shown resilience, and the recent formation of a strong weekly candle suggests that Moog could see further upside potential.
From an educational perspective, Moog's price action highlights the importance of identifying accumulation zones in a bullish trend. By buying within these zones, traders can position themselves advantageously for the next leg up. The strong weekly candle formation is also a bullish signal, indicating that buyers are stepping in at these key levels, which could propel the price higher in the near term.

Recommended from Cryptonary