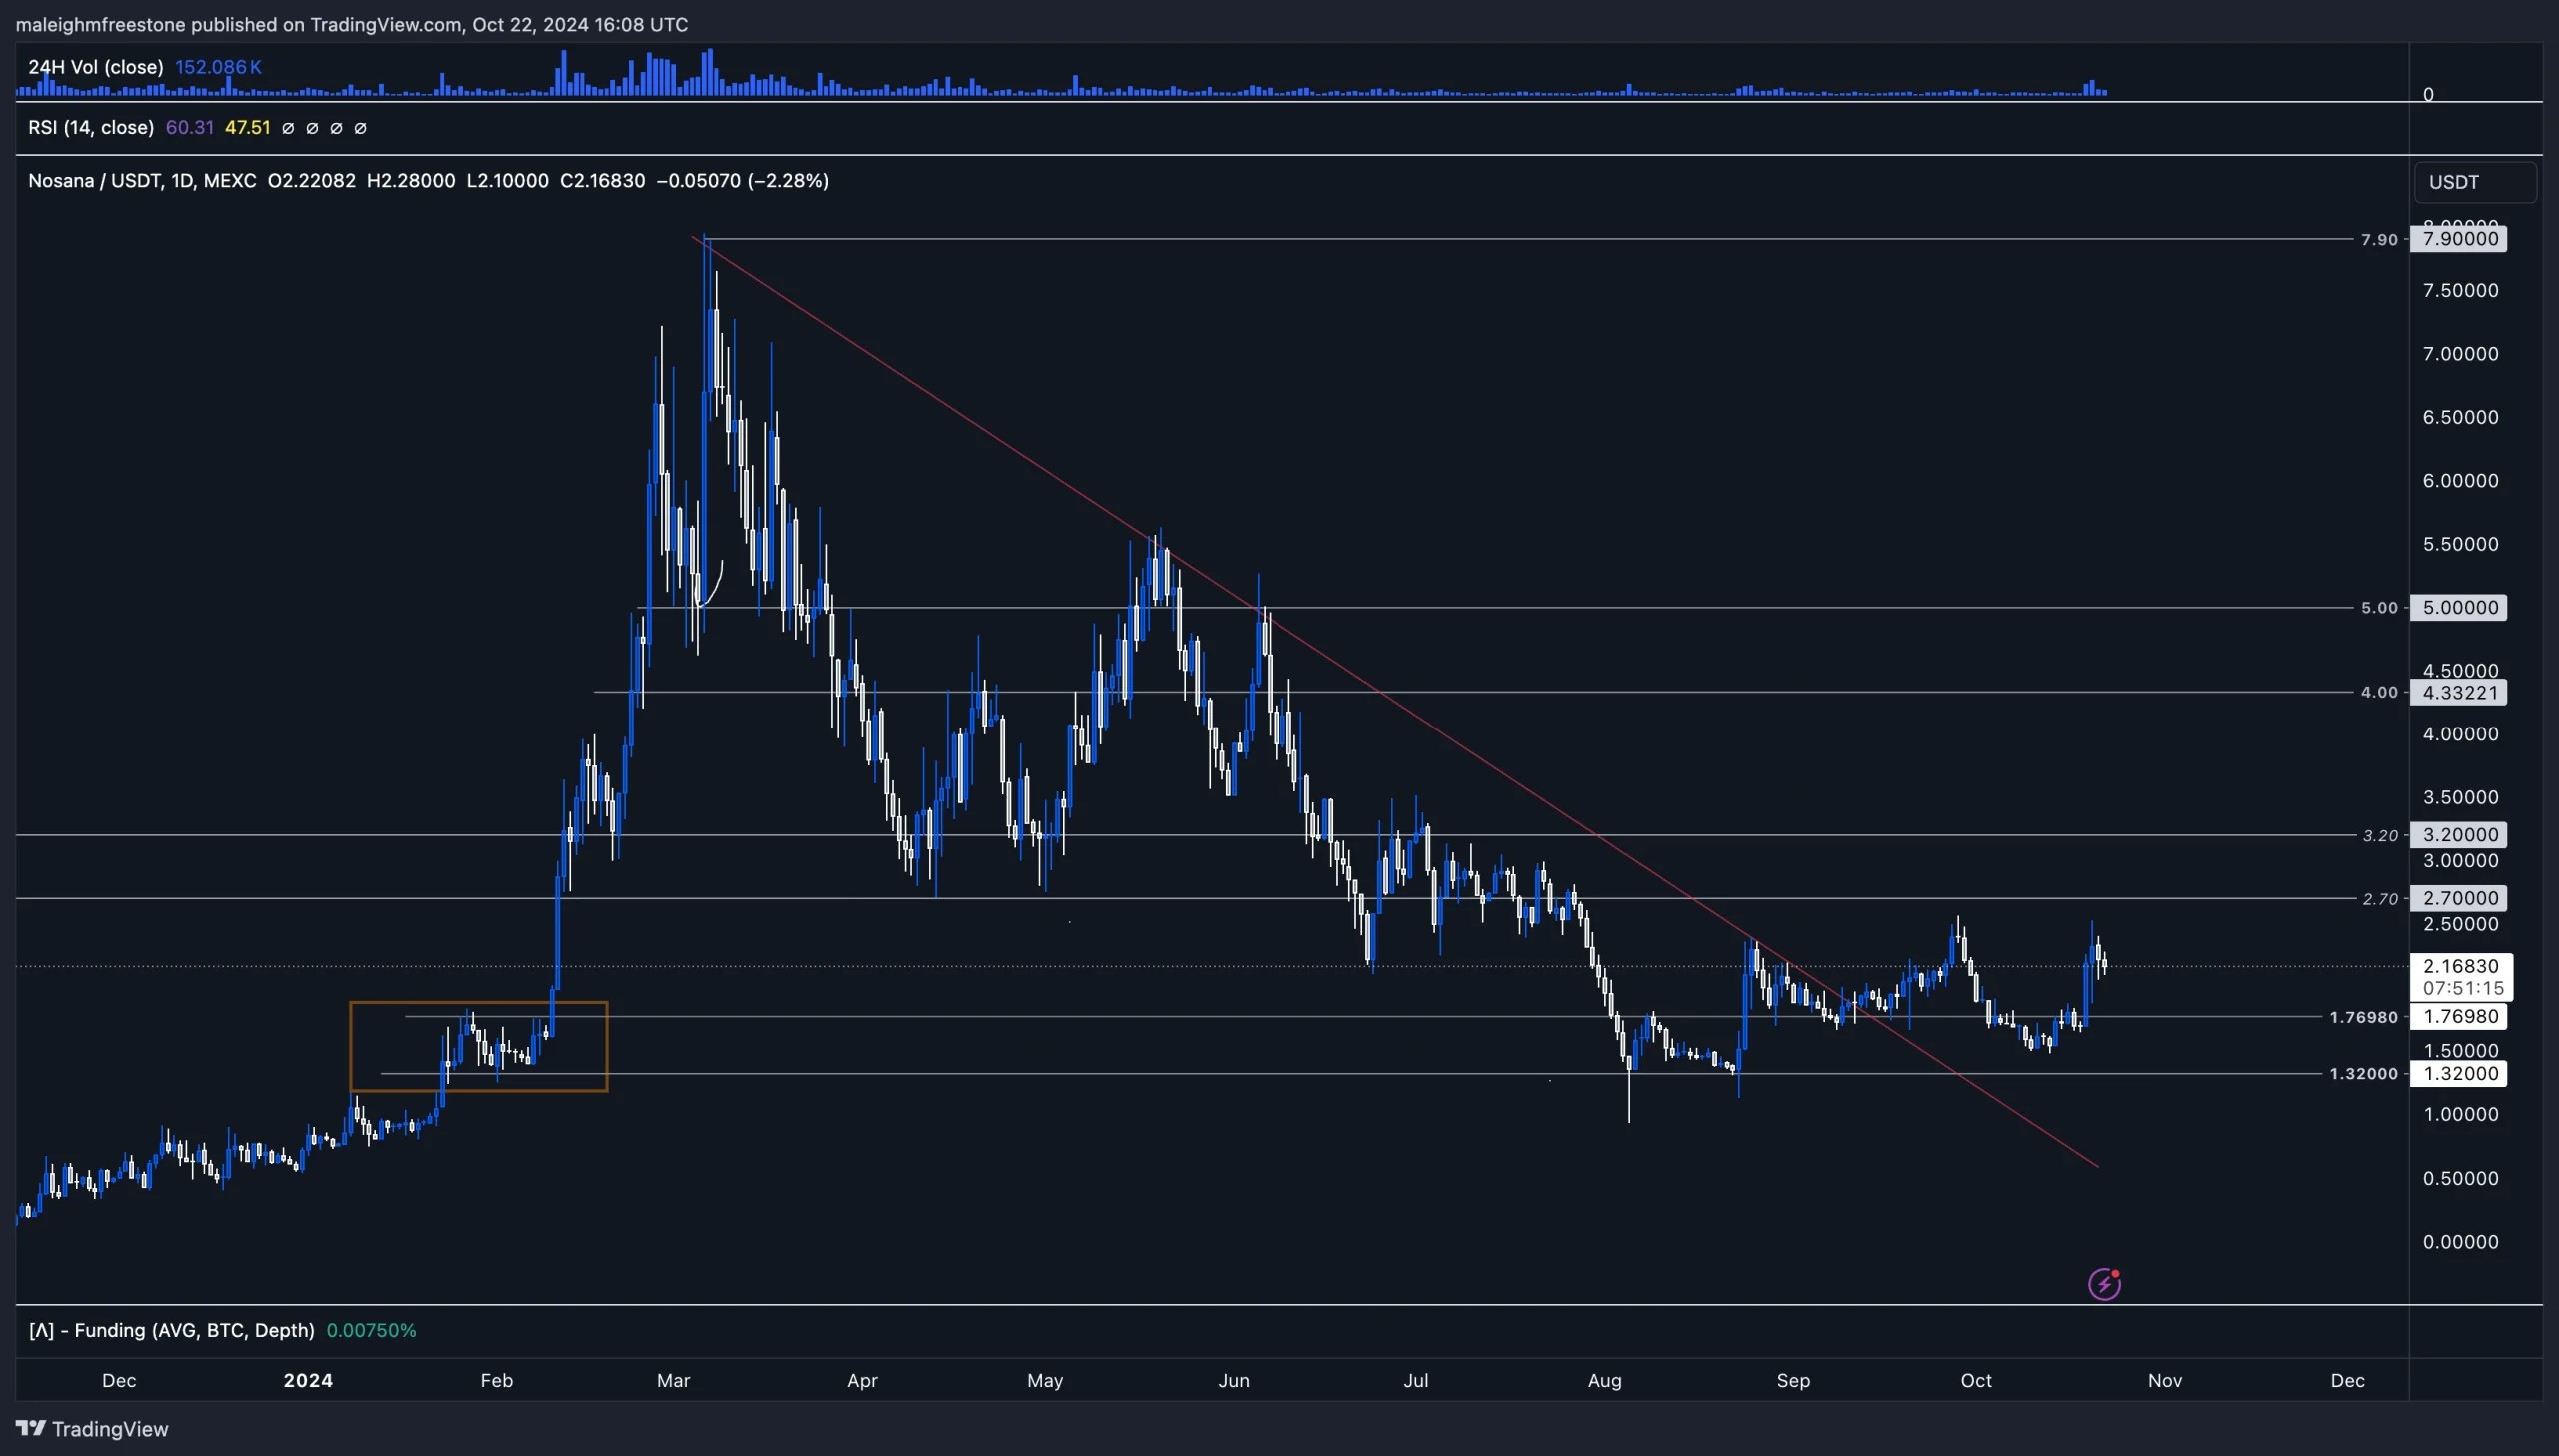
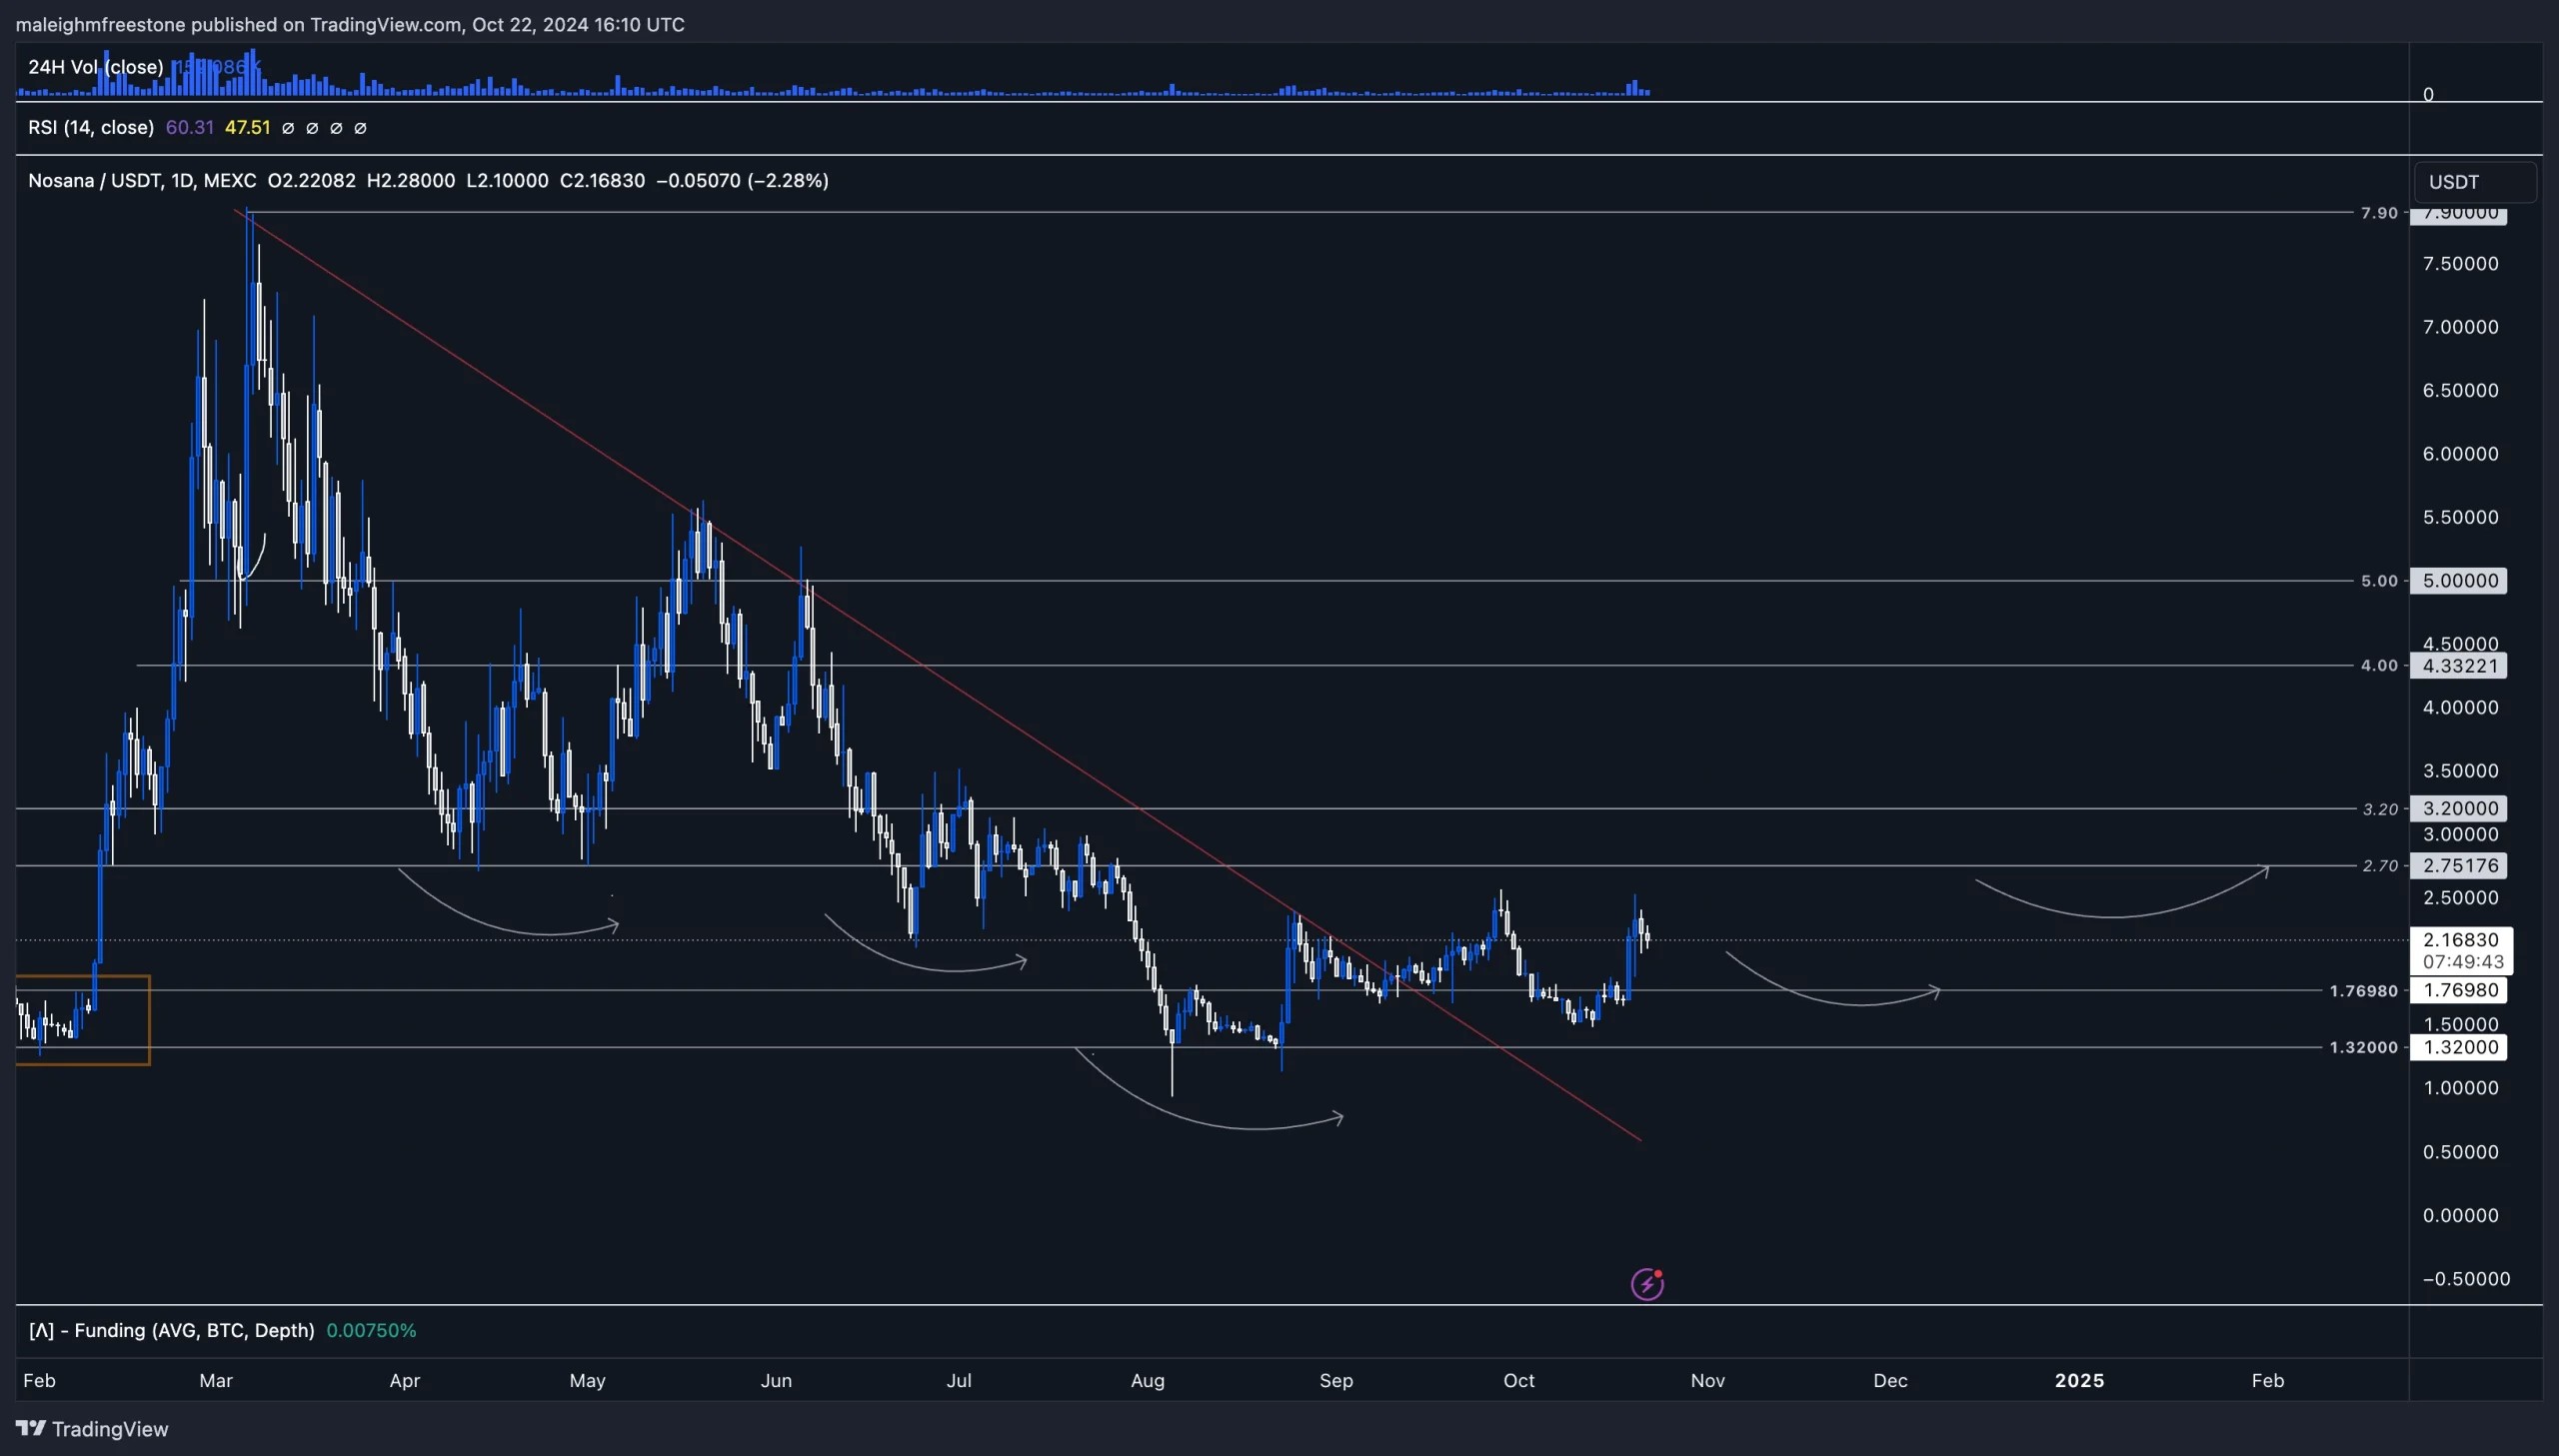
Log in

Technical Analysis

NOS technical analysis: Will it bounce off $1.32 or break $2.7?

Published: Oct 22, 2024
0
Share:

NOS has shown strong price action, holding around $1.32 support after profit-taking. This analysis explores if it can reclaim the $2.7 level or if more downside is ahead.

Post Feature Image

Disclaimer: This is not financial or investment advice. You are responsible for any capital-related decisions you make, and only you are accountable for the results.


Market context

Nosana has been one of the strong performers this cycle, generating significant returns for investors. Naturally, after such gains, we’ve seen some profit-taking and bearish price action, especially with the overall market lacking bullish momentum. The key level to watch is $2.7, which provided a nice opportunity back in April and held strong. We saw a 100% move off this level before respecting the bearish trend line and selling off even lower, hitting the $1 mark.

Another key level is $1.32, formed around late January/early February during a small consolidation before that massive 500% range expansion to $7.9. It’s interesting to note the hammer candlestick that formed on August 5th—a strong sign of demand at this level. This led to an 80% bounce, and we’ve since seen bullish buying pressure around the $1.5 to $1.76 price zone.

4. Nosana-USDT chart showing key support and resistance levels, with focus on the 2.7 and 1.32 zones.

Playbook

To see real bullish momentum, we would need to see a reclaim of the $3.2 to $2.7 price levels. If this happens, we can start targeting the highs around $7.9. While not invested in Nosana, it is a strong performer in our CPRO picks. On the higher timeframes, there’s potential for a large inverted head and shoulders pattern forming, which could signal a major shift in sentiment if the $2.7 level is broken and retested.

Key levels

  • $2.7 to $3.2 (key resistance zone to reclaim for bullish momentum)
  • $1.32 (key support from the consolidation phase before the large move)
  • $7.9 (Mid to Longer term) target on a successful break and retest of $2.7)
5. Nosana-USDT daily chart indicating potential rounded bottom formation and key breakout levels above 2.7 resistance.

Cryptonary’s take

Nosana has been in lower highs and lower lows structure, but with the rounding bottom on Total3 market cap and stronger alts showing strength, Nosana may be in a shifting position. Keep an eye on the key levels and watch for signs of sentiment shift as we potentially transition out of this lower high formation.


Get started for free

Create your free account or log in to read the full article.

By signing up, you agree to our Terms & Conditions
Recommended from Cryptonary
This Week's Setup: Fed Hawkish Cut Ahead?
PRO
Market Updates
This Week's Setup: Fed Hawkish Cut ...The market is preparing for a big announcement from the Fed. It sounds complicated, but the idea is ...
8 min read
Dec 8, 2025
BTC, ETH and More: Key Levels Are Being Rejected
PRO
Market Direction
BTC, ETH and More: Key Levels Are B...With volatility compressing and major assets colliding with critical zones, the market is setting up...
10 min read
Dec 5, 2025
Market Update: BTC Relief Rally Faces Resistance
PRO
Market Updates
Market Update: BTC Relief Rally Fac...Markets are moving fast, and every data release seems to shift the narrative. Weak labour prints, so...
8 min read
Dec 5, 2025