Save 23% ($351) & Get a Free 1-1 Call with our Team ⏰ : 0d 2h 59m 43s
First, brace for potential volatility around Nvidia's earnings release today – earnings beat plus positive guidance is green; anything less, and we could see some red.
However, the real fireworks should come later in the week with the highly anticipated SEC decision on Ethereum ETFs.
What's more, you get a first-hand glimpse at the Cryptonary memecoin index. This is still a work in progress, but it will be another great tool as the bull run continues.
TLDR
- Nvidia earnings and potential Ethereum ETF approval could drive volatility today.
- The macro environment is calm ahead of GDP and income/spending data next week.
- Leveraged traders have piled into Ethereum, setting up the risk of volatile unwind after the ETF decision.
- Bitcoin has broken out of the bull flag pattern, and we are targeting $80k by the end of June.
- We are introducing Cryptonary's new Memecoin Indexes to track major meme token themes.
Disclaimer: This is not financial or investment advice. You are responsible for any capital-related decisions you make, and only you are accountable for the results.
Macro data
This week is quiet on the macro front until next Thursday and Friday, when we'll get the GDP and the Income and Spending data. But with that data still 8-9 days away, on the macro front, we're relatively in the clear for the next 1-2 weeks.This evening, however, we do have Nvidia Earnings out. Now, this has the potential to move the market, especially if they don't beat the consensus.
Alongside this, the forward guidance on the call will be important. If Nvidia guides that they still expect further growth going forward, then risk assets can react well to this, which'll help prop up the risk asset markets.
Overheated market + ETH ETF decision
Since the news broke that the SEC may actually be looking to approve the ETH ETF - likely due to Trump endorsing crypto and Biden and the Dems not (pushing Biden to have to start endorsing it) - the market has reacted violently to this.This is especially understandable considering how under-allocated the market was to ETH based on the prevailing negative sentiment for ETH.
What we saw on the day was a bid into ETH that took ETH from $3,142 to $3,600 in two hours. Over a 24-hour period, ETH added the equivalent of SOL's market cap to its total market cap—that's how big the move was.
Since the SEC swiftly changed its stance on potentially approving the ETH ETF, the Funding Rate has moved up to 0.013%, meaning there is now a bias toward being long rather than Short.
Again, this is understandable, and the Funding Rate hasn't actually run away as expected. So, if we look at the Open Interest (the amount of leverage added), it's increased massively. ETH's Open Interest is now 50% greater than the excess we saw in late 2021 and 20% greater than what we saw a few months back in March.
ETH's open interest
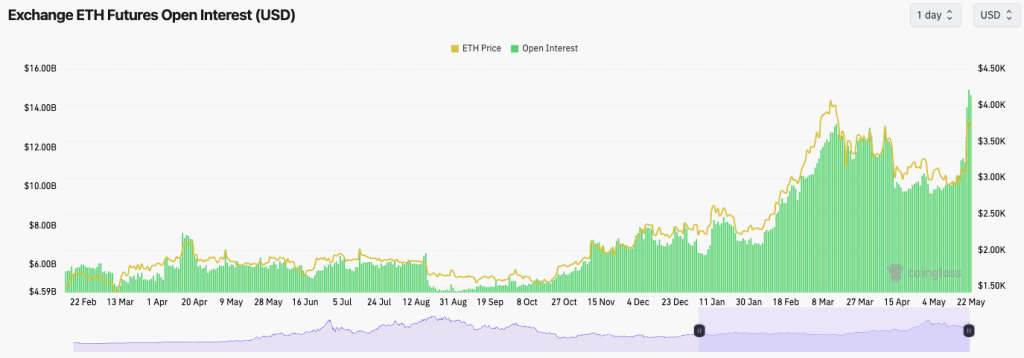
This is a huge increase in the amount of leverage, and you would expect this to unwind at some point, likely within the days that follow the ETF decision. We will likely see much of this leverage unwind immediately after the decision.
So, the suggestion here would be to be super careful about Longing or Shorting ETH in and around the decision and even in the days that follow it. Other altcoins are likely to move based on whether this is approved or not and are also expected to be extremely volatile.
Long-term, if an ETH ETF is approved (which now looks likely), then that'll be super bullish for the space and would then likely mean it's only a matter of time before we see other ETFs, SOL, DOGE, etc. Larry Fink hasn't set this up to run a Bitcoin ETF only; if he can rinse and repeat for more ETFs, he and Blackrock will likely do that.
Cryptonary's memecoin index
Building a memecoin index is extremely tricky and requires a great deal of experimentation (as you may be able to tell from the numbers in the weighting systems at the top).In addition, some coins have existed for longer periods. This makes compiling the data for several coins much more difficult. However, our Head of Analysis has created a few indexes that we will continue to build on.
Today, we're going to release two indexes. The first meme index will include the Big Caps OG memes. The second will be a Meme Index that consists of some of the new coins and some of the more reputable meme coins in the space.
Note that these indexes are made up of compiling different coins together and then applying a different weighting to each overall coin.
- Index 1 is made up of DOGE, SHIB, PEPE, BONK, FLOKI
- Index 2 is made up of PEPE, BONK, WIF, POPCAT, MYRO
We will consistently build on and improve on these in the future, but even in the current state, you'll find them useful for your memecoin trading and investing decisions.
Memecoin index 1
Interestingly, Index 1 put in a local peak simultaneously with the crypto USD liquidity indicator.In recent weeks, we have seen liquidity begin to pick up again, and we expect this to pick up with a more substantial size going into Q3. This should support this index, along with crypto, in general, moving higher.
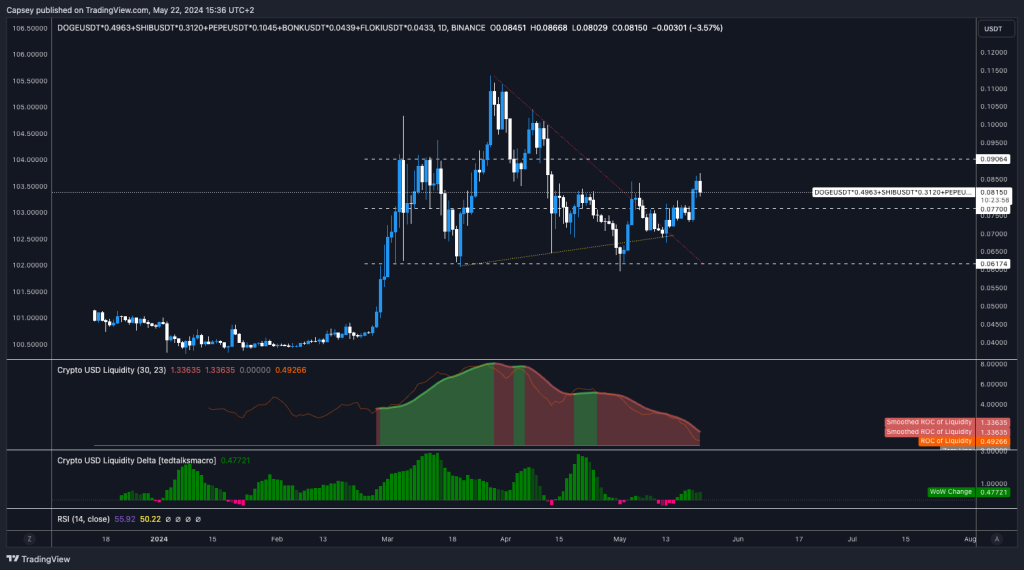
In the chart above, we can see that there are three key horizontal levels: 0.06, 0.077, and 0.09. The breakout for the large-cap memes will come when this index breaks above 0.09. For now, this index has managed to get back above the middle horizontal line of 0.077 and is trending higher.
In the short term, you'd want to see 0.077 hold as support, as it was local resistance before the price broke to the upside.
Overall, the chart is relatively bullish, though. As mentioned above, the concern would come if the price loses the 0.077 level.
Memecoin index 2
The memecoin index has a really interesting chart. If price can get above a few key levels, some serious upside could be had.Overall, price has moved within this large pennant-like pattern, holding the 0.59 horizontal level. Price has reclaimed above 0.73 and has two more horizontal levels above the current price, at 0.83 and 0.93. If price can surpass both these levels, we likely see an explosive break to the upside.
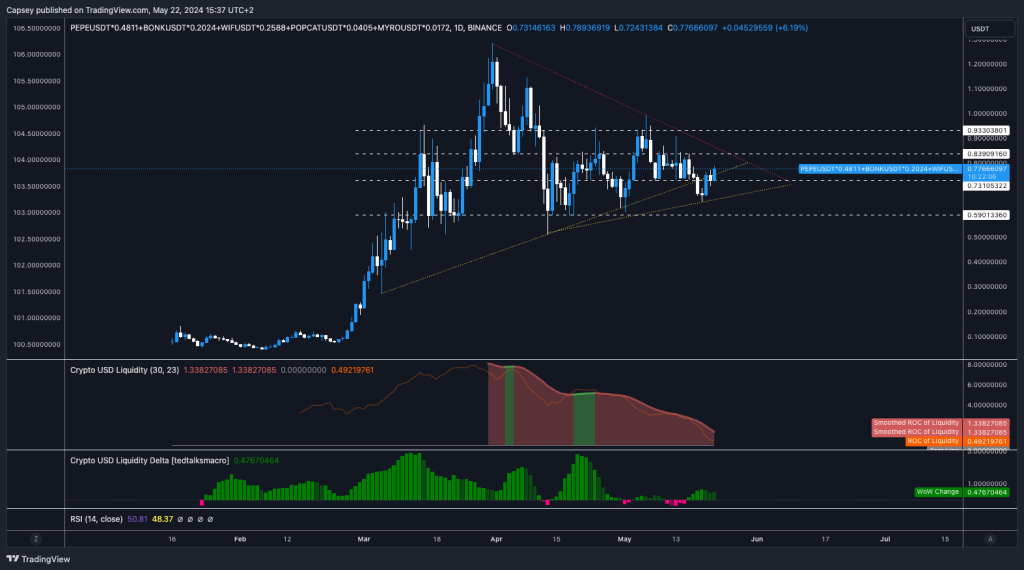
We have seen slight deviations on both indexes below the shallow slanted uptrend lines, but prices have recovered well.
We will closely monitor this metric to see if price can break above 0.83 or if it breaks down below 0.73.
The direction in which price moves aggressively depends on which key level is broken first. Over the coming months, all eyes will be on these metrics.
BTC
We will keep BTC relatively brief.We're pleased to finally see Bitcoin break out to the upside of its bull flag pattern. Our next key area was the horizontal level of $68,900, which we thought would be short-term resistance. Fortunately, price smashed through that level and has since pulled back slightly, using the horizontal level of $68,900 as new support.
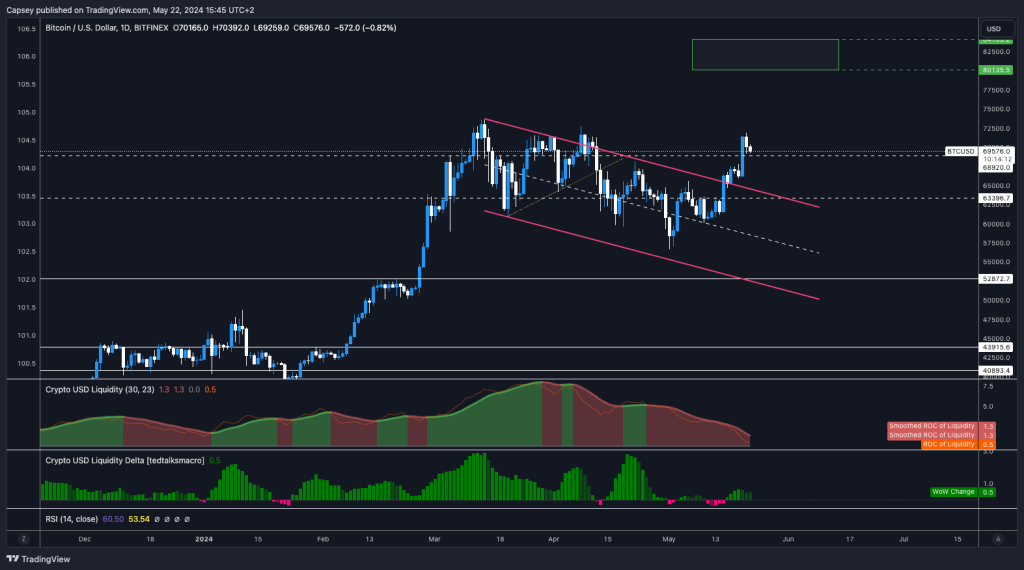
If price can hold this level, this would be very bullish and provide a very bullish outlook going forward.
Overall, we've called Bitcoin relatively spot-on since March, so we continue to be calm with it and let it ride. We expect to see $80k before the end of June.
Cryptonary's take
There have been no changes or adjustments to our portfolio for now. We continue to hold the barbell strategy of BTC, ETH, SOL, WIF, and POPCAT.Once liquidity begins to improve more substantially again going into Q3, we'll look to divest from some of the majors (BTC and ETH) and invest more in memes and altcoins.
On memes in general, over the last few weeks, we've seen the majors begin their moves higher to retest the highs from a few months back. Memes and alts usually lag. Once the majors (BTC, ETH and SOL) have made their moves higher, they'll likely slow down and consolidate.
In this period of consolidation, we'd expect capital to rotate into alts and memes, particularly memes. For now, keep it simple: majors and blue-chip memes. Let the market do its work for you.
From Q3 onwards, we'll become more aggressive (risk-on) in our approach.
Recommended from Cryptonary


