Save 23% ($351) & Get a Free 1-1 Call with our Team ⏰ : 0d 2h 59m 43s
On-Chain Forensics 22
In today’s report, we will be looking into BTC. We look at the recent activity of short and long term investors to gauge their sentiment. The on-chain analysis indicates that investors are holding onto their BTC and are not selling, despite being in profit. However, accumulation at this price level has slowed down.

Key Points:
- The number of Bitcoins on Exchanges has continued decreasing since June 2021, indicating an increase in the amount of Bitcoins being hodled.
- Short term investors have booked some profits (derisking), whilst selling from long term investors in this most recent leg up to 50,000 USD is nearly non-existent.
- When Bitcoin price has decreased, investors have been willing to hold rather than to sell into Losses, indicating that their conviction remains strong.
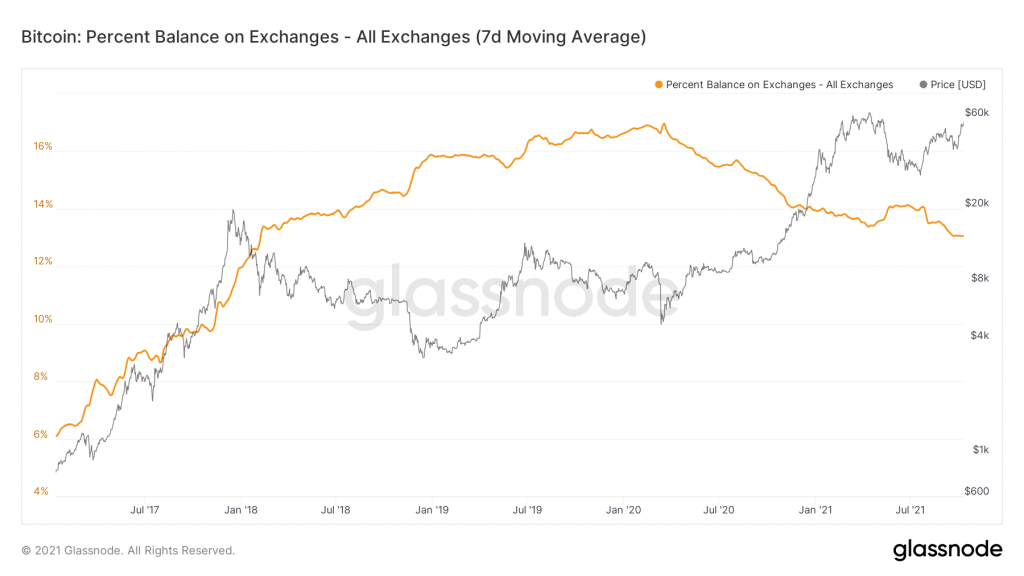
Metric 1 – Exchange Balance (Percent)
Let's start with the Exchange Balance, which shows us the percentage of the circulating supply of BTC being held on Exchanges.The higher the % on exchanges, the more selling pressure exists. Since the start of 2020, there has been a steady downtrend of the circulating supply that is being held on Exchanges. The decrease in the % and hence the decrease in sell side pressure has been reflected by the increase in price. Recently this downtrend has slowed, and the line has flattened over the last month. There are three possible scenarios:
1 - Exchange supply goes up; increase in selling pressure; decrease in price
2- Exchange supply stays flat; market churns and moves sideways
3 - Exchange supply goes down; decrease in selling pressure; increase in price
Whichever scenario occurs will show us the current market sentiment. Now let's look at what long and short term investors are doing.
Metric 2 – Coin Days Destroyed (CDD)
Let's look at the Coin Days Destroyed (CDD). It is calculated using all Bitcoin transactions by taking the number of Coins in the transaction and multiplying it by the number of days since those coins were last spent. The longer a coin hasn’t been used before a transaction, the higher the metric. Large spikes indicate that a large number of coins which have been held for a long period of time are being moved. Such spikes indicate that long term investors are selling. We have had some sizable spikes this year. This will have been some long term investors offloading some size into the price spikes. However, since the start of 2021 there has been a steady downtrend, indicating 'fresh' coins are the bulk of transactions; short term investor activity.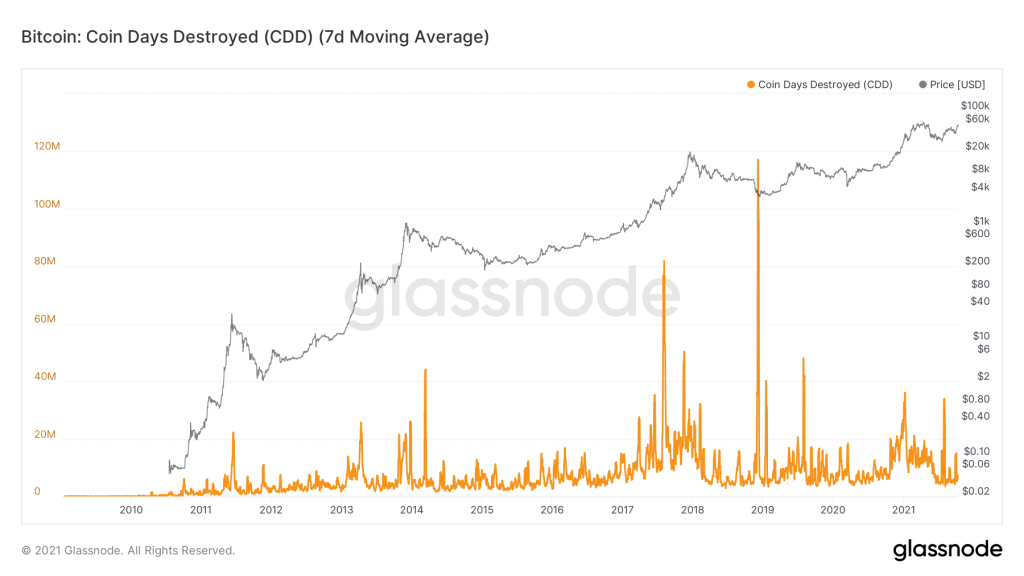
Metric 3 – Spent Output Lifespan 3-6 Months
Let's focus on individual cohorts starting with the investors who purchased Bitcoin 3-6 Months ago. The selling (orange spikes) has been into the price decrease in both May and September of this year. Short term investors are known for panic selling but are happy to hold while prices are increasing. They usually take action when there is a significant price drop, selling at a loss, and this is reflected below.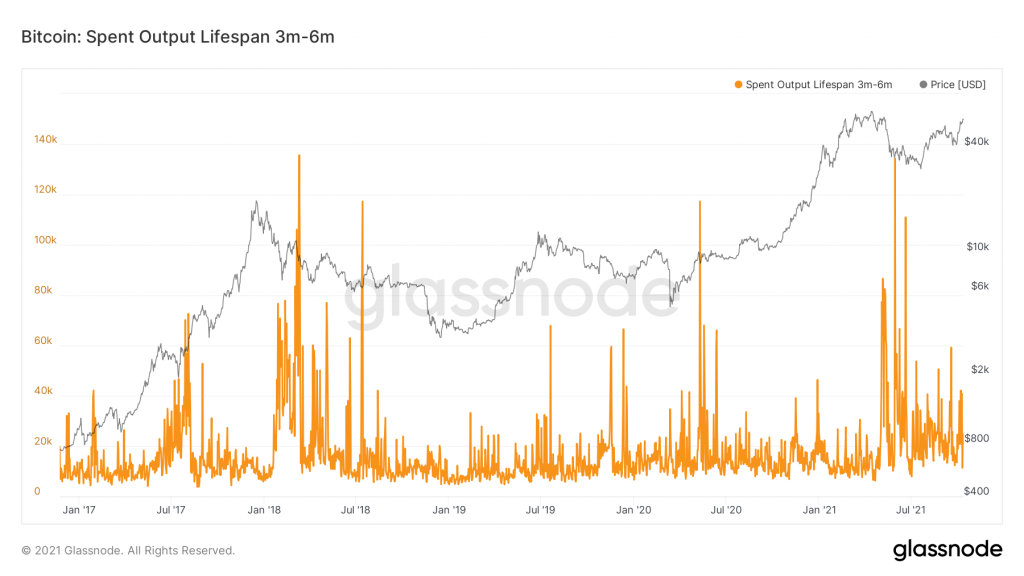
Metric 4 – Spent Output Lifespan 1-2 Years
The 1-2 Years cohort of investors have a different type of selling behaviour than the shorter term investors. Recently some selling from long term investors occurred, but this has dropped off now, and selling from this cohort is now near non-existent. The amount sold by this cohort, is relatively small compared to their previous sell offs and the selling that occurred before the most recent crash. This indicates to us that this cohort of investors has conviction in BTC and wants to retain their exposure, especially with a possible ETF on the way.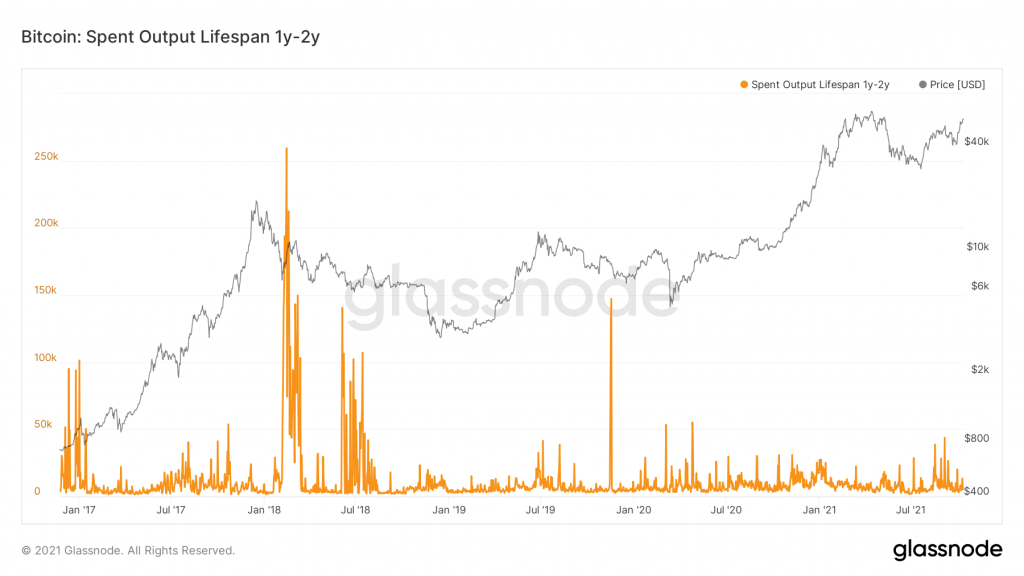
Metric 5 – aSOPR
The adjusted Spent Output Profit Ratio is the Price sold / Price paid. This shows us if investors are currently in profit. Above 1.0 and investors are in profit, below 1.0 they are showing a loss. In our previous report we highlighted the importance of the aSOPR bouncing up from 1.0. This is what happened, indicating that most investors were not willing to sell to avoid a potential loss and are happy to continue holding.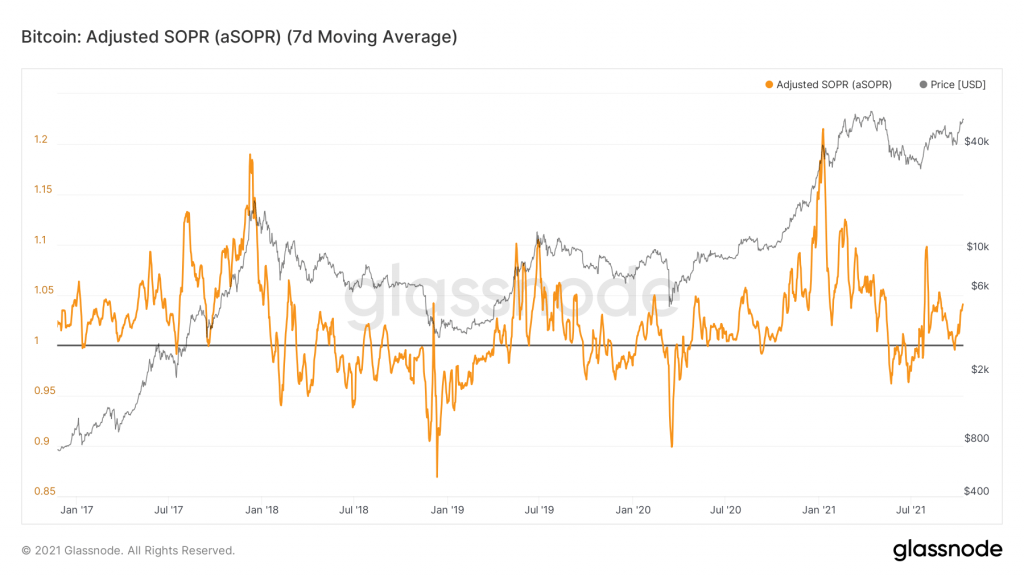
Recommended from Cryptonary


