Save 23% ($351) & Get a Free 1-1 Call with our Team ⏰ : 0d 2h 59m 43s

Key Points:
- The Exchange Net Position Change shows that the market has been in a large accumulation phase which came to a close. We saw a spike in ETH accumulation coinciding with the approach towards ATH prices, indicating some form of panic buying. If the trend of accumulation continues it will indicate a new accumulation phase based on strength.
- From May 2021 onwards, there has been a steady accumulation of more ETH from investors with signifcant holdings (>32ETH).
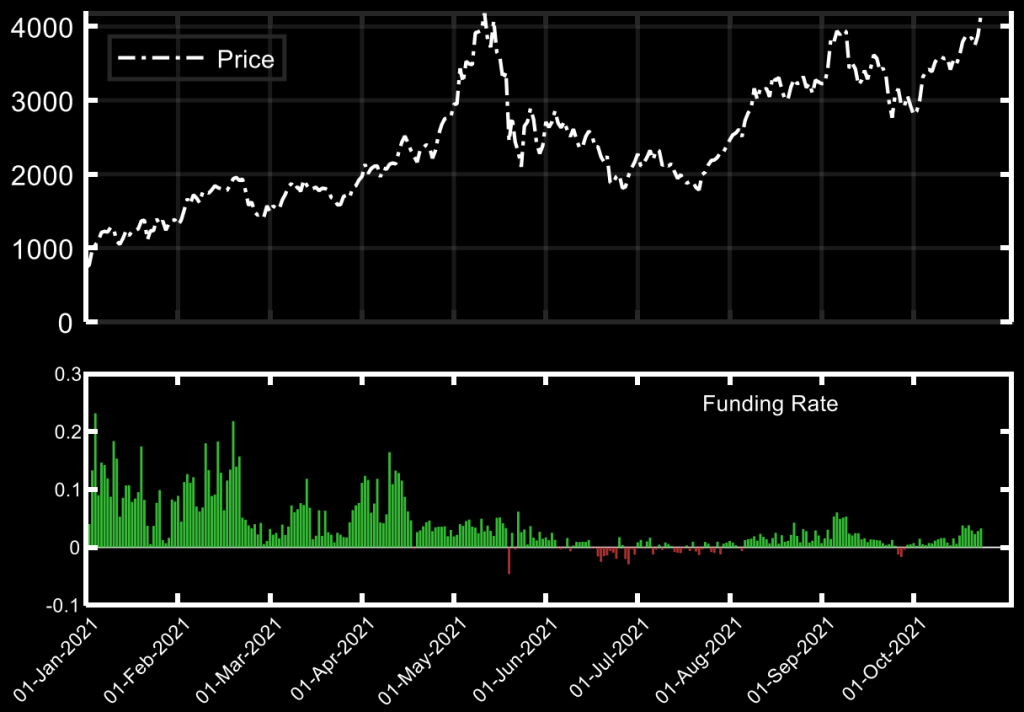
- The Funding Rate has seen a continued increase. Such increases have indicated violent corrections in the past few months and is something to keep an eye on if you have any kind of leveraged exposure.
Metric 1 – Exchange Net Position Change
As usual, we will try to interpret investor sentiment by looking at the Exchange Net Position Change. In the previous reports we outlined what we expected to see occur after these new ATHs. See the below excerpt from the previous report regarding Ethereum:
Since March 2020 you can see a consistent pattern. Small variations between green/red bars, and then significant red bars indicating accumulation. These periods off heavy accumulation are followed by a small selling spike. The red spikes are what drive price increases, as the available supply is decreased due to this accumulation. We saw this pattern play out on the leg up to 4,000USD. Another accumulation should follow with a potential ETF on the way. This will also show us if we remain in a bull market.
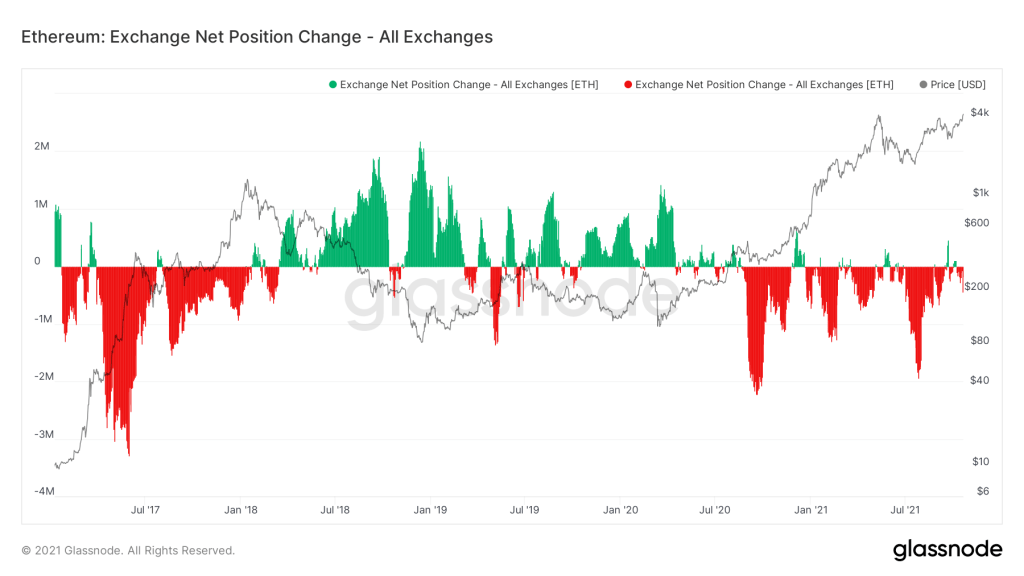
In the last few days, Ethereum is looking to make new All-Time-Highs, following Bitcoin. This has led to what looks like some ‘panic buying’. The red spikes might indicate the start of another accumulation coinciding with a continuation of the bull market. Ideally this red spike would continue further, indicating investors are still willing to accumulate, and see potentially further upside.
Metric 2 – Address Balances
The next metrics we will investigate are the number of Wallets holding more than 32, 100 and 1,000 Ethereum Coins. The reason we track the Number of Addresses with a Coin balance greater than 32 Ethereum Coins is because this is the amount of Eth needed to become a validator for Eth 2.0.
Larger wallet balances convey conviction and can also create market movements due to their size.
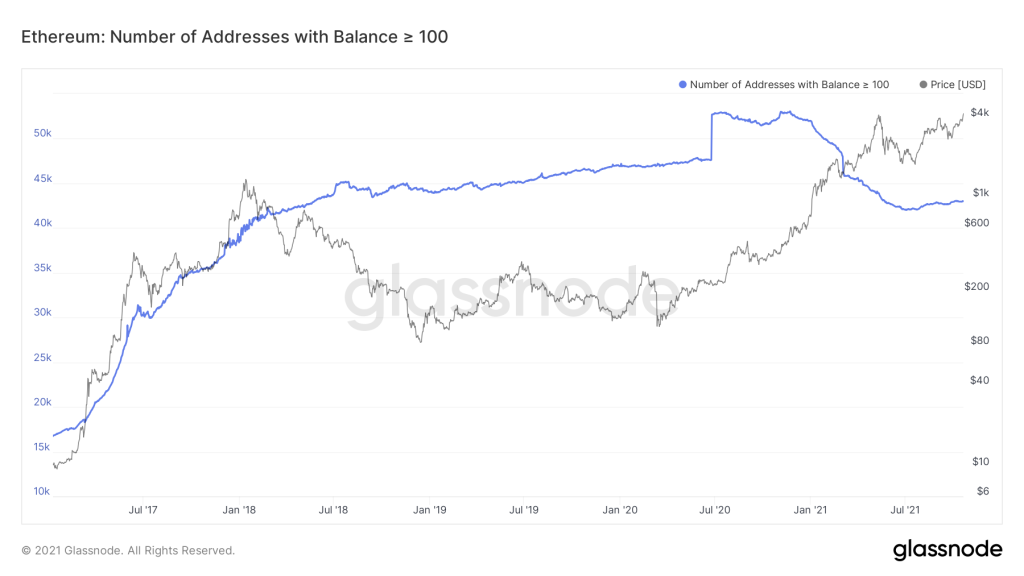
These investors sold a significant part of their holdings at the start of the year, selling into strength. Since June 2021, the price has been climbing but so has the amount of Wallets holding more than 32, 100, and 1,000 Ethereum Coins. The increase has been gradual, coinciding with what has been portrayed by the Exchange Net Position graph above. This conveys the aforementioned conviction and indicates that Large Investors have been willing to accumulate/add to their already large existing holdings during this period.
Number of Addresses with Balance > 32 Eth
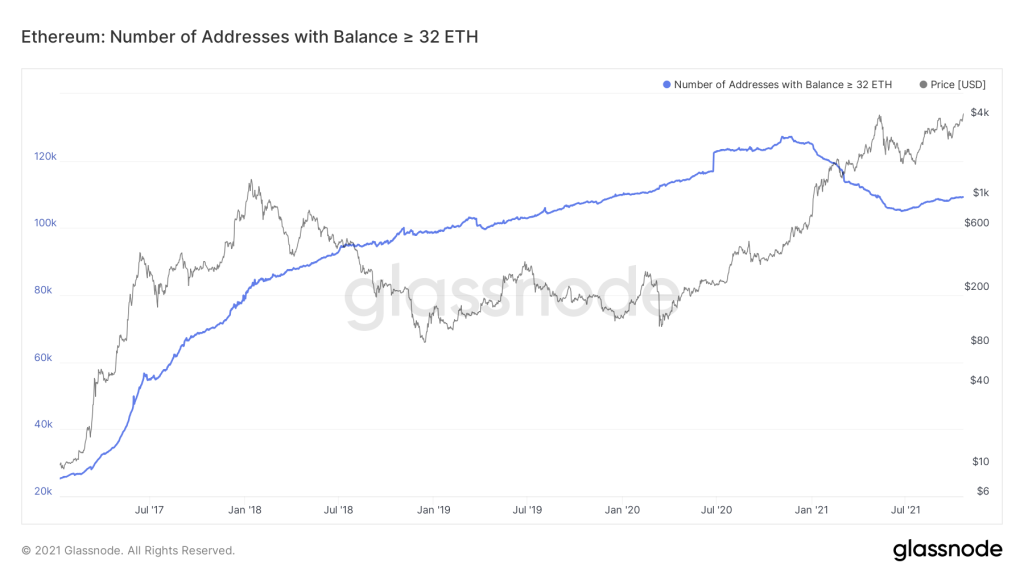
The increase in price is a barrier for entry as well, as the cost of having an ETH2.0 validator continues to increase. The market will indicate to us when it believes that ETH is at its fair price, with a flattening or decrease of the blue lines. This would indicate that these investors are no longer adding to their holdings and are in fact reducing their holdings (selling/profit taking on some of their Coins). The metrics for all the wallet balances exhibit the same behaviour.
Out of these cohorts, the most significant cohort to watch is the Number of Addresses with Balance > 1,000 Eth, as these are the Whales and will more than likely be the cohort that sells closest to the top. If anything, this is the cohort that determines the top.
Number of Addresses with Balance > 100 Eth
Number of Addresses with Balance > 1,000 Eth 
Metric 3 – Futures Perpetual Funding Rate (All Exchanges)
The Funding Rate of Perpetual Futures Contracts is a good indicator of both market sentiment, and the leverage present. When the rate is positive, long positions pay short positions. Conversely, when the rate is negative, short positions pay long positions. The reason for this is that Exchanges need to incentivise traders to take positions on the other side of the majority of positions being taken. This ensures that the Perpetual Futures Price does not significantly differ too much from the actual spot price of the asset being traded.
When Funding Rates become too high and are positive, Longs are paying Shorts. This incentivises taking up short positions to receive the Funding Rate payout. If enough shorts come in, the price is pushed down leading to liquidations of overleveraged longs. This triggers a chain reaction of cascading liquidations, as was the case with recent market crashes. Check the graph below, every time we see a spike in leverage (big green bars) it is followed by a price crash. Retracements are fast and violent when the market is overextended. Currently funding rates are high, not at the levels we saw earlier in the year, but close to the levels seen in prior to the September crash. This is a warning that leverage is dangerous and we are due some market volatility. This is also outlined in the most recent multi-format analysis.
Recommended from Cryptonary